Cite this Article

Shi Hui, Zhang Xi-Yan, Dong Wei-Li, Mi Xiao-Yun, Wang Neng-Li, Li Yan, Liu Hong-Wei. Effect of co-doped metal caions on the properties of Y
2O
3:Eu
3+ phosphors synthesized by gel-combustion method.
Chinese Physics B, 2016, 25(4): 047802

School of Materials Science and Engineering, Changchun University of Science and Technology, Changchun 130022, China
† Corresponding author. E-mail: sh_1985@126.com
‡ Corresponding author. E-mail: xiyzhang@126.com
1. IntroductionYttria has been widely used as the matrix material due to its fascinating properties, such as high chemical stability, high fusing point, good thermal stability and good optical performance. Yttria doped with Eu3+ ions is a kind of red fluorescent material with high luminous efficiency. It has good performance in the fields of cathode ray tube, field emission display, plasma display, etc.[1–3]
Alkali metal has been used as an additive material in order to improve the performances of materials.[4–8] The doped ions could enhance the transition probability of the rare earth ions. The luminescence intensities of SrAl4O7:Mn4+, SrZn2(PO4)2:Tb3+, Sr3B2O6:Ce3+, Eu2+, BaZn2(PO4)2:Sm3+, and AMgPO4:Eu3+ increased when the alkali metal ions were added. The color purity also increased.[9–13] The alkali metal ions co-doped Y2O3:Eu3+ phosphors with the quenching concentration achieving up to 12% mol were prepared and studied in Ref. [14]. As Na+ and K+ ions were added, the photoluminescence intensity of the Y2O3:Eu3+ TFP was improved by 3 to 4 times. The lifetime of Na+ and K+ co-doped Y2O3:Eu3+ thin film could be adjusted by the molar ratios of Na+ and K+ ions.[15] References [16] and [17] reported that the luminescence intensities of samples doped with zinc increased. The phosphors were more suitable for the usage of field emission display.
The alkaline earth ions have the similar properties to alkali metal ions. The valence state of the alkali metal ion is +1, and that of the alkaline earth metal ion is +2. The difference of valence state between the metal ions and rare earth elements gives rise to a distortion of the rare earth oxides crystal field, affects the development of a lattice, and improves the optical performances of the materials. In the present study, Y2O3:Eu3+ phosphors co-doped with different alkali and alkaline earth metal ions are prepared by using the gel-combustion method, with glycine used as the fuel. The crystalline phase and optical properties of samples doped with different metal cations are analyzed. The energy level transitions of Eu3+ doped with different metal cations are also discussed in the paper. The luminescence properties and fluorescence lifetimes of samples with different doping concentrations of metal cations are studied.
2. Experiment2.1. SynthesisAll raw materials used for synthesizing phosphors were of analytical reagent grade. A stoichiometric ratio of solid oxides of yttrium and europium was dissolved in aqueous nitric acid for 0.5 mol/L. The doping concentration of Eu3+ was 5% mol. The metal nitrates (LiNO3, NaNO3, KNO3, Mg(NO3)2, Ca(NO3)2) and glycine as the fuel were dissolved in the rare earth nitric solution under continuous stirring for 1 h and the molarity ratio of cations and glycine was 1:3.33. The transparent gel was obtained after the solution had been heated in the water bath at 80 °C for 8 h and dried at 100 °C for 24 h. When the dry gel was heated at 400 °C, the combustion reaction took place and the puffy precursor powders were obtained. (NH4)2SO4 as the dispersant and the precursor were stirred with deionized water for 1h and dehydrated at 80 °C for 24 h. Y2O3:Eu3+ powders co-doped with metal cations were obtained by calcining the dispersed precursor at 1000 °C for 2 h.
2.2. CharacterizationThe x-ray diffraction (XRD) patterns were performed using a Rigaku D/max 2500 PC diffractometer in steps of 0.02° with a duration of 2 s per step in the 2θ range from 10° to 80°, and Cu Kα1 (λ = 0.15406 nm) was used as a radiation source, with an accelerating voltage of 20 kV and a working current of 10 mA. The JSM-6701F field emission scanning electron microscopy (SEM) was used to inspect the microstructures and morphologies of samples. The luminescence properties of samples were characterized by a Shimadzu RF-5301PC fluorescence spectrophotometer under the excitation of 254-nm ultraviolet light. The luminescence decay curves were obtained by phosphorescent spectrophotometer.
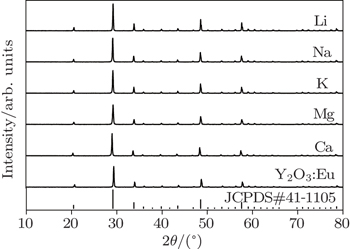
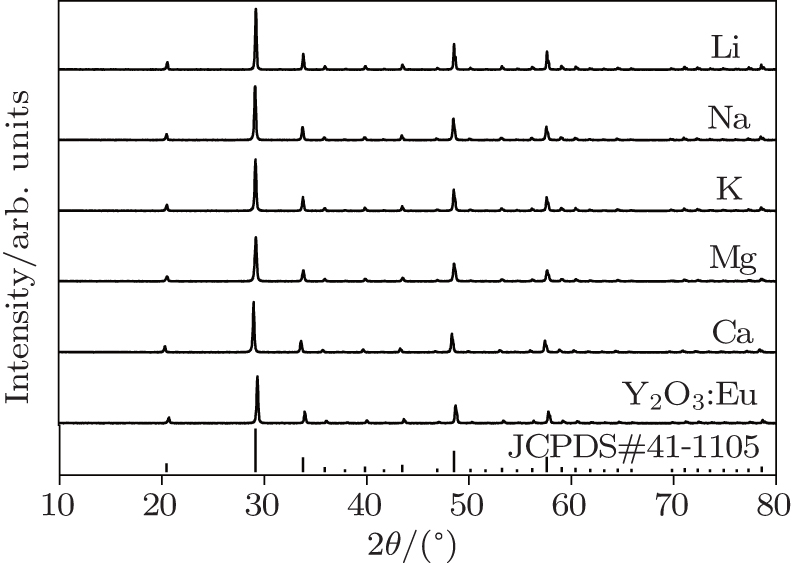
3. Results and discussion3.1. Phase analysisFigure 1 shows the XRD patterns of Y2O3: Eu3+ phosphors co-doped with diferent metal cations calcined at 1000 °C for 2 h. The compositions of the phosphors are fixed to be concentrations of doped Eu3+ and metal cations of 5 mol% and 1 mol%, respectively. The results indicate that the presence of a single crystalline phase is evident. All patterns correspond to cubic Y2O3, with Ia-3 space group (PDF#05-0574) and the dopants do not induce any significant change in the host structure. The diffraction peak intensities of co-doped samples increase and turn sharper gradually from Ca2+ to Li+ co-doped samples. The co-doped metal cations play a role in being the fluxing agent and are advantageous to the Y2O3:Eu3+ lattice. The diffraction peak intensity of the sample co-doped with Li+ is strongest.
According to XRD patterns of samples doped with different metal cations, the lattice parameters of samples can be calculated. Only one lattice constant needs to be calculated due to the fact that the Y2O3 is a cubic crystal and the lattice constants a, b, and c are identical. The lattice constants of Y2O3 and samples doped with Li+, Na+, K+, Mg2+, and Ca2+ ions in the plane (222) are shown in Table 1. The results show that the doping metal cations make a tiny distortion of the Y2O3 crystal field and do not change the cubic phase at all.
Table 1.
Table 1.
 Table 1. Lattice constants and grain sizes of samples doped with different cations. .
|
None |
Li+ |
Na+ |
K+ |
Mg2+ |
Ca2+ |
|---|
| a/Å |
10.59499 |
10.59582 |
10.60876 |
10.6387 |
10.59588 |
10.60198 |
| Table 1. Lattice constants and grain sizes of samples doped with different cations. . |
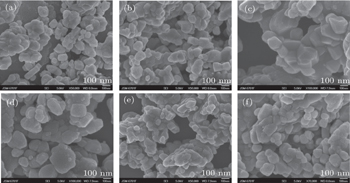
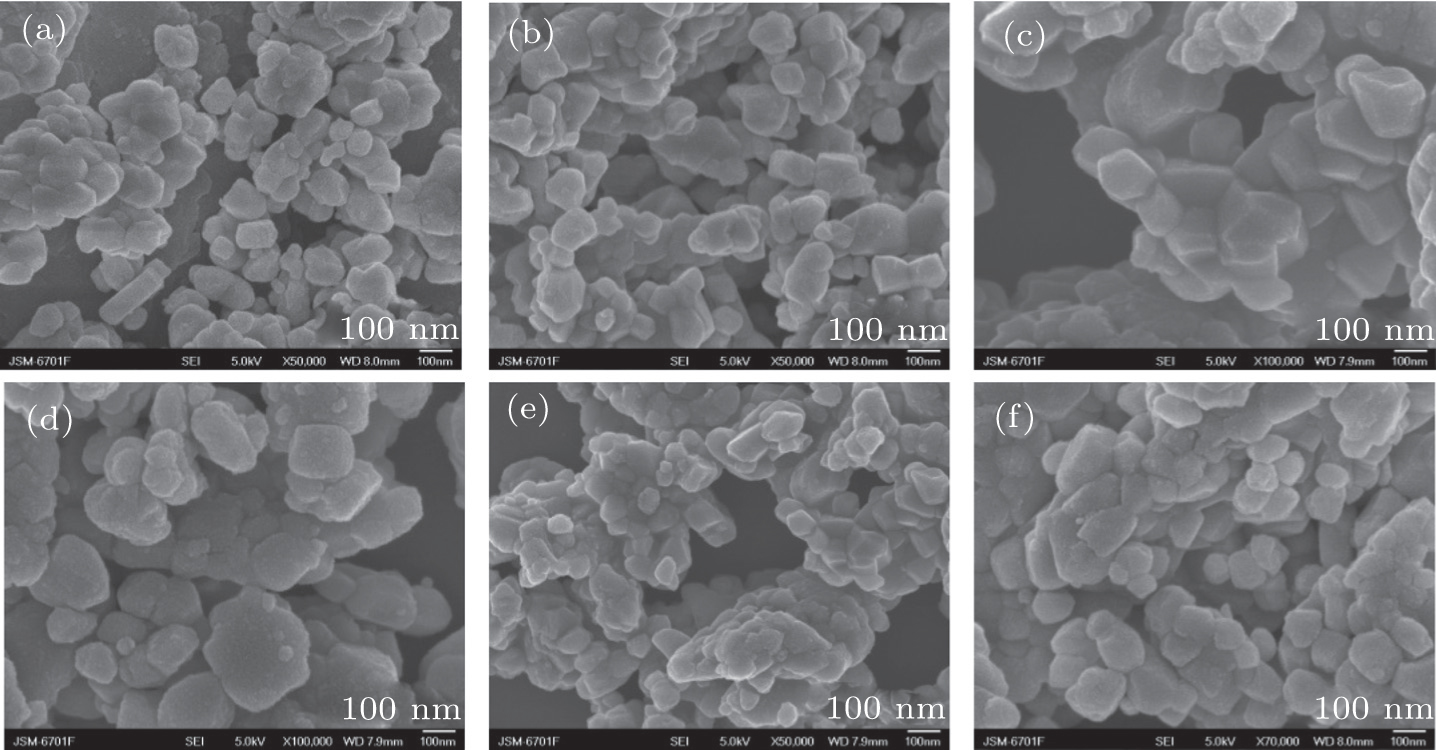
Figure 2 shows the SEM photographs of Y2O3:Eu3+ co-doped with different cations powders. For the undoped sample, the crystallization does not reach completion at the calcined temperature. As the co-doped metal cations play a role in being the fluxing agent and are advantageous to the Y2O3:Eu3+ lattice, the grain sizes of co-doped samples are bigger than undoped phosphors. The analysis results are in good accordance with the XRD patterns.
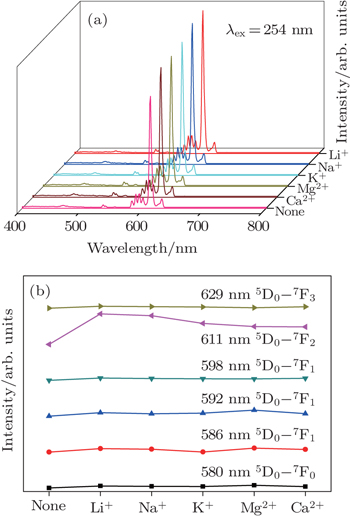
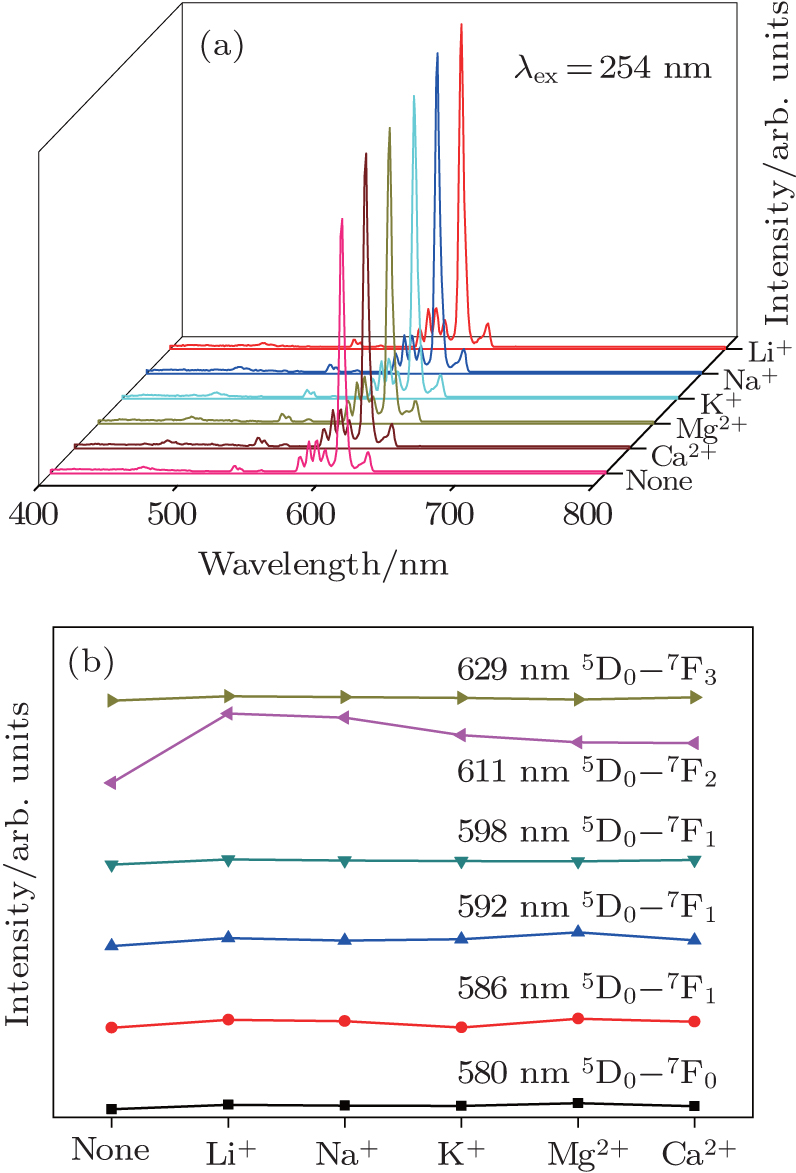
3.2. Spectroscopic propertiesFigure 3 shows the emission spectra of Y2O3:Eu3+ phosphors co-doped with 1% mol and the intensities at different emission peaks of samples doped with different cations under the excitation of 254-nm ultraviolet light. As shown in the figure, the emission peaks of all samples are located at 611 nm. The doping metal cations increase the emission intensities of samples but do not change their emission peak positions. The emission intensity of the Li+ doping sample increases most and the Ca2+ doping sample increases least. The valence state of Yttrium ion is +3 and that of the doping metal cations is +1 or +2. The inconsistent valence states make the charge center changed, affect the crystal field environment of Y2O3, make a tiny distortion of crystal field and increase the transition probability of electrons. So the luminous intensities of all doped samples increase.
The 580-nm emission peak of Eu3+ is from the 5D0 → 7F0 transition, the 586-nm, 592-nm, and 598-nm peaks are from the 5D0 → 7F1 transition, and the 629 peak is from the 5D0 → 7F3 transition. The strongest emission peak at 611 nm is from the 5D0 → 7F2 transition. The 254-nm excited light of Y2O3:Eu3+ phosphor is located in the charge transfer band. The emitting intensities of samples are sensitive to the change of electric charge. As shown in the figure, the intensities of co-doped samples at the peak of 611 nm increase significantly and the differences in emission intensity variation among other peaks are small. The 5D0 → 7F2 transition is called the hypersensitive transition which is sensitive to the change of the surrounding. The doping ions, the doping metal cations, make a tiny distortion of the Y2O3 crystal field so that the intensity of 611-nm increases obviously.
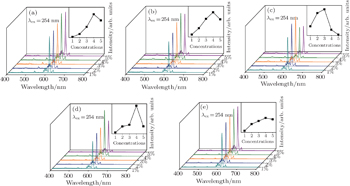
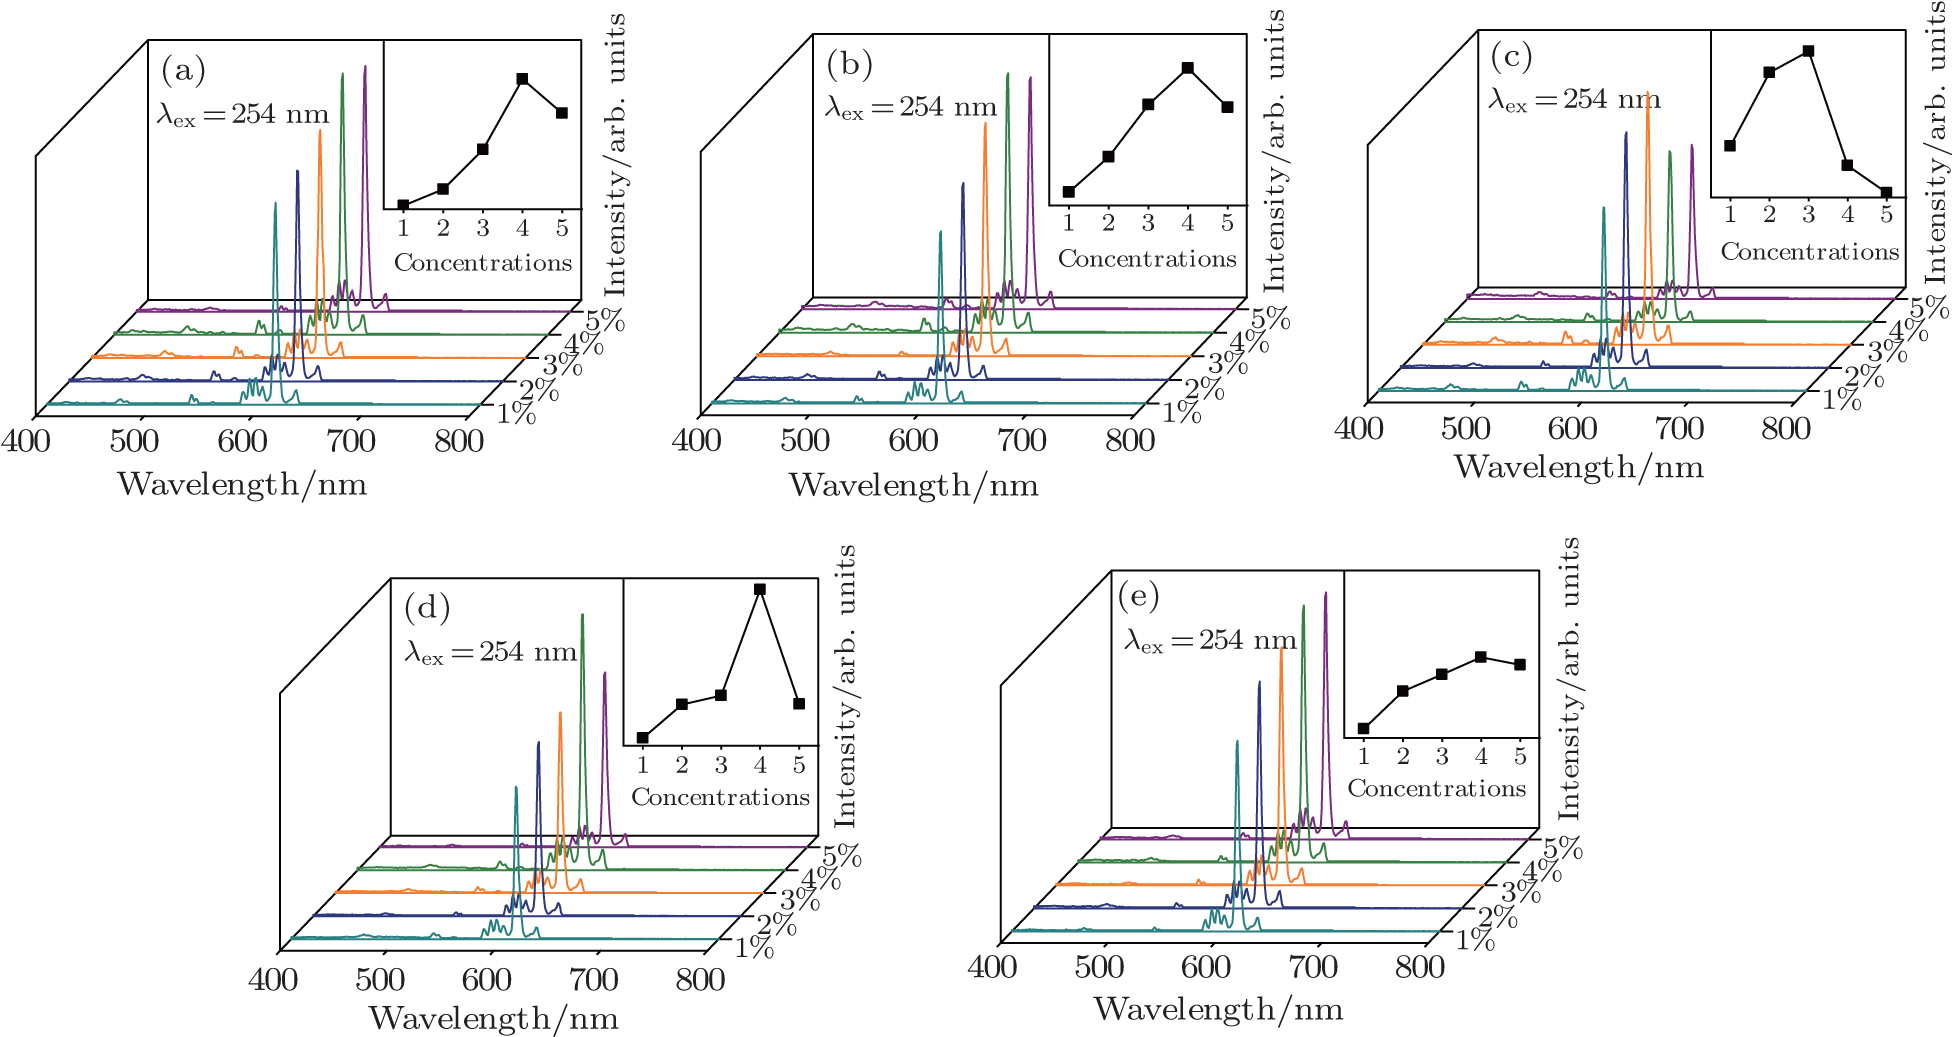
Figure 4 shows the emission spectra of samples doped with different cation concentrations under the excitation of 254-nm ultraviolet light. With the increase of co-doped metal cation concentration, the emission intensities first increase and then decrease. The luminescent intensities of K+ co-doped sample with the content of 3% mol and the other co-doped samples with the content of 4% mol are strongest. It is because the difference in ion radius between Y3+ and the co-doped metal cation. The ion radii of Y3+, Li+, Na+, K+, Mg2+, and Ca2+ ions are 0.9 nm, 0.76 nm, 1.02 nm, 1.38 nm, 0.72 nm, and 1 nm, respectively. For the Li+ and Mg2+ co-doped samples, the metal cations can enter into the Y2O3 lattice easily due to their small ion radii. Because the ion radii of Na+ and Ca2+ are close to that of Y3+, the metal cations can enter into the Y2O3 lattice relatively easily. So the doping concentrations of samples doped with Li+, Na+, Mg2+, and Ca2+ can achieve up to 4% mol. It is difficult for the K+ to enter into the lattice due to the large radius, and the largest concentration can achieve 3% mol only.
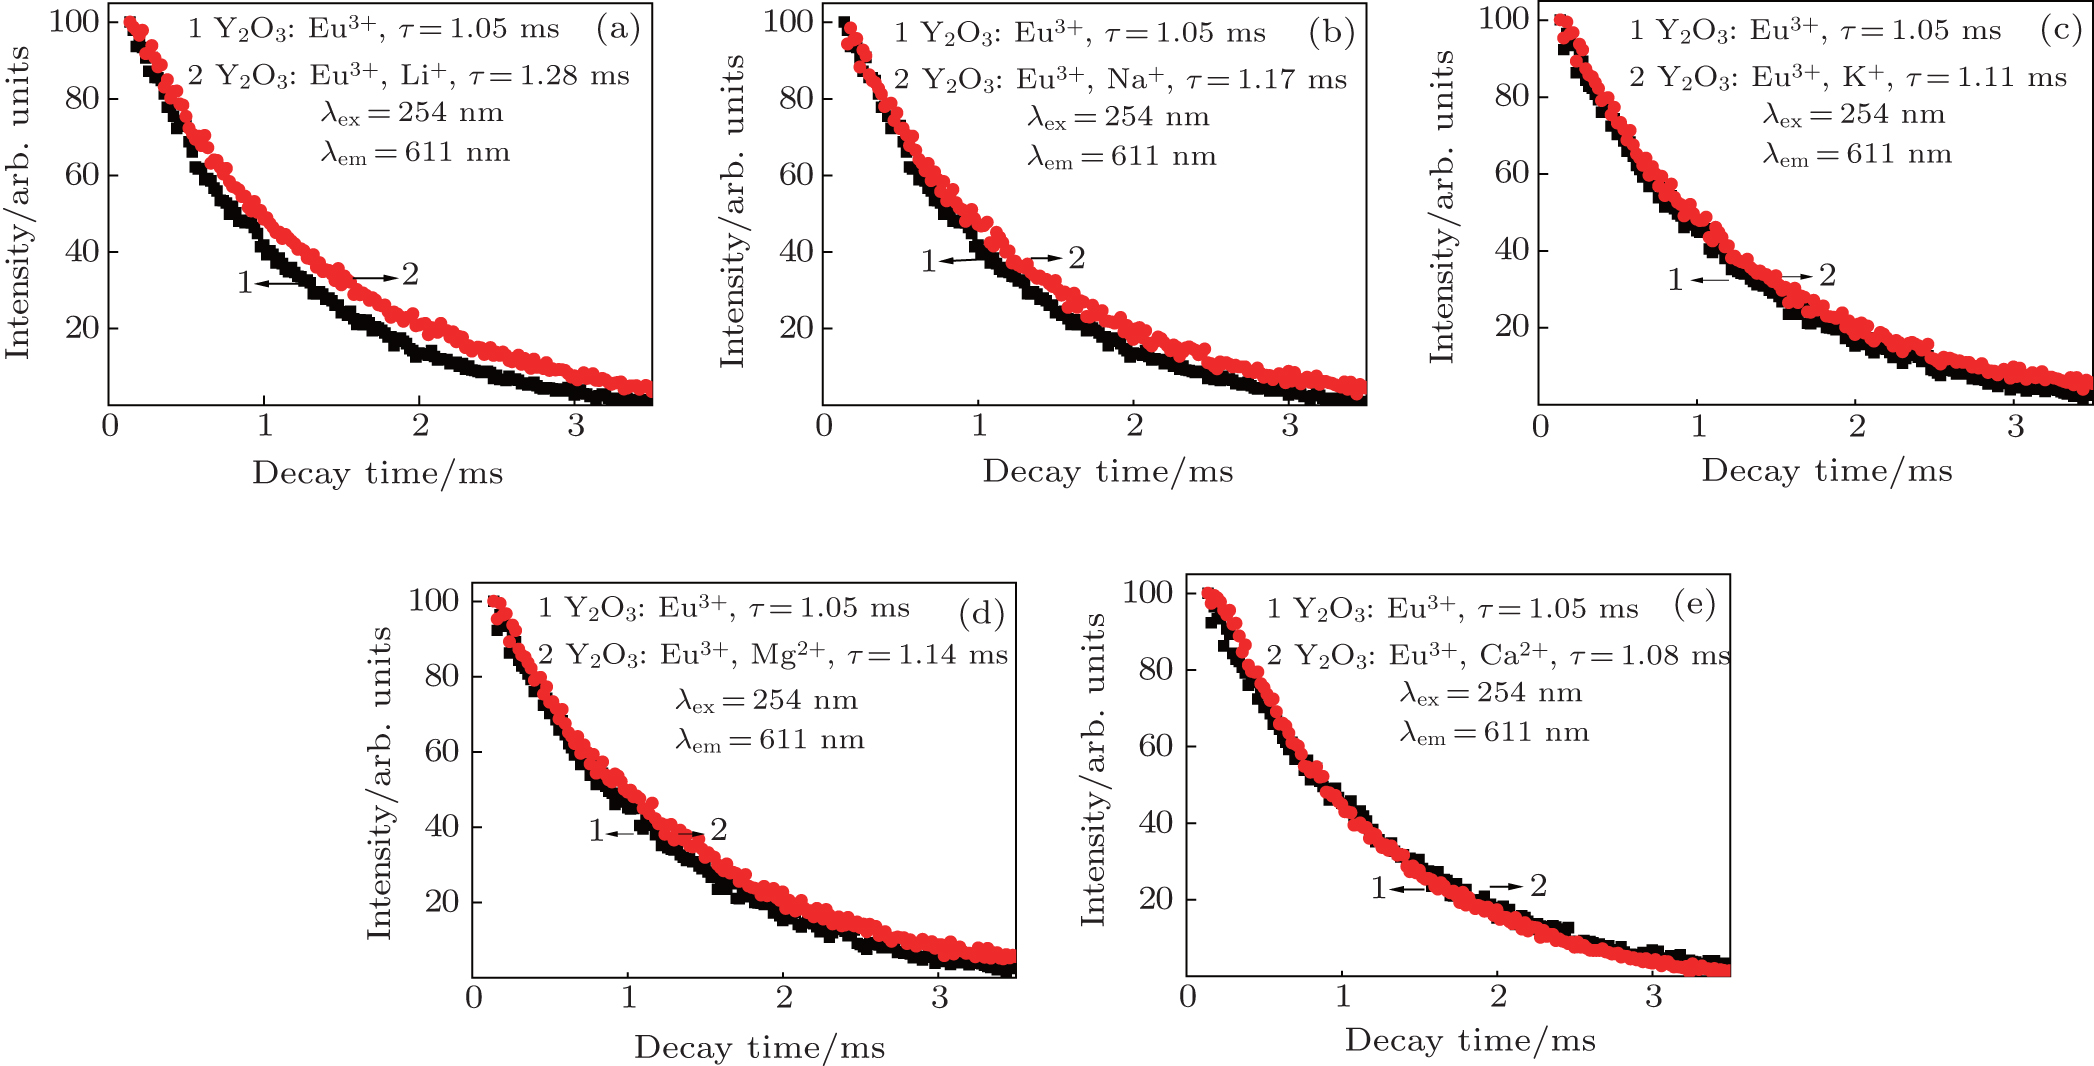
3.3. Decay curvesThe decay curves for the luminescence of Eu3+ in samples doped with different cations are shown in Fig. 5. As shown in the figure, the decay curves of Y2O3:Eu3+ phosphors are numbered as 1 and the metal cations co-doped samples with the content of 1% mol are numbered as 2. The fluorescence lifetime of Eu3+ (5D0 → 7F2) can be fitted and calculated by using single index equation I = I0exp(−t/τ). The fluorescence lifetime of a sample without dopant is 1.05 ms and those of the samples co-doped with Li+, Na+, K+, Mg2+, and Ca2+ are 1.28 ms, 1.17 ms, 1.11 ms, 1.14 ms, and 1.08 ms, respectively. The co-doped metal cations increase the transition probability of electrons and the average time of staying in the excited state. Compared with the scenario in Fig. 3, the decay times of samples increase with the luminescent intensity increasing.
4. ConclusionsIn this paper, Y2O3:Eu3+ phosphors co-doped with different metal cations are prepared by the gel-combustion method with Y2O3, Eu2O3, and R(NO3)x (R = Li, Na, K, Mg, Ca) as raw materials and glycine as fuel, calcined at 1000 °C for 2 h. The doping metal cations make a tiny distortion of the Y2O3 crystal field and do not change the cubic phase at all. The co-doped metal cations play a role in being the fluxing agent and are advantageous to the Y2O3:Eu3+ lattice. The diffraction peak intensity of a sample co-doped with Li+ is strongest. All the samples can emit red light peaked at 611 nm under the excitation of 254-nm ultraviolet light. The co-doped metal cations increase the transition probability of electrons from 5D0 to 7F2 energy level more than to other levels. The intensities of doped samples at the peak of 611 nm increase significantly and the differences in emission intensity variation among other peaks are small. The luminescent intensities of K+ co-doped sample with the content of 3% mol and the other co-doped samples with the content of 4% mol are strongest. The fluorescence lifetime of Eu3+ (5D0 → 7F2) increases by doping metal cations. With the luminescent intensities increasing, the decay times of samples also increase.

 , Zhang Xi-Yan‡,