Magnetic transition behavior of perovskite manganites Nd0.5Sr0.3Ca0.2MnO3 polycrystalline
Xing Ru1, 2, Wan Su-Lei1, Wang Wen-Qing1, Zheng Lin1, Jin Xiang1, Zhou Min2, Lu Yi1, 2, Zhao Jian-Jun1, 2, †,
Department of Physics, Baotou Normal University, Baotou 014030, China
Inner Mongolia Key Laboratory of Magnetism and Magnetic Materials, Baotou 014030, China


† Corresponding author. E-mail: nmzhaojianjun@126.com

Project supported by the National Natural Science Foundation of China (Grant Nos. 11164019, 51562032, and 61565013), the Inner Mongolia Natural Science Foundation, China (Grant Nos. 2015MS0109, NJZZ11166, and NJZY12202), and the Science and Technology in Baotou Production-Study-Research Cooperation Projects, China (Grant No. 2014X1014-01).

Abstract
Abstract

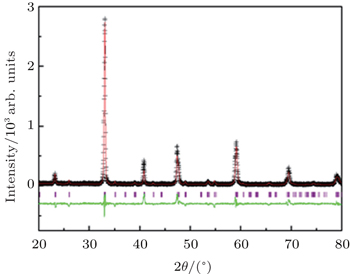
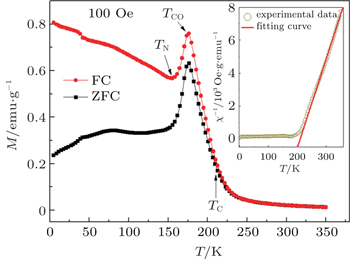
A polycrystalline sample Nd0.5Sr0.3Ca0.2MnO3 is prepared by the conventional solid state reaction method. The structure and magnetic properties are investigated with x-ray diffraction (XRD) patterns, a superconducting quantum interference device (SQUID), and electron spin resonance (ESR). The sample is in single phase with the space group Pbnm symmetry. With the decrease of temperature, Nd0.5Sr0.3Ca0.2MnO3 undergoes three magnetic transitions: ferromagnetic transition at TC ≈ 210 K, charge-ordering at TCO ≈ 175 K, and antiferromagnetic transition at TN = 155 K. In addition, the activation energy Ea ≈ 52.78 meV can be extracted by curve fitting.

1. Introduction

Cubic perovskite manganites (R, A)MnO3 (R: rare-earth, such as La, Pr, Nd; A: divalent alkaline-earth, such as Ca, Sr) are a series of Ruddlesden–Popper (RP) compounds. Various physical phenomena are shown in this system due to the coupling of its intrinsic freedom degrees of charge, spin and orbital, such as colossal magnetoresistance (CMR), magnetocaloric effect (MCE), and phase separation (SP), making them an important class of strongly correlated electronic systems.[13]

Magnetic transition behavior has been observed in most perovskite manganites, such as La0.65A0.35MnO3 (A = Ca, Sr, Ba),[4] Pr0.6Sr0.4MnO3,[5] etc. Remarkably, paramagnetic insulator, ferromagnetic metallic, and charge ordered–insulator temperature-dependent phase transitions have been induced in the doped manganites. A colossal negative magnetoresistance has been observed near either the concomitant paramagnetic insulator–ferromagnetic metallic phase transition[6] or the ferromagnetic metallic–charge ordered insulator transition.[7] MCE has been discovered in manganite samples around the second order paramagnetic–ferromagnetic transition.[8,9] Zhao et al. studied a ‘colossal’ oxygen isotope shift of the charge-ordering transition in Nd0.5Sr0.5MnO3.[10] This behavior is based on the situation in which Mn3+ and Mn4+ ionic states are implicitly (temporal or spatial) distinguished. The Mn–O–Mn bond length and angle are modified by the Mn3+/Mn4+ distribution, while the charge transfer from an occupied Mn3+ eg orbital to an adjacent Mn4+ unoccupied eg orbital depends strongly on the MnO6 octahedron tilt and Jahn–Teller distortion.

The Ca2+-rich phase can be considered as an electron-doped semiconductor, with significantly reduced resistivity compared with CaMnO3. At fixed x (constant Mn3+/Mn4+ ratio), the replacement of Sr2+ ions by smaller Ca2+ ions causes an anisotropic internal chemical pressure within the compound and leads to a rich variety of magnetically ordered and electrically conductive phases.[11] Electron spin resonance (ESR) is a powerful technique that is sensitive to the various properties of magnetic correlations at a microscopic level, and convenient to clarify the complex magnetic state in doped manganese perovskites. A number of ESR experiments on some manganites have been carried out.[12,13] In the present work, we report the magnetic transition behaviors of Nd0.5Sr0.3Ca0.2MnO3 compound detected by ESR.

2. Experiments

The polycrystalline sample of Nd0.5Sr0.3Ca0.2MnO3 was prepared by conventional solid-state reaction processes. At first, the stoichiometric parts of SrCO3, Nd2O3, MnCO3, and CaCO3 were well ground and calcined twice at 800 °C and 1000 °C each for 24 h. Then the resulting powder was pressed into pellets and sintered at 1320 °C for 30 h. The phase purities and crystal structures of the samples were examined by powder x-ray diffraction (XRD) with Cu Kα radiation at room temperature. Data were analyzed with program Retieca. Magnetization measurements were performed in a superconducting quantum interference device (SQUID) magnetometer. The ESR experiments were carried out with a JEOL JESFA200 ESR spectrometer at X-band frequency (f ≈ 9.4 GHz) from 100 K to 300 K.

3. Results and discussion

Figure 1 shows the room temperature XRD pattern of Nd0.5Sr0.3Ca0.2MnO3. For comparing, the data of Rietveld refinement are also listed in the figure. The x-ray diffraction peaks show no trace of any secondary phase, indicating good phase quality with an orthorhombic Pbnm structure. XRD also shows that the sample has an orthogonal distorted perovskite structure.

Fig. 1. X-ray diffraction pattern of Nd0.5Sr0.3Ca0.2MnO3 at room temperature.

Figure 2 shows the temperature-dependent magnetizations measured under a magnetic field of 100 Oe (1 Oe = 79.5775 A·m−1) with zero-field-cooled (ZFC) and field-cooled (FC) in a temperature range from 5 K to 350 K. The inset represents the inverse magnetic susceptibility versus temperature (χ−1T). With temperature decreasing, magnetization increases gradually. When the temperature approaches to 210 K, the magnetization rises dramatically, indicating short-range FM clusters[14] which can be confirmed with χ−1T curve fitting by the Curie–Weiss law as seen in the measurements of ESR. When the temperature further decreases, the magnetization shows a peak at 175 K and then drops obviously. The rapid decrease of magnetization should be due to the development of antiferromagnetic (AFM) correlation, and reveals a charge-order transition. In addition, as temperature continues to decrease, there is an inflection point at the TN ∼ 155 K. The sample presents stronger AFM when the temperature is below 155 K. The peak of the MT curve is higher at TCO than that at TN, which was reported in other studies.[1517] In the low temperature region, the magnetization of the FC curve increases as temperature decreases. According to Millange’s point,[17] this can be related to the short-range magnetic order caused by Nd3+ ions magnetic moment. Furthermore, ZFC and FC curves in the MT curve show great differences at low temperature. These are supposed to be caused by the interaction between the antiferromagnetic effect and the ferromagnetic effect, so it shows cluster- spin glass behavior.[18]

Fig. 2. Temperature dependences of magnetization measured at 100 Oe, with the inset showing the curve of inverse susceptibility versus temperature.

Figure 3 shows the magnetic field dependences of the magnetization for the sample. When the field is less than 1 T, the magnetization is greater at 100 K than at 200 K. It is probably due to the short-range magnetic order induced by the Nd3+ magnetic moment at low temperature,[19] similar to the results given by Ma et al.[20] When the field is more than 1 T, the curves are linear approximately, indicating that the sample has less ferromagnetic characteristic, especially at 100 K, which suggests that the sample is antiferromagnetic.

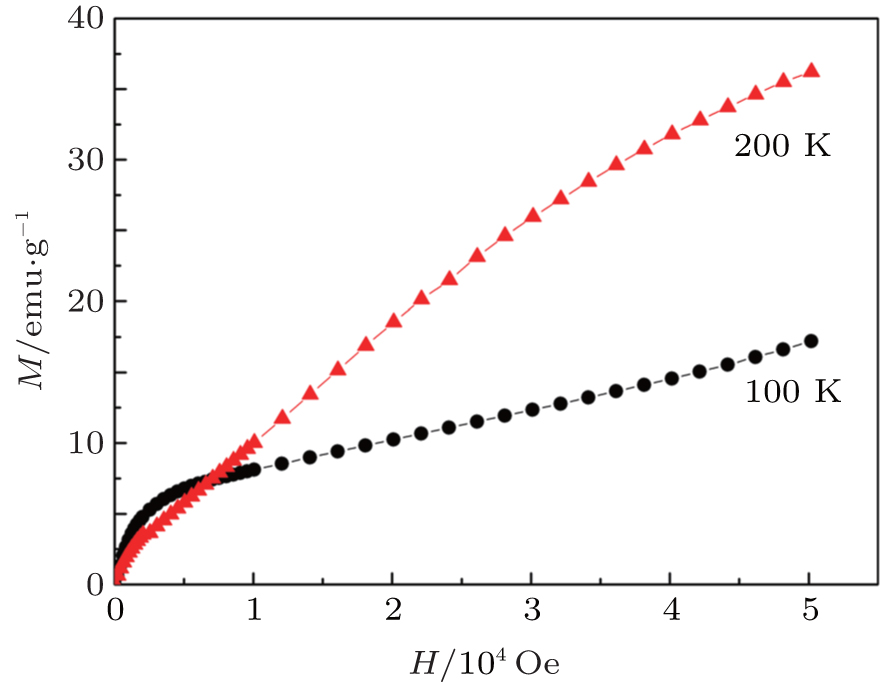
Fig. 3. Magnetic field dependences of the magnetization of the Nd0.5Sr0.3Ca0.2MnO3 sample at different temperatures.

Figure 4 shows the representative ESR spectra measured from 100 K to 300 K. Between 210 K and 300 K, each of the ESR spectra is a single paramagnetic resonance (PMR) line, indicating that the sample is paramagnetic. As the temperature decreases below 200 K, an additional formant appears at the lower side of the main PMR line, the resonance line broadens substantially and the anomalous PM phenomena occur, which should be attributed to a ferromagnetic resonance (FMR) signal. The PM anomalies are due to the FM coupling between the domains, indicating the short-range FM clusters appearing in the sample.[21] This kind of peak gradually shifts towards the lower field as the temperature decreases. Meanwhile the peak intensity decreases with temperature decreasing. When the temperature is lower than 140 K, the resonance signal disappears.

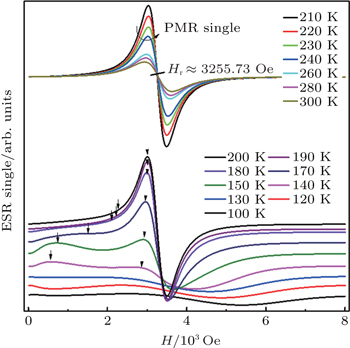
Fig. 4. Temperature dependences of the ESR spectra.

Figure 5 shows the fitting curves of ESR spectra for Nd0.5Sr0.3Ca0.2MnO3 at 210 K, 200 K, and 180 K, respectively. The curve at 210 K can be fitted to a symmetric Lorentzian line, indicating that the system is paramagnetic. At 200 K and 180 K, two Lorentzian lines are needed to fit to ESR curves. The line of the low field corresponds to the FMR curve and the high field line is the PMR curve. The coexistence of the FMR and PMR signal also indicates a phase separation in Nd0.5Sr0.3Ca0.2MnO3. The latter one shows that the system is in the ferromagnetic–paramagnetic coexistence at these two temperatures.

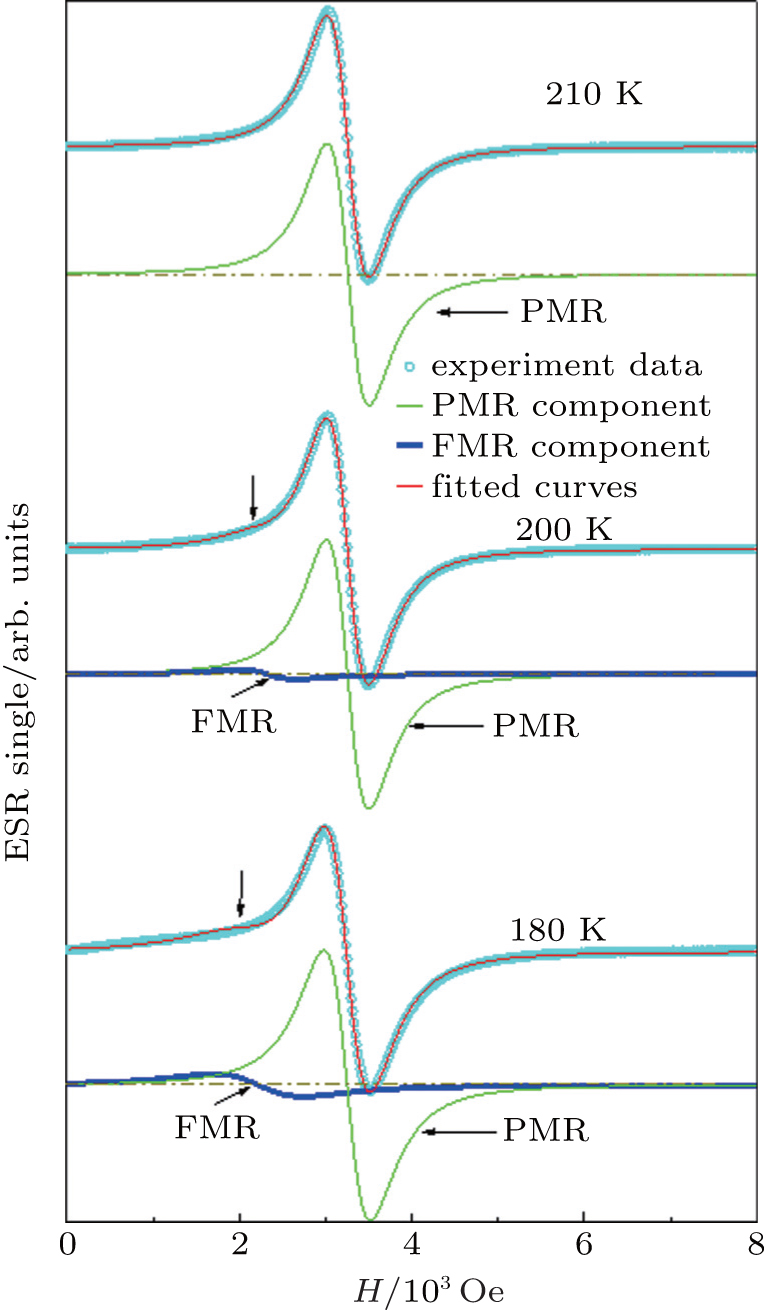
Fig. 5. Fitting curves of ESR at three different temperatures (210 K, 200 K, and 180 K).

In order to obtain more information from the ESR spectra, we analyze the ESR parameters after fitting the spectra. Figures 6(a) and 6(b) show the temperature dependences of the g-value and the linewidth (ΔH), respectively. In the high-temperature region (> 260 K), the g-value obtained from the resonance field Hr shows a weak dependence on temperature. As temperature further decreases, the g-value rises gradually, which is mainly related to the formation of ferromagnetic clusters from 210 K to 180 K. We note that the g-value is less than that of the free electron value (eg = 2.0023) in a range from 210 K to 300 K, this lower value may be due to the

Temperature dependences of the ESR spectrum parameter for the sample, showing temperature-dependent g-value (a), linewidth ΔH (b), and intensity I (c). Insert shows ln(I)–1000/T. The unit 1 Gs = 10−4 T.

magnetic inhomogeneity.[22] Figure 6(b) shows the temperature-dependent linewidth ΔH of the spectrum. When the temperature decreases, the linewidth shows a decrease at first and then rises, relating to the spin and the crystal field interactions of the internal system.[23] Figure 6(c) shows the temperature dependence of ESR intensity which is obtained through double integration of the spectrum. The intensity increases gradually with temperature decreasing. This behavior is qualitatively similar to the temperature dependence of magnetization and indicates that the spin of the system has a contribution to the ESR signal. Generally, the ESR intensity can be described by the expression I = I0 exp(−Ea/kbT), where I0 is a fitting parameter, kb is the Boltzmann constant, and Ea represents the activation energy. We obtain Ea = 52.78 meV for the sample from the plot ln(I) versus 1000/T.

4. Conclusions

We mainly study the structure and magnetic properties of polycrystalline manganite Nd0.5Sr0.3Ca0.2MnO3. The results show that the system is in the paramagnetic state above the Curie temperature (Tc ≈ 210 K). When TCO(≈ 175 K) < T < TC, the system is in ferromagnetic-paramagnetic coexistence and the ferromagnetism, which is caused by the short range ferromagnetic cluster. When 140 K < T < TCO, the system is in antiferromagnetic–ferromagnetic-paramagnetic coexistence. Below 140 K, the system mainly exhibits an antiferromagnetic characteristic. In addition, the activation energy Ea is approximately 52.78 meV at high temperature by fitting, which destroys spin clusters.

Reference
1Jiang W JXue Z ZPrivezentsev RMukovskii YWilliams G 2010 J. Phys.: Conf. Ser. 200 012072
2Zhou S MLi YGuo Y QZhao J YCai XShi L 2013 Appl. Phys. 114 163903
3Lu H XWang JShen B GSun J R 2015 Chin. Phys. 24 027504
4Asma KSaadat A SAffia A 2013 Chin. Phys. Lett. 30 077501
5Rößler SHarikrishnan SNaveen Kumar C MBhat H LElizabeth SujaRößler U KSteglich FWirth S 2009 Journal of Supercon-ductivity and Novel Magnetism 22 205
6Coey J M DViret Mvon Molnar S 1999 Adv. Phys. 48 167
7Uehara MMori SChen C HCheong S W 1999 Nature 399 560
8Szewczyk AGutowska MPiotrowski KDabrowski B 2003 Appl. Phys. 94 1873
9Zhu HSong HZhang Y H 2002 Appl. Phys. Lett. 81 3416
10Zhao G MGhosh KGreene R L 1998 J. Phys: Condens. Matter 10 L737
11Shen C HLiu R SHu S FLin J GHuang C YShe H S 1999 Appl. Phys. 86 2178
12Ning WWang FZhang X QChen Z HSun Y 2009 J. Magn. Magn. Mater. 321 88
13Zhao J JXing RLu YHao S BZhao M YJin XZheng LNing WSun YChen Z H 2008 Chin. Phys. 17 2721
14Li J QYuan S L 2005 Solid State Commun. 134 295
15Tokura YTomioka Y 1999 J. Magn. Magn. Mater. 200 1
16Terai TSasaki TKakeshita TFukuda TSaburi TKitagawa HKindo KHonda M2001Phys. Rev. B613488
17Fang YYan S MQiao WWang WWang D HDu Y W 2014 Chin. Phys. 23 117501
18Chattopadhyay SGiri SMajumdar S 2012 Appl. Phys. 112 083915
19Janhavi P JRajeev GSood A KSood A KBhat S V2002Phys. Rev. B65024410
20Ma XLu YKou Z QDi N LCheng Z HLi Q A 2005 Chin. Phys. 14 192
21Yuan S LLi J QJiang YYang Y PZeng X YLi GTu FZhang G QTang C QJin S Z2000Phys. Rev. B625313
22Ramesh Babu MHan X FNing WCheng Z HSun YJayavel R 2009 Mater. Lett. 63 1528
23Moreno N OPagliuso P GRettori CGardner J SSarrao J LThompson J DHuber D LMitchell J FMartinez J JOseroff S B 2001 Phys. Rev. 63 174413