1. IntroductionThe discovery of unconventional superconductivity in iron pnictides[1] has aroused a tremendous amount of research into this class of materials in an effort to understand the mechanism of high-Tc superconductivity, as well as to explore materials with higher Tc. The parent compounds of these iron-based superconductors (FeSCs) are poor Pauli-paramagnetic metals in their high-temperature phase, and undergo structural and antiferromagnetic (AFM) phase transitions upon cooling down to low temperature.[2–4] Superconductivity emerges with the suppression of the AFM order via chemical substitution[5–7] or the application of pressure.[8–11] Since optimal superconductivity is accompanied by the disappearance of the AFM phase, AFM spin fluctuations have been proposed to mediate the electronic pairing in FeSCs.[12] On the other hand, previous spectroscopic studies have also revealed strong competition between the AFM order and superconductivity in the Ba122 system.[13,14] Therefore, the relation between magnetism and superconductivity is still a matter of debate in FeSCs.
In this article, we report our results of magnetotransport measurements on BaFe2−xNixAs2 single crystals with different Ni concentration. An abrupt drop of the resistivity at ∼22 K in underdoped x = 0.03 has been observed in the temperature-dependent resistivity as evidence for the onset of filamentary superconductivity (FLSC). An external magnetic field suppresses FLSC in a manner similar to the suppression of the bulk Tc in an optimally-doped (x = 0.10) sample, suggesting a possible connection between FLSC and bulk SC. In addition, FLSC is robust and exhibits little doping dependence in the underdoped regime, but vanishes abruptly in the overdoped region where long-range AFM order is absent. These results indicate that the emergence of FLSC is intimately related to the magnetic order in FeSCs.
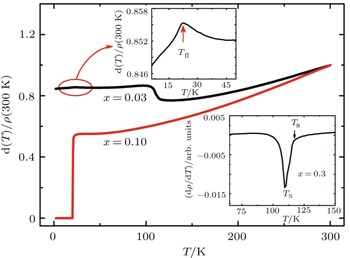
3. Results and discussionFigure 1 shows the temperature dependence of normalized resistivity ρ(T)/ρ(300 K) for x = 0.03 underdoped and x = 0.10 optimally doped BaFe2−xNixAs2 samples. For x = 0.10, the curve is characterized by a steep superconducting transition at Tc = 20.3 K. The x = 0.03 sample features a metallic behavior followed by an upturn resistivity at the spin-density-wave (SDW) transition temperature TN = 109 K, corresponding to a sharp dip in the derivative of the resistivity dρ/dT as a function of temperature. Meanwhile, as shown in the upper inset in Fig. 1, an abrupt drop of resistivity can be clearly identified at low temperature Tfl ≈ 22 K for the x = 0.03 sample. Our recent studies on CaFe2As2[16] and BaFe2−xCoxAs2[17] has demonstrated that this step in the resistivity is due to the presence of weakly pinned superconducting filaments. Furthermore, we have also provided evidence that filamentary superconductivity nucleated at antiphase domain walls in antiferromagnetic CaFe2As2. Therefore, we define the temperature of this step in resistivity as the onset of FLSC (Tfl), similar to the high-Tc cuprates[18,19] and heavy fermions superconductors.[20,21]
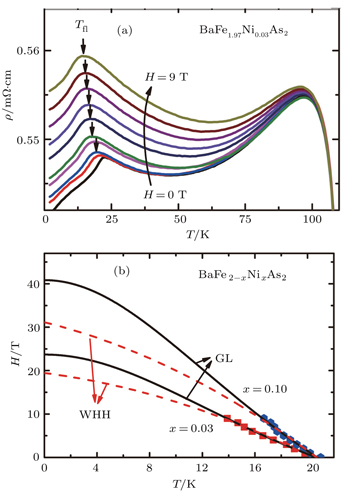
The top panel of Fig. 2 shows ρ(T) curves from 2 K to 110 K at different magnetic fields for underdoped BaFe2−xNixAs2 (x = 0.03). While no magnetoresistance is observed above the magnetic transition temperature TN, a peak feature related to FLSC is observed at temperature Tfl in all curves. It is noticed that Tfl decreases with increasing magnetic fields. The H–T phase diagram obtained from the field dependence of Tfl for the x = 0.03 sample and the field dependence of bulk Tc for the x = 0.10 sample are shown in the bottom panel of Fig. 2. A striking similarity of the suppression by external magnetic field between Tfl and Tc is found through the comparison of these H–T phase diagrams, which suggests a close connection between FLSC and bulk SC and rules out the possible contribution of an impurity phase to this phenomena.
In addition, the upper critical fields in these two samples are also fitted by the Ginzburg–Landau (GL) model and the Werthamer–Helfand–Hohenberg (WHH) model. As shown in the bottom panel of Fig. 2, the solid curve is a fit with GL expression,

which gives
Hc2(0) = 23.7 T and
Tc = 20.6 K for the underdoped
x = 0.03 sample, and
Hc2(0) = 40.8 T and
Tc = 20.7 K for the optimally-doped
x = 0.10 sample. The dashed curve is a fit with the WHH relation,
Hc2(0) = −0.7
Tc (d
Hc2/d
Tc), which gives a slope of −1.34 T/K and
Hc2(0) = 19.4 T with
Tc = 20.6 K for the
x = 0.03 sample, and a slope of −2.14 T/K and
Hc2(0) = 31.1 T with
Tc = 20.7 K for the
x = 0.10 sample. The value of
Hc2(0) obtained from WHH is lower than GL, which is similar to that reported in other 122-type iron pnictide superconductors.
[22] Meanwhile, it is noted that recently Wang
et al. reported that the

of
x = 0.10 sample with high field data can be described by a two-band model and it gave a higher
Hc2 = 47.5 T.
[23]While we observed an obvious drop of resistivity in ρ(T) curves for the x = 0.03 sample, some studies showed that the step in the low-temperature resistivity is not always observed in 122-type parent compound in iron pnictide superconductors. For example, Xiao et al. reported that this step was observed only for small and thin single crystals in undoped BaFe2As2.[17] Tanatar et al. studied different samples of parent compounds CaFe2As2 and BaFe2As2, and found that two samples showed the partial superconducting transition in three undoped CaFe2As2, and even only two samples showed the partial superconducting transition in five different BaFe2As2 samples.[24] For this reason, we performed magnetoresistivity measurements, which is believed to be more sensitive to the small decrease in resistivity due to filamentary superconductivity.
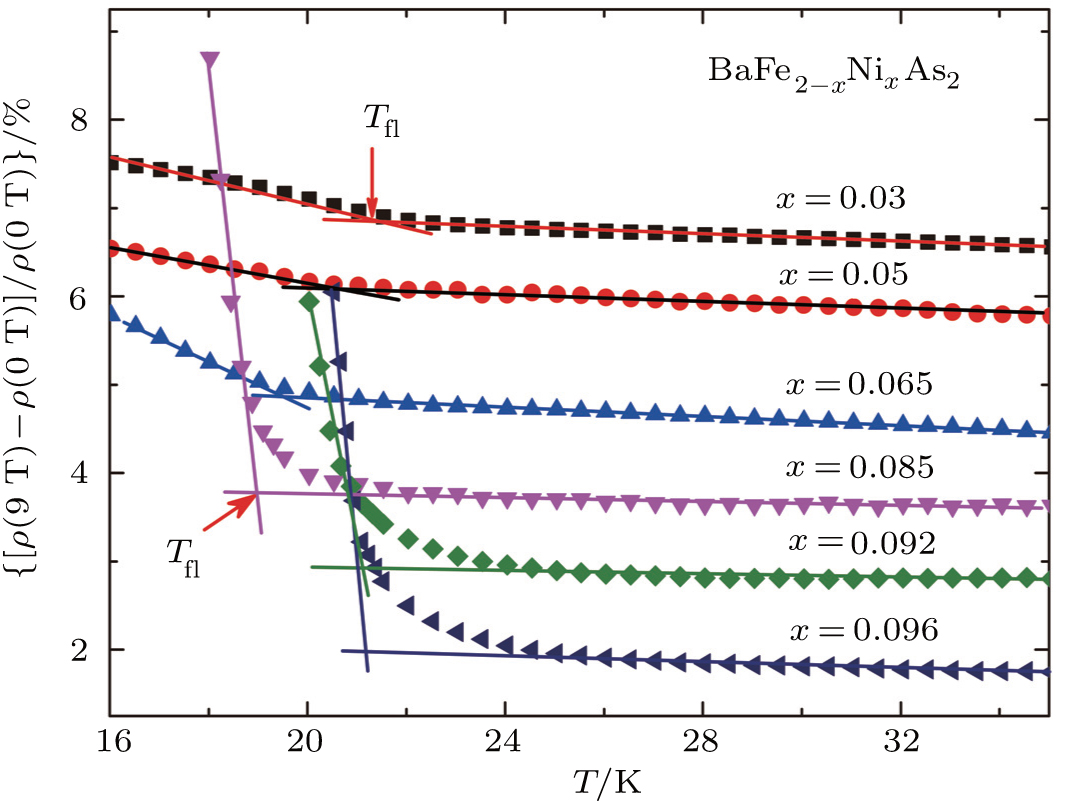
Figure 3 shows the temperature dependence of magnetoresistivity Δρ/ρ(0) = [ρ(9 T) − ρ(0 T)]/ρ(0 T) for different Ni concentrations. As the temperature decreases, the magnetoresistivity Δρ/ρ(0) for the underdoped x = 0.03 sample increases very gently at first, but then an abrupt increase occurs close to 22 K, which is exactly the FLSC onset temperature Tfl in the zero-field ρ(T) curve. Therefore, we attribute this abrupt change in magnetoresistivity to the occurrence of filamentary superconductivity and identify the temperature as Tfl. We also performed magnetoresistivity measurements on several other pieces of crystal of underdoped x = 0.03 samples and confirmed that the abrupt change in magnetoresistivity always exists at a temperature Tfl even in some samples where the step in ρ(T) curve has not been detected. Furthermore, the abrupt change in magnetoresistivity is observed in other Ni-doping BaFe2−xNixAs2 single crystals in Fig. 3.
In Fig. 4, we make a comprehensive plot of the phase diagram of the doping dependence of structural transition temperature Ts, magnetic transition temperature TN, superconducting transition temperature Tc, and FLSC transition temperature Tfl. The defination of Ts, TN, and Tc is shown in Fig. 1. From the phase diagram we find that the parent compound BaFe2As2 exhibits simultaneous structural and magnetic phase transitions at ∼140 K, from high-temperature tetragonal paramagnetic to low-temperature orthorhombic antiferromagnetic phase. With increasing Ni doping, the structural and magnetic transitions separate from each other with TN slightly lower than Ts. The antiferromagnetic order is suppressed by replacing Fe by Ni in BaFe2As2. Superconductivity emerges at x ≈ 0.05 and reaches a maximum at x = 0.10 where long-range AFM order vanishes. Most importantly, we find that Tfl is less doping dependent compared with the bulk superconductivity Tc and it exists in underdoped samples and persists up to the edge of the optimally-doped x = 0.10 sample, where the AFM order vanishes. This suggests a close relationship between FLSC and AFM order.
However, some recent experimental results revealed that SC and AFM order parameters are spatially modulated on a microscopic scale in iron pnictides.[24–26] For example, many studies showed the evidence for the existence of the structural domain like twin boundary and antiphase domain wall in the iron pictides.[24,26] Meanwhile, a recent SQUID microscopy study in underdoped Ba(Fe1−xCox)2As2 showed an enhanced superfluid density on twin boundaries[25] and 75As nuclear magnetic resonance (NMR) measurements in antiferromagnetic CaFe2As2 suggests the presence of FLSC nucleated at the AFM domain walls.[16] All these results indicate that AFM order is vital to the emergence of SC in iron pnictides.
In combination with our previous studies in CaFe2As2 and Ba(Fe1−xCox)2As2,[16,17] we find that FLSC exists in electron-doped 122-type iron-based superconductors and it has a close connection with AFM order. Besides, Chu et al. also revealed an obvious FLSC with a high Tc = 49 K in single crystalline CaFe2As2 via electron-doping by partial replacement of Ca by rare-earth.[27,28] Thus our results suggest that the FLSC may be a common feature in the AFM phase of iron pnictides due to strong coupling between AFM and superconductivity, further exploration is needed to verify it.


 , Qiu Xiang-Gang2, ‡,