Excitonic transitions in Be-doped GaAs/AlAs multiple quantum well
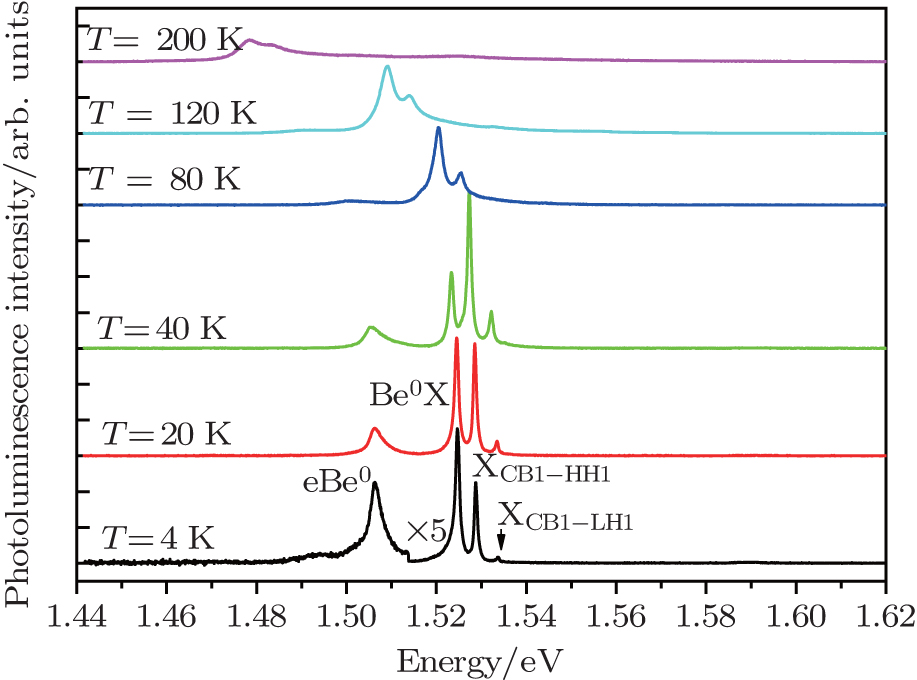
Series of PL spectra for sample 5 at 4, 20, 40, 80, 120, and 200 K, showing the XCB1−LH1, XCB1−HH1, Be0X, and eBe0 peaks.

Excitonic transitions in Be-doped GaAs/AlAs multiple quantum well |
Series of PL spectra for sample 5 at 4, 20, 40, 80, 120, and 200 K, showing the XCB1−LH1, XCB1−HH1, Be0X, and eBe0 peaks. |
 |