


Structure phase transformation and equation of state of cerium metal under pressures up to 51 GPa
[Ma Ce1, Dou Zuo-Yong1, Zhu Hong-Yang2, Fu Guang-Yan1, Tan Xiao1, Bai Bin1, Zhang Peng-Cheng1, †,  , Cui Qi-Liang2, ‡, ]
, Cui Qi-Liang2, ‡, ]
|
|

 , Cui Qi-Liang2, ‡,
† Corresponding author. E-mail:
‡ Corresponding author. E-mail:
Project supported by the National Natural Science Foundation of China (Grant No. NSAF.U1330115) and the National Major Scientific Instrument and Equipment Development Project of China (Grant No. 2012YQ130234).
This study presents high pressure phase transitions and equation of states of cerium under pressures up to 51 GPa at room temperature. The angle-dispersive x-ray diffraction experiments are carried out using a high energy synchrotron x-ray source. The bulk moduli of high pressure phases of cerium are calculated using the Birch–Murnaghan equation. We discuss and correct several previous controversial conclusions, which are caused by the measurement accuracy or personal explanation. The c/a axial ratio of ε-Ce has a maximum value at about 29 GPa, i.e., c/a ≈ 1.690.
Cerium (Ce) is a typical non-radioactive f-electron transition metal, being a research focus of high-pressure physics and strongly correlated electron fields due to its unique electronic structure and condensed matter phase polymorphism.[1] In addition, Ce is considered as an ideal module for studying the high pressure properties of heavy actinides because of their similar high pressure properties.[2] There are several controversies about Ce under high pressure, such as the phase transition route, phase transition mechanism, phase diagram, and phase boundary according to the experimental and theoretical reports (a recent review was given by NIkolaev and Tsvyashchenko[3]). The most distinguished characteristic of Ce is the isostructural phase transition of γ-Ce (fcc) to α-Ce (fcc) accompanied by about 14%–20% volume collapse at 0.6 GPa–1 GPa at room temperature,[4] which is considered to be related to the f electron properties,[5–9] as indicated in both the Hubbard-Mott transition (HM)[9] and the Kondo volume collapse (KVC)[7,8] models. In the HM scenario,[9] the 4f electron is localized and non-binding in the γ phase, but itinerant and band-like in the α phase. Thus the energy for the phase transition is provided by the kinetic energy of the itinerant f electron. Whereas in the KVC picture,[7,8] the 4f electron is assumed to be localized in both of the α and γ phases, and the phase transition is driven by the Kondo spin fluctuation energy and entropy. In addition, this phase diagram of Ce under 5 GPa is ambiguous, for the transformation product may be α′-Ce (α-U structure) or α″-Ce (C-face-centered monoclinic). These transition productions are recognized to be related to many factors, such as the initial size of grain,[10–12] the trajectory of pressure-temperature,[13] the initial heat treat state, even the sample primal preparation condition.[10,11] However, α′-Ce and α″-Ce both transform into the body-centered tetragonal phase (ε-Ce, bct) above 12 GPa.[10]
Up to now, the phase transformations have been controversial, meanwhile there is some argument about the equation of state of Ce. Both of the high pressure equation of state (Olsen[14]) and the ultrapressure equation of state (Yogesh[15]) were measured by the energy-dispersive x-ray diffraction (EDXD). As is well known, subject to the energy detect accuracy, the data measured by EDXD are less reliable than by the angle-dispersive x-ray diffraction (ADXD).[16] Therefore, we present high-accuracy experimental data under high pressure for the phase structure transition and equation of state by using synchrotron ADXD. Several previous controversial conclusions caused by the test accuracy or personal explanation are unambiguously indicated and corrected in this study.
A Ce slice was cut from an ingot of 99.9% purity purchased from Alfa Aesar. During processing and transport, the Ce was immersed in silicon oil in order to avoid oxidizing. There is no other processing such as heat treatment or grinding before our experiments. The Mao–Bell type diamond anvil cells (DAC) with 300 μm anvil in diameter was used to provide the hydrostatic pressure. A T301 steel sheet served as the gasket with a chamber of 75 μm in diameter and 60 μm in thickness for packing the sample. The pressures were measured by the ruby fluorescence technique.[17] The high-purity silicon oil was selected as the pressure-transmitting medium. The synchrotron ADXD measurements were carried out at the Beam-line BL15U1 in the Shanghai Synchrotron Radiation Facility (SSRF) with the x-ray wavelength 0.6199 Å. An x-ray beam size of 1.8 μm×1.6 μm was employed in all the x-ray exposures. The Bragg diffraction rings were collected using a MAR165 CCD camera with a 79-μm pixel, and the XRD patterns were integrated from the images with FIT2D software.
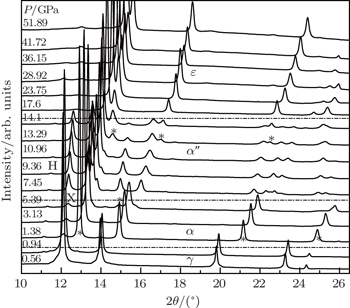
The representative diffraction spectra of Ce are shown in Fig.
 | Fig. 1. Representative x-ray diffraction patterns of Ce. The γ-Ce, α-Ce, α″-Ce, and ε-Ce are shown in this figure respectively. The asterisk (*) denotes the occurrence of the new peaks upon phase transformation. |
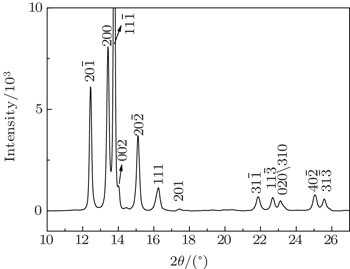
The α″-Ce has a low symmetry monoclinic structure, with a C2/m space group. The structural of α″-Ce at 8.3 GPa was obtained by full Rietveld refinement in Refs. [4] and [10]. We indexed the diffraction peaks of Ce at 8.35 GPa in Fig.
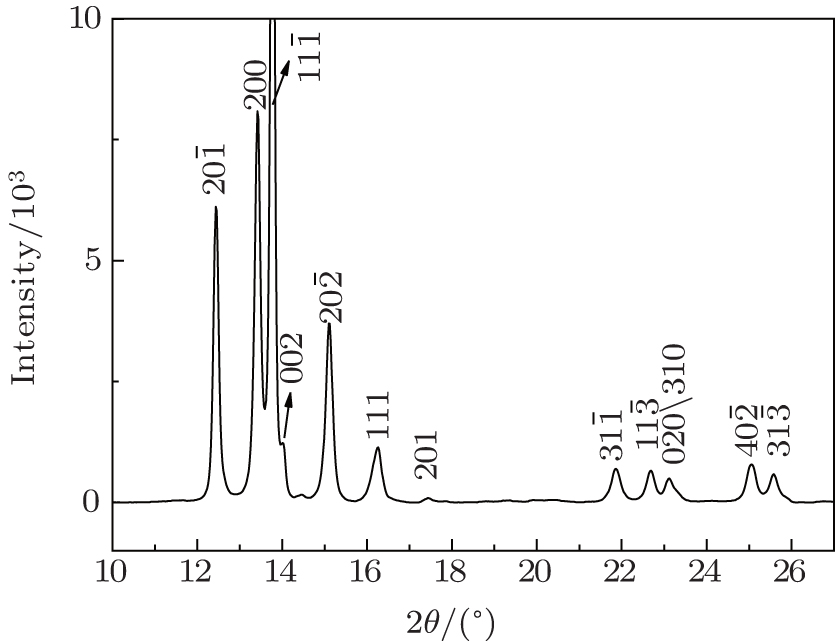 | Fig. 2. The XRD of α″-Ce at 8.35 GPa. |
Figure

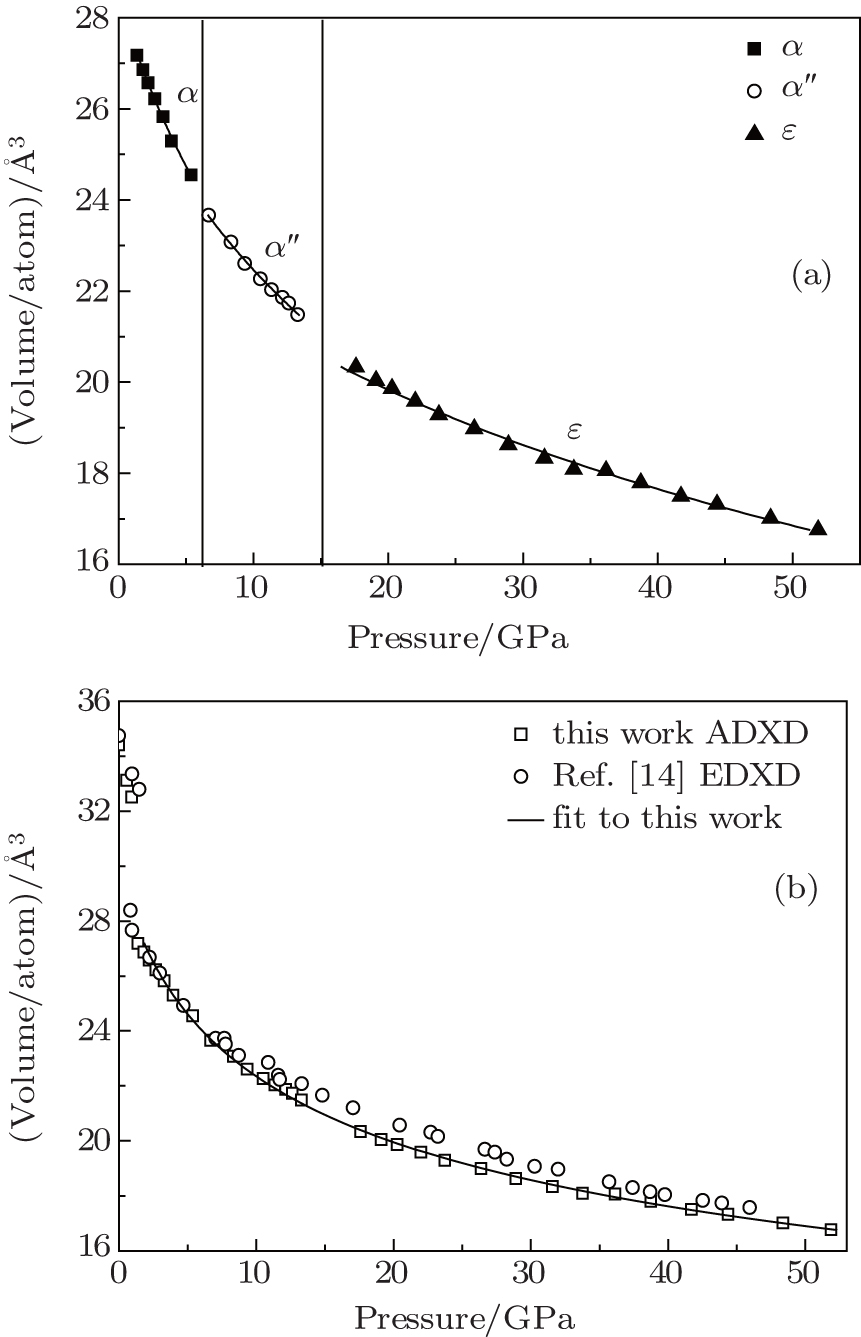 | Fig. 3. (a) Pressure dependence of atomic volume of Ce (except γ-Ce). Each phase is fitted by Birch–Murnaghan equation of state fixing  |
| Table 1. Comparison among equation-of-state parameters |
The equation-of-state parameters of Ce are shown in Table
As shown in Fig.

Figure
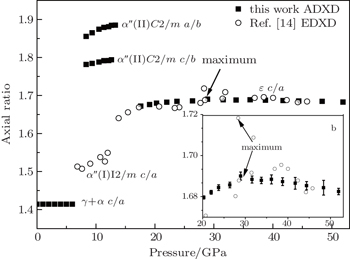
 | Fig. 4. Variations of axial ratio (long-axial/short-axial) for monoclinic (α″-Ce) and tetragonal (ε-Ce) descriptions with pressure. The fcc (γ-Ce and α-Ce) can be expressed as nonstandard bct structure  |
The inset in Fig.
The ADXD experiments at high pressure with Ce metal loaded with silicon oil as a pressure-transmitting medium under pressures up to 51 GPa result in an identical sequence of phase transitions with almost the same values of pressures for the phase transformations as in previous experimental conditions. The equation-of-state parameters of α″-Ce and ε-Ce are B0 = (33.6±1.7) GPa, V0 = (27.4±0.2) Å3 and B0 = (65.9±2.8) GPa, V0 = (24.3±0.2) Å3, respectively. The maximum value in the axial ratio at about 29 GPa is c/a = 1.690. Our experimental results will help to trigger more theoretical and experimental work about this mutation near 29 GPa.
| 1 | |
| 2 | |
| 3 | |
| 4 | |
| 5 | |
| 6 | |
| 7 | |
| 8 | |
| 9 | |
| 10 | |
| 11 | |
| 12 | |
| 13 | |
| 14 | |
| 15 | |
| 16 | |
| 17 | |
| 18 | |
| 19 | |
| 20 | |
| 21 | |
| 22 | |
| 23 |