Tang Fei, Zhang Lin-Ji, Liu Feng-Liang, Sun Fei, Yang Wen-Ge, Wang Jun-Long, Liu Xiu-Ru, Shen Ru. Pressure-induced solidifications of liquid sulfur below and above λ-transition. Chinese Physics B, 2016, 25(4): 046102
Permissions
Pressure-induced solidifications of liquid sulfur below and above λ-transition
Tang Fei1, Zhang Lin-Ji1, 2, Liu Feng-Liang2, Sun Fei2, Yang Wen-Ge2, 3, †, , Wang Jun-Long1, Liu Xiu-Ru1, ‡, , Shen Ru4
School of Physical Science and Technology, Key Laboratory of Advanced Technologies of Materials, Ministry of Education of China, Southwest Jiaotong University, Chengdu 610031, China
Center for High Pressure Science and Technology Advanced Research (HPSTAR), Shanghai 201203, China
High Pressure Synergetic Consortium (HPSynC), Geophysical Laboratory, Carnegie Institute of Washington, Illinois 60439, USA
Analyses and Test Center, Southwest Jiaotong University, Chengdu 610031, China
Project supported by the Joint Funds of the National Natural Science Foundation of China (Grant No. U1530402), the National Natural Science Foundation of China (Grant No. 11004163), the Fundamental Research Funds for the Central Universities, China (Grant No. 2682014ZT31), the Department of Energy National Nuclear Security Administration (Grant No. DE-NA0001974), and the Department of Energy Basic Energy Sciences (Grant Nos. DE-FG02-99ER45775 and DE-AC02-06CH11357).
Abstract
Abstract
Two kinds of glassy sulfurs are synthesized by the rapid compression method from liquid sulfur at temperatures below and above the λ -transition point. The glassy sulfur has different colors and transparencies, depending on temperature, which may inherit some structural information from the λ -transition. Raman spectrum studies of these samples show that a large fraction of polymeric chains exist in the glassy sulfur, even in the one solidified from T < Tλ. We find that a higher compression rate instead of a higher temperature of the parent liquid captures more polymeric chains. Pressure-induced glassy sulfur presents high thermal stability compared with temperature quenched glassy sulfur and could transform into liquid sulfur directly without crystallization through an abnormal exothermic melting course. High energy x-ray diffraction is utilized to study the local order of the pressure-induced glassy sulfur.
At 159 °C a phase transition in the liquid sulfur is known as the λ -transition, with an abnormal increase of viscosity with increasing temperature over a temperature range of 20 °C, accompanied by rapid changes in optical and thermodynamic properties.[1–3] The λ -transition has attracted considerable experimental as well as theoretical attention for many decades.[3–8] However, no model satisfactorily accounts for its puzzling temperature dependence of viscosity. The λ-transition is explained mostly as a liquid-liquid transition from an S8 ring monomer to a polymeric phase.[3,4] The presence of polymeric sulfur is the key factor for extracting information about many thermodynamic aspects of the λ-transition.[8] In order to study the liquid structures at different temperatures, one can quench molten sulfur from various temperatures to low temperature (for example, to liquid nitrogen temperature), and study the local structure of quenched glassy sulfur.[8–11] Although these studies demonstrate that there is an obvious content increase of polymeric chains after the λ-transition, the formation of a glass composed of pure S8 ring molecules, quenched from T < Tλ, has not yet been reported.[8] The investigation of the λ-transition which has been tackled for more than 150 years is still an attractive challenge.[6,7,12]
As is well known, the quenched glassy sulfur is very unstable. Slightly above the glass transition temperature Tg, say, in a range of −40 °C–−20 °C depending on thermal history, gradual crystallization takes place.[4,8,13] At room temperature, the crystallization can be completed very quickly.[4,8] In the crystallization process, the polymeric chains revert back to the more stable S8 rings. The extremely high tendency towards crystallization precludes the quenched glassy states from being characterized in detail, which restricts our understanding of the λ-transition.[4] Recently, a pressure-induced solidification of glassy sulfur from liquid sulfur was developed, which demonstrated an extraordinary thermo-dynamical stability.[14–16] When heated to above room temperature, crystallization could be effectively avoided by using at least a 10 K/min heating rate and polymeric fraction remains until melting.[17,18] The high thermal stability allows us to study the λ-transition by characterizing the glassy sulfurs solidified from different liquid temperatures. In this work, we prepare two kinds of glassy sulfurs from liquid sulfur below and above the λ-transition and with two different compression rates. We examine the relative fraction of the polymeric content by exploiting the distinctive Raman signals at 472 cm−1 for S8 rings and 461 cm−1 for polymeric chains respectively.[13] The pressure dependence of the polymer content, to which the liquid is rapidly compressed, and the mechanism of high thermal stability of the pressure-induced glassy sulfur are also discussed.
2. Experimental details
Figure 1(a) shows the sample assembly in a high pressure cell. Elemental sulfur with a 99.999% purity available from Shanghai Chem. Co. of China Medicine Group, was filled in an aluminum container. A set of piston–cylinders made of tungsten carbide with a resistance coil heater was used to produce high pressure and high temperature. The pressure was calculated from the diameter of the piston–cylinder and loading force without consideration of friction, and the temperature was measured by a NiCr–NiSi thermocouple. The temperature gradient between the sample and the detected point has been pre-calibrated. The sulfur was first heated to molten states and solidified by a rapid compression within about 20 ms, which was conducted on a rapid pressure-jump apparatus.[19] We prepared four glassy sulfur samples with two different molten temperatures and compression rates, and these samples were denoted by A, B, C, and D as shown in Fig. 1(b). All four samples were pre-pressed first when the working table of the pressure-jump apparatus touched the piston to ensure rapid compression later. The samples A and B were heated to 155 °C which is below Tλ but above melting point. Similarly, samples C and D were heated to 180 °C, above Tλ. All molten sulfur samples were rapidly compressed by a force of about 7.4×10⁵ N. Two sizes of piston-cylinder mode with diameters of 26 mm and 20 mm were used to produce different compression pressures: 1.39 GPa for A and C, and 2.36 GPa for B and D.
Fig. 1. (a) High pressure cell assembly for fast compression and heating, (b) optical images of samples A, B, C, and D, prepared at different temperatures and pressures, (c) mechanical testing on samples A and D, showing their good pliabilities and extensibilities.
The colors of the above mentioned four samples inherit the information from sulfur λ-transition information. It is known that the color of liquid sulfur changes from light-yellow to dark yellow during λ-transition and finally dark-red at higher temperatures. These four samples were further analyzed by x-ray diffraction (XRD) (X’ Pert. PRO. MPD. Philips) by using Cu Kα radiation. Raman spectroscopy (in-Via, Renishaw) with a 532-nm excitation laser with a spectral resolution of 1 cm−1 was preformed. The calorimetric measurement of melting behaviors was conducted on the TA-2920 instrument with a heating rate of 10 K/min. The pair distribution function studies of A and D samples were conducted with energy-dispersive x-ray diffraction (EDXRD) mode using a VX-3 Paris-Edinburgh press at the white x-ray beamline 16-BM-B, High Pressure Collaborative Access Team (HPCAT) at the Advanced Photon Source, Argonne National Laboratory. The incident white x-ray beam was collimated to a size of 0.3 mm (vert.) ×0.1 mm (horiz.) by using two sets of tungsten slits. The measurements were conducted at 233 K for sample A and 235 K for sample D under ambient pressure. The XRD patterns were collected by a Ge solid-state detector at nine different 2θ angles (3°, 4°, 5°, 7°, 9°, 12°, 16°, 22°, and 28°), to cover a large Q range (Q = 4πE sinθ/12.398, where E is the x-ray energy up to 125 keV). The typical time for collecting one set of diffraction patterns of nine angles was about 2 h. The details of the EDXRD measurement and data analysis method are described in Ref. [20].
3. Results
Figure 1(b) shows the pictures of the four samples and visually indicates their different preparation conditions. The samples A and B quenched from temperatures below Tλ are light yellow and opaque, while the samples C and D quenched from temperatures above Tλ are dark yellow and transparent. These features are quite consistent with the liquid λ-transition of sulfur. The four samples all display good elastic behaviors. Figure 1(c) shows good pliabilities and extensibilities of samples A and D. The amorphous structures in the four samples are confirmed by XRD analyses. As shown in Fig. 2(a), each of the XRD profiles consist of a few amorphous broad peaks without any sharp crystalline peak. It indicates that the crystallization is avoided during the rapid compression.
Fig. 2. (a) XRD patterns of samples A, B, C, and D, indicating their amorphous states, (b) Raman spectra of samples A, B, C, and D. Multiple peaks fitting at 440 cm−1, 461 cm−1, and 472 cm−1 are shown in the inset.
The relative weight fraction of the polymeric content in glassy sulfur is a key parameter. If the λ-transition is essentially a living polymerization transition, the liquid sulfur at T < Tλ should consist of S8 ring molecules and correspondingly the glassy sulfur composed of pure S8 ring molecules should be available. However, the formation of a glass composed of pure S8 ring molecules, rapidly quenched from T < Tλ, has not yet been reported.[8] In the present work, we measure the fractions of the polymeric content in glassy sulfurs, solidified from T < Tλ and T > Tλ by rapid compression. The central issue is to check whether a glassy sulfur composed of pure S8 ring molecules is possible. Quenched glassy sulfur referred to as ‘elastic sulfur’ displays good elasticity like a typical rubber.[4] Its elastic property is attributed to polymeric chains frozen in the glassy sulfur.[4] In this work, four samples A, B, C, and D all display good elasticities, which implies that the polymeric chains may exist in the glassy sulfur solidified from T < Tλ. The existence of polymeric chains is testified by Raman spectrum analysis. Figure 2(b) shows the Raman spectra from samples A, B, C and D at room temperature in a range of 100 cm−1–600 cm−1. The distinctive vibration peak of polymeric chains is located at ∼ 461 cm−1 and the vibration peaks of an S8 ring molecule are located respectively at ∼ 472 cm−1, ∼ 220 cm−1 and ∼ 150 cm−1.[13] The value of area ratio A461/A472 between peak 461 cm−1 and 472 cm−1 is used as the evaluation of the relative fraction of polymeric chains in glassy sulfur. In Fig. 2(b), the 461-cm−1 peak appears in each of samples A and B, which was solidified from T < Tλ. The values of A461/A472 are 0.66 and 1.33, and correspondingly the relative weight fractions of polymeric chains are 40% and 57% for samples A and B respectively. This shows that the polymeric chains can exist even in the glassy sulfur with solidification temperature below Tλ and the glassy sulfur composed of pure S8 ring molecules cannot be formed, even if the rapid compression method is used.
Then the next question would be whether the polymeric chains are inherited from the parent liquid or formed during the rapid compression. This issue can be deduced from the percentage change of relative Raman vibration intensity from S8 ring (472 cm−1) to a polymeric chain (461 cm−1) across the λ-transition and compression pressure. Considering the peak areas at 472 cm−1 and 461 cm−1 as the corresponding weight factors for the S8 ring and polymeric chain, the ratio A461/A472 provides a reasonable finger print on the ring-chain transition. For samples A, B, C, and D, the ratios are 0.66, 1.33, 0.46, and 1.81, respectively. There is not a clear trend by comparing the temperature effects between A and C (decreasing), and between B and D (increasing), but the pressure effect is pretty consistent and significant (for samples A and B, their A461/A472 ratios change from 0.66 to 1.33, and for samples C and D, the ratios change from 0.46 to 1.81). It is clear that a higher compression rate and a larger amplitude of pressure jump, instead of increasing the temperature of the parent liquid, could capture more polymeric chains. So, the polymeric chains are properly formed in rapid compression course, and a glass composed of pure S8 ring molecules cannot be formed even when solidified from T < Tλ. Furthermore, we should remember that the glassy sulfurs solidified from below and above the λ-transition show different colors and transparencies, which is consistent with liquid sulfur. Does this mean that the two sets of glassy sulfurs inherit some information of λ-transition? But the existence of polymeric chains in both sets of glassy sulfurs suggests that the polymeric chains are not the factor that leads to the color distinction. In the future, the analyses of the two sets of glassy sulfurs will be conducted to reveal more information under the λ-transition. We also notice that the vibration mode located at 461 cm−1 gains intensity at the expense of the 472 cm−1, 220 cm−1, and 150 cm−1 modes. The competition between the S8 rings and polymeric chains indicates that joining which kind of cluster is an alternative choice for the sulfur atoms. The mechanism of forming polymeric chains needs further study by in-situ investigations or simulations in the future.
As mentioned earlier, the pressure-induced glassy sulfur shows extraordinary thermo-dynamical stability.[14–16,21] When heated to above room temperature, crystallization could be effectively avoided by using at least 10 K/min heating rate and polymeric fraction remains until melting.[17,18] We reported a direct transition from pressure-induced glassy sulfur to liquid accompanying an abnormal exothermic effect.[17] The exothermic transition from glassy sulfur to liquid sulfur likely possesses an additional exothermic contribution stemming from the polymeric chain-S8 ring transition, which affects its change of internal energy and makes it much larger than that of the endothermic process.[18] Since the large fraction of polymeric chains exist in samples A, B, C, and D in this work, the extraordinary exothermic melting should occur in all four samples. Figure 3 shows the calorimetric measurement in a range of 40 °C–220 °C with a heating rate of 10 K/min. The differential scanning calorimetry (DSC) traces each display as an exothermic melting peak in a range of 90 °C–145 °C and an endothermic peak at around 165 °C which corresponds to the λ-transition. Why does the pressure-induced glassy sulfur behave more stably than the quenched glassy sulfur, which crystallizes very easily especially above room temperature? Comparing the Raman spectra of pressure-induced glassy sulfur with those of quenched glassy sulfur, the spectra are very similar in a 100 cm−1–500 cm−1 spectral region. The dominant difference is in the value of ratio A461/A472. The value of ratio A461/A472 is much higher in pressure-induced glassy sulfur than in quenched glassy sulfur, which means that the polymeric content is much higher in the former.[8,13] We attribute the extraordinary thermo-dynamical stability in pressure-induced glassy sulfur to being due to a large fraction of polymeric chains. The glassy sulfur, solidified by either rapid quenching or rapid compression, consists of S8 rings and polymeric chains. The section of disordered S8 rings in the glassy sulfur is very unstable and crystallizes quickly above Tg. The section of polymeric chains, by contrast, is stable. A polymeric chain in quenched glassy sulfur also shows higher thermal stability than the disordered S8 ring.[4] The insoluble residue left after extracting quenched glassy sulfur with CS2, which removes the monomeric S8 rings, is known as ‘Crystex’ or ‘ω-sulphur’ or ‘ψ-sulphur’.[4] Although the Crystex which consists of pure polymeric chains is in a semi-crystalline state, it behaves more stably than the quenched glassy sulfur which is the mixture of polymeric chains and S8 rings, the transition of the polymeric sulfur to S8 rings becomes fast above 90 °C.[4] In Ref. [4] Tobolsky et al. reported the temperature dependence of the specific volume in Crystex, and a change of slope from 75 °C. They concluded that it corresponds to a glass transition temperature. However, they could not determine the melting point of Crystex because the crystallization appeared at a little higher temperature. In the present work, the glass transition of polymeric chains is not observed but the abnormal melting is found to take place at around 90 °C through the calorimetric measurement (see Fig. 3).
Fig. 3. DSC profiles of samples A, B, C, and D each with a 10-K/min heating rate. Each of all the samples displays an exothermic melting peak in a range of 90 °C–145 °C and an endothermic peak at around 165 °C which corresponds to the λ-transition.
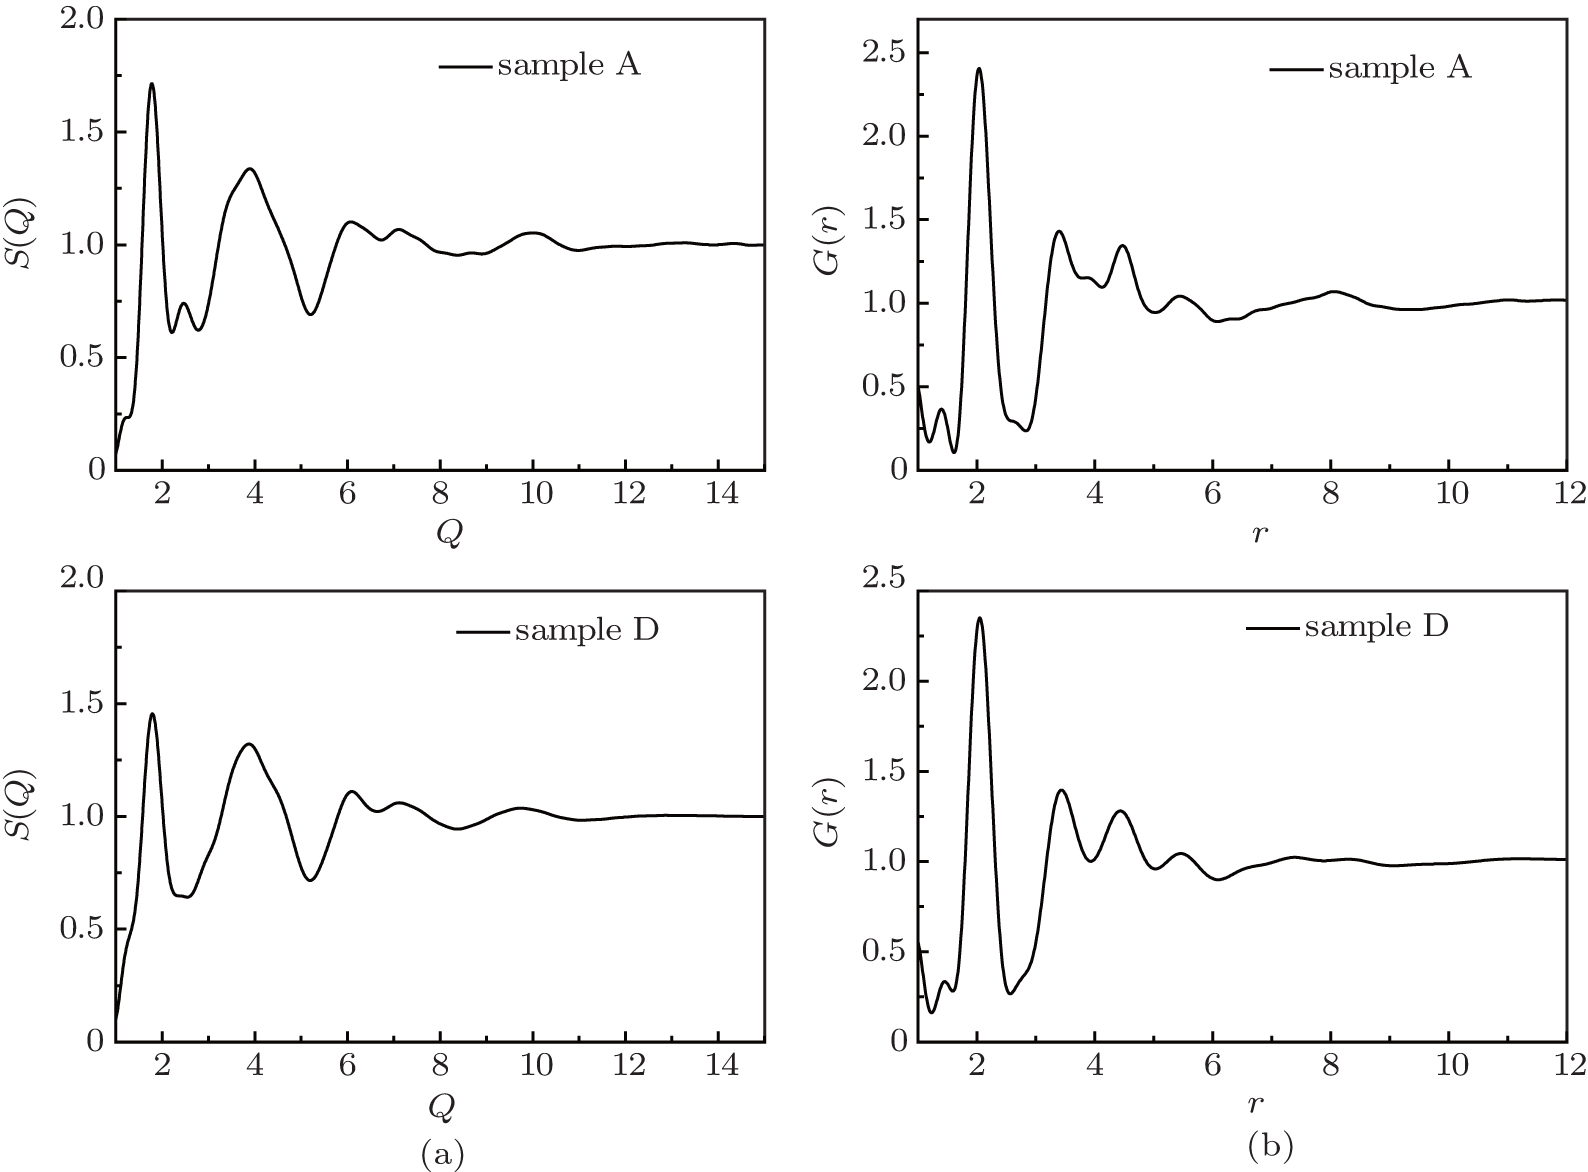
In order to elucidate the structural characteristics of the glassy sulfur solidified by the rapid compression method, we conduct a high energy x-ray diffraction (XRD) experiment at High Pressure Collaborative Access Team (HPCAT). Figure 4(a) displays the plots of structure factor S(Q) versus Q of samples A and D, solidified from T < Tλ and T > Tλ respectively. The first two maxima of S(Q) are at Q1 = 1.78 Å−1 and Q2 = 3.90 Å−1 for sample A and Q1 = 1.79 Å−1 and Q2 = 3.88 Å−1 for sample D respectively. There are some minor differences between these two S(Q) profiles: a weak peak at Q3 = 2.47 Å−1 and a relatively high intensity ratio S(Q1)/S(Q2) in sample A, indicates that there are some distinctions in the intermediate-range order between samples A and D. The difference in S(Q) at Q > 4 Å−1 is very small, which indicates that the short-range orders of the sulfur molecules in samples A and D do not change markedly, although their parent liquid temperature across the λ-transition does. The data of S(Q) are then Fourier-transformed to the pair distribution function G(r) (see Fig. 4(b)). Each of the G(r) curves shows two nearest neighbors centered at 2.04 Å, a second concentration of roughly three atoms at about 3.41 Å, followed by peaks at 4.45 Å and 5.46 Å. From these data, it is obvious that the structural changes accompanying the parent liquid temperature across the λ-transition are very small in pressure-induced glassy sulfur. A similar conclusion was given when a comparison of the G(r) between liquid sulfur and quenched glassy sulfur was made.[10] The high similarity in structural characteristics between glassy sulfurs solidified from T < Tλ and T > Tλ concurs with similar structural characteristics between liquid sulfur at T < Tλ and T > Tλ. It also explains the highly similar representation of Raman spectra and calorimetric curves in the two kinds of glassy sulfur.
Fig. 4. (a) Plots of structure factor S(Q) versus Q and (b) radial distribution function G(r) versus r of samples A and D.
4. Conclusions
In this work, we solidify glassy sulfurs from liquid sulfur at temperatures below and above the λ-transition point by a rapid compression method. A large fraction of polymeric chains exist in the glassy sulfur that is solidified at T < Tλ. The glassy sulfur composed of only pure S8 ring molecules is not detected by using the rapid compression method. We find that a higher compression rate and larger amplitude of pressure jump, instead of a higher temperature of the parent liquid, can capture more polymeric chains. The polymeric chains are properly formed in the rapid compression course. The glassy sulfurs solidified from below and above the λ-transition show different colors and transparencies, which is consistent with liquid sulfur and it shows us that the two kinds of glassy sulfurs may inherit some information about the λ-transition. But the existence of polymeric chains in both sets of glassy sulfur suggests that the factor that causes color distinctions does not refer to polymeric chains. In the future, the analyses of the two sets of glassy sulfurs will be conducted to reveal more information under the λ-transition.


 , Wang Jun-Long1, Liu Xiu-Ru1, ‡,