Laser frequency locking based on the normal and abnormal saturated absorption spectroscopy of 87Rb
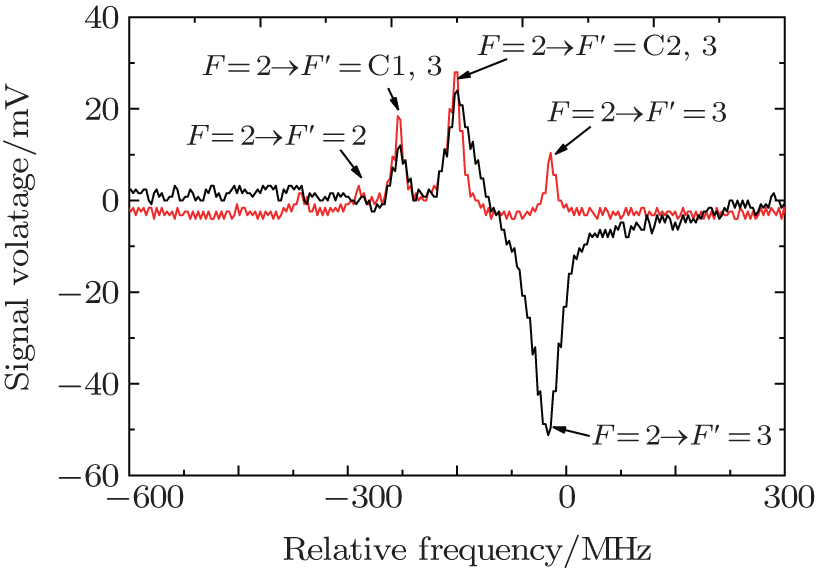
Saturated absorption spectra. In this figure, the black line represents the abnormal saturated absorption spectrum and the red line represents the normal saturated absorption spectrum.

