Soliton excitation in the pass band of the transmission line based on modulation
Zhao Guoying1, Tao Feng2, Chen Weizhong3, †, 
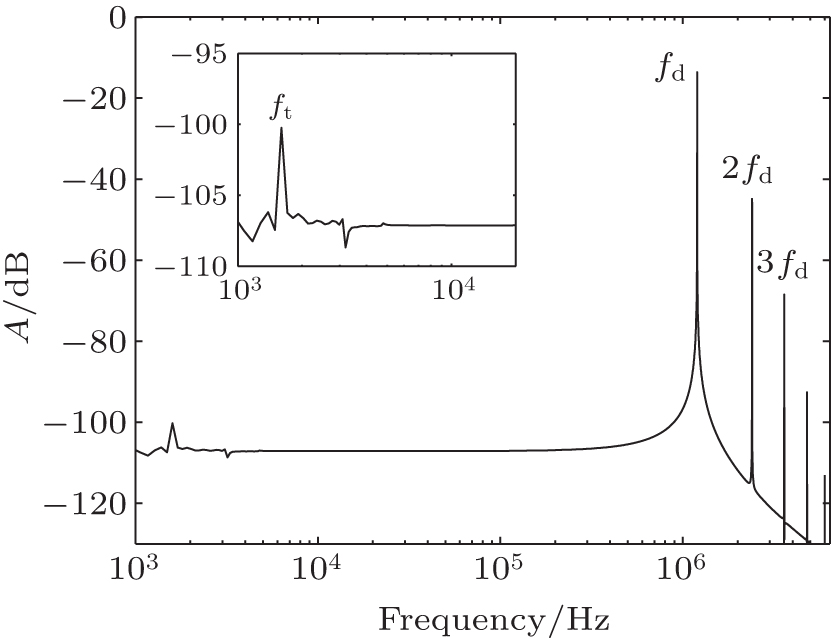
Plot of frequency spectrum versus frequency of the 100-th cell wave. The
Soliton excitation in the pass band of the transmission line based on modulation |
|
Zhao Guoying1, Tao Feng2, Chen Weizhong3, †,
|
Plot of frequency spectrum versus frequency of the 100-th cell wave. The |
| |