Unifying the crystallization behavior of hexagonal and square crystals with the phase-field-crystal model
Yang Tao†, , Chen Zheng, Zhang Jing, Wang Yongxin, Lu Yanli
State Key Laboratory of Solidification Processing, Northwestern Polytechnical University, Xi’an 710072, China


† Corresponding author. E-mail: 420929211@163.com

Project supported by the National Natural Science Foundation of China (Grant Nos. 54175378, 51474176, and 51274167), the Natural Science Foundation of Shaanxi Province, China (Grant No. 2014JM7261), and the Doctoral Foundation Program of Ministry of China (Grant No. 20136102120021).

Abstract
Abstract

By employing the phase-field-crystal models, the atomic crystallization process of hexagonal and square crystals is investigated with the emphasis on the growth mechanism and morphological change. A unified regime describing the crystallization behavior of both crystals is obtained with the thermodynamic driving force varying. By increasing the driving force, both crystals (in the steady-state) transform from a faceted polygon to an apex-bulged polygon, and then into a symmetric dendrite. For the faceted polygon, the interface advances by a layer-by-layer (LL) mode while for the apex-bulged polygonal and the dendritic crystals, it first adopts the LL mode and then transits into the multi-layer (ML) mode in the later stage. In particular, a shift of the nucleation sites from the face center to the area around the crystal tips is detected in the early growth stage of both crystals and is rationalized in terms of the relation between the crystal size and the driving force distribution. Finally, a parameter characterizing the complex shape change of square crystal is introduced.

1. Introduction

Remarkable diversity of growth patterns during crystallization has drawn long-standing attention of material scientists.[1,2] Crystal morphology varies greatly with the ordering condition changing, encompassing the faceted structures to symmetric dendrites, which in turn produces an equally diverse range of physical properties. Understanding of this diversity requires the considerations from both interfacial dynamics and external fields.[36] Interfacial dynamics determined by the interplay between interface energy anisotropy and interface kinetic anisotropy governs the complex growth behavior of crystal, while the external fields exert a large influence on the variation of interface anisotropies. Relying on the difference of interface absorption ability, Siegfried et al. have succeeded in controlling the morphology evolution of cuprous oxide by altering specified interfacial energies.[7] Through the tuning of supersaturation, Xu et al. discovered the dependence of growth pattern and induction time of KADP on ammonium concentration.[8]

Due to the complexities in experiments to dynamically capture the crystallizing process in atomic length scale, computer simulation has been proven to be a powerful tool in this regard.[917] As an extension of dynamical density functional theory,[1517] the phase-field-crystal (PFC) model is capable of addressing the crystallization kinetics at atomic level while operating on diffusive timescale. Moreover, the crystalline anisotropy and growth driving force are naturally integrated in the PFC model by adopting an orientation-invariant free energy functional. Called for by the increasing importance of two-dimensional (2D) materials, a systematical study of revealing the crystallization mechanism in 2D materials, particularly for the hexagonal lattice and square lattice, is performed. In this work, by checking the atomic growth process using the PFC model, we focus on the interplays among the growth morphology, thermodynamic driving force, and the crystal structure, and resort to finding a unified description of crystallization behavior.

2. The phase field crystal model

Based on the time-averaged atomic density, the dimensionless form of PFC free energy functional is constructed as[15,16]

where n(r) ∝ (ρρL)/ρL is the reduced atomic density field relative to a reference liquid density ρL. Parameters η and ν are the coefficients in the Taylor expansions of mixing energy denoted by the first bracket. Correlation functions C2 are formulated in reciprocal space as[15,16]

where the correlation function in Eq. (2b) is composed by the envelop of two relevant peaks representing {10}sq and {11}sq planes in square crystal. Parameter ε relates to system temperature, αi and ki correspond to the peak width and peak position, while ρi and βi denote the atomic density in a plane and the number of planes in each family (i = 1, 2), respectively. As a conserved order parameter, the temporal evolution of the atomic density n(r) obeys the following diffusive equation:

In order to stabilize respective structures, simulation parameters for the hexagonal square are set to be (η, v) = (0, 3) and ε = –0.6, while for square crystal (η, v) = (1, 1), ε = 0, and To initiate the crystallization process, a predefined supercritical nucleus is placed in the center of the simulation cell first, where the density fields for hexagonal and square phases are given by the following approximation:

where represents the initial average density of the liquid phase. The amplitudes and the wave number qhex are determined by the free energy minimization. The equation of motion is numerically solved on a 2048×2048 grid using semi-implicit spectrum method. Periodic boundary conditions are assumed at the perimeter of simulation domains.

3. Results and discussion

In the PFC model, the driving force of crystallization can be altered by changing the supersaturation of the system (here defined as σ =(liq)/(sqliq),[17] where liq and sq represent the average densities of the equilibrium liquid and solid phases, respectively), i.e., by changing the initial average density of the liquid . In this section, we will first present the crystallization process of hexagonal crystal with the average density ranging from −0.49 to −0.462, and then, followed by the description of the growth process of square crystal with the average density varying from = −0.1 to − 0.05. In the end, we will relate our simulation results to the experiments.

As shown in Fig. 1, the liquid–solid interface advances in a layer-by-layer (LL) growth mode with = −0.49. In order to preserve the permutation symmetry, Miller–Bravais index notation is used to define the crystallography in the hexagonal crystal. Shown in Figs. 1(b) and 1(c), new atomic layers nucleate on the center of the existing faces first, then extend along the directions by absorbing new solid atoms to the kinks. The interface moves forward one-layer thick when the newly formed layers are completely fulfilled. The preferred nucleation position and the subsequent lateral growth can be rationalized by the change in the free energy density profiles along faces. A smoothing procedure is performed on the original atomic density field n(r) to acquire the free energy density distribution.[18] In Fig. 2(a), it is shown that the free energy density at point C is much lower than those at other positions along faces, demonstrating a higher driving force to nucleate at point C compared to other positions. Meanwhile, the free energy goes up with the distance from point C increasing. Therefore, new solid atoms tend to attach onto the kinks around the newly formed nucleus, resulting in the lateral growth along direction. In addition, this non-uniform distribution of free energy density hinders the planar migration mode of smooth faces. When the crystal grows into a larger size, the nucleation position of layers shift from the central area to positions near the crystal tip of faces, as shown in Fig. 1(d). This is reflected by Fig. 2(b), where the areas with the lowest free energy value have changed to positions ‘T’. The transition of the nucleation sites may be attributed to the overlapped effect of the driving force, as shown in Fig. 2(c). Due to Berg’s effect, the driving force near the corner is the highest, as indicated from the free energy density curves in Fig. 2(b). However, at the early growth stage the crystal size is relatively small, which might lead to an overlap region of the driving force built in the center of faces, giving rise to a new highest point at the center, as shown in Fig. 2(c). On the other hand, if assuming there are initially two nuclei generated near the tips of faces, the distance between them would be practically zero given the limited size of faces.

Figure 3 shows the incubation time expended by the nucleation process and the growth time for filling the new layers after the nucleation. As shown by Fig. 3(a), the incubation time tN is much longer than the growth time tG, indicating that no new nucleus will be generated before the former one is fully filled, corresponding to the LL growth mode in Fig. 1. Although the growth time tG increases from t2t1 = 400 to with the time reaching t = 16900, the incubation time tN is still greater than tG, demonstrating the preservation of the LL growth mode.

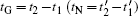
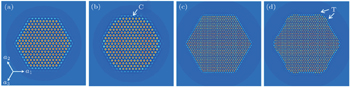
Fig. 1. Crystallization process of hexagonal crystal structure simulated with = −0.49 at different times: (a) t = 3500, (b) t = 4000, (c) t = 18500, and (d) t = 19000. For a better visualization, magnification factors of panels (a) and (b) are larger than those of panels (c) and (d).
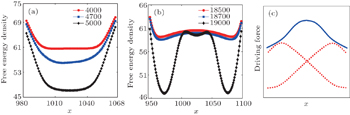
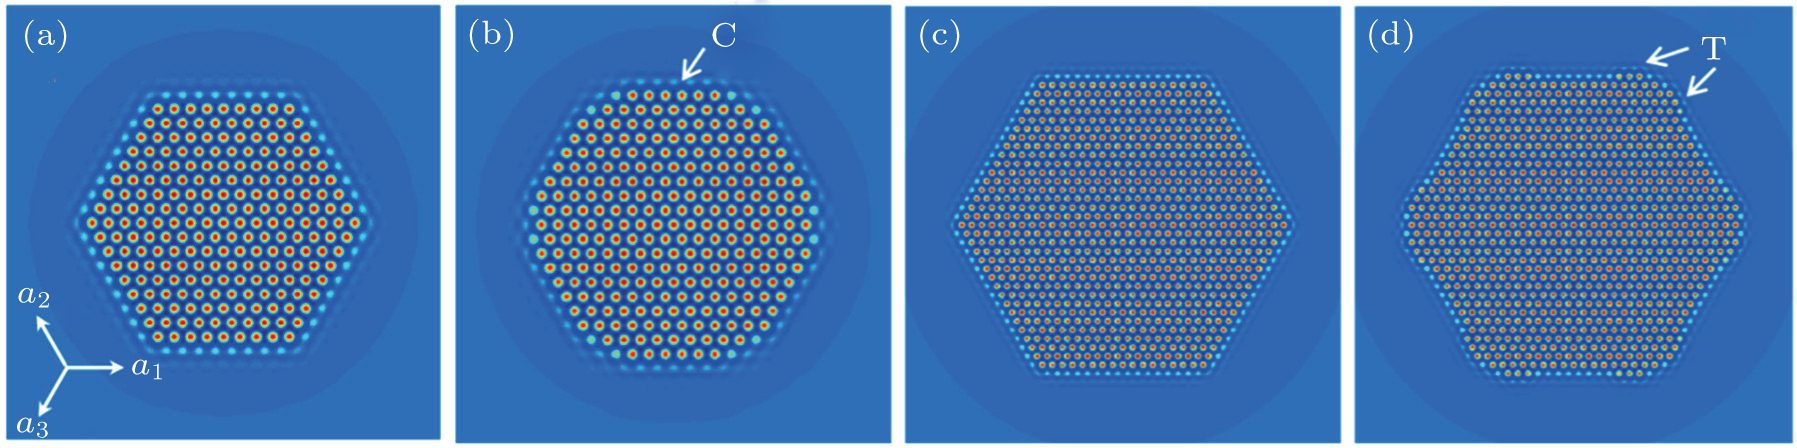
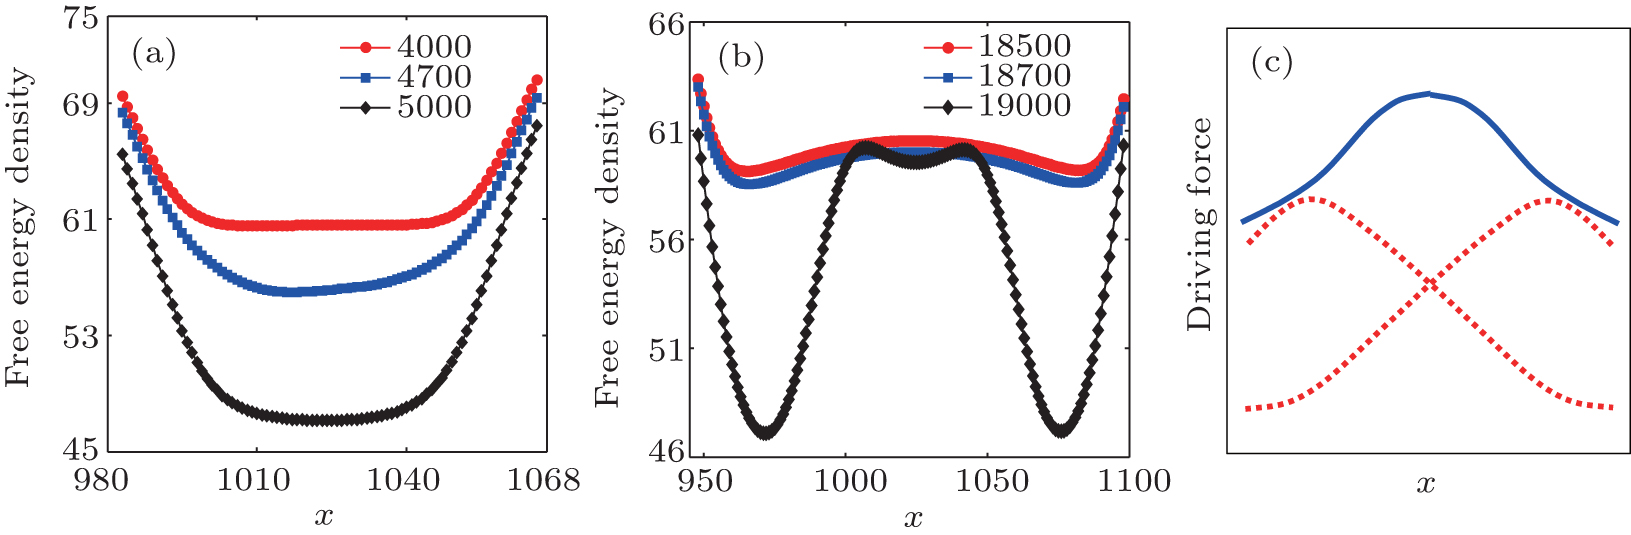
Fig. 2. (a) and (b) The variation of free energy density along directions during the nucleation, and (c) the schematic illustration of driving force distribution along direction at the early growth stage before (red dotted lines) and after overlapping (blue solid lines).
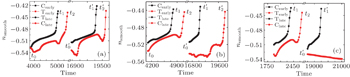
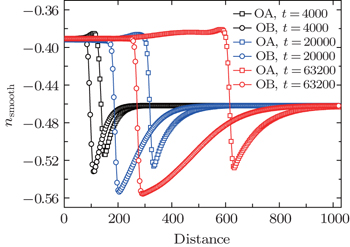
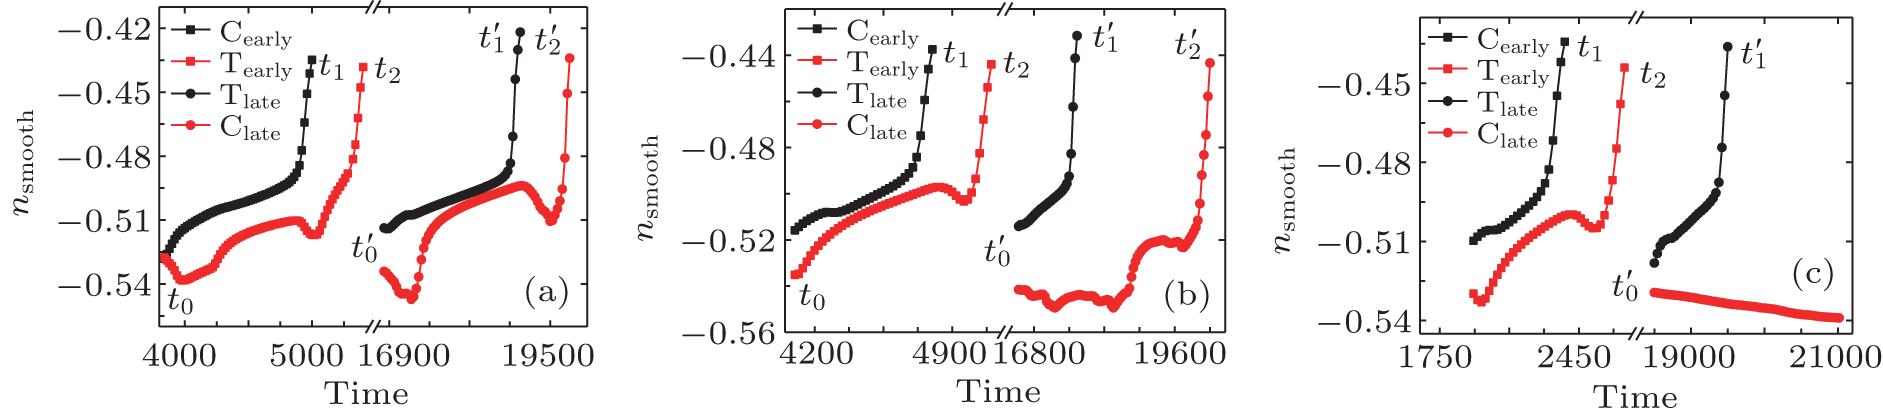
Fig. 3. The variation of smoothed atomic density at positions C and T (shown in Fig. 1) versus time with the average density = −0.49 (a), −0.47 (b), and −0.462 (c), respectively. Black lines depict the incubation time for nucleation, and the red lines imply the growth time.

Figure 4 shows the morphological evolution process with the average density increased to −0.47, along with the atomic description of interface migration. The crystal morphology is depicted using the smoothed atomic density fields as mentioned above. With the progress of crystallization, the crystal in Fig. 4(a) has gradually transited from a faceted hexagon into an apex-bulged hexagonal shape shown in Figs. 4(b)4(d). As seen from Figs. 4(e)4(h), the interface migration mechanism associated with this morphological transition has changed from the LL mode to ML mode, where in the latter case a new nucleation event occurs before the former layer is filled up. Moreover, the shift of preferred nucleation position from the center of faces to areas close to crystal tips is also captured in Figs. 4(a) and 4(b), consistent with the LL growth mode as discussed in the case of = −0.49. By checking the variations of smoothed atomic density in Fig. 3(b), the incubation time tN (t1t0 = 700) is larger than the growth time tG (t2t1 = 300), demonstrating the selection of the LL growth mechanism. When the time reaches around t = 16000, the period of filling a new layer is much longer than the period of nucleating one Therefore, more than one layer is created before the current one is fully filled, namely the ML growth mode. Meanwhile, because the nucleation sites still remain at positions near the crystal tips of in ML mode as shown in Figs. 4(g) and 4(h), the edges of the hexagon cave in and the apices bulge out along directions.

Based on the above discussion, it is shown that the interface migration mechanism and crystal shape are closely related to the thermodynamic driving force. With the driving force increasing, the period of nucleation drops faster than that of growth, undermining the stability of LL growth mode and favoring the ML growth mode. Thus, the ML growth mode is more favored as the average density is raised up. By setting the parameter = −0.465, the crystal initially shows as a faceted hexagon, then the edges concave in, and finally the crystal develops into a dendrite, as shown in Figs. 5(a)5(d). This is because at the early growth stage, the nucleation period tN (t1t0 = 460) exceeds the growth time tG (t2t1 = 300), as Fig. 3(c) shows. Thus, the interface advances through an LL mode shown in Fig. 5(e), and the crystal takes a faceted morphology correspondingly. Soon the growth time tG surpasses the incubation time tN, leading to the shift to ML growth mode and the consequent apex-bulged shape, as shown in Figs. 5(f) and 5(b). Nevertheless, instead of maintaining the shape as in Fig. 4, the crystal evolves into a dendrite with six tips pointing to directions shown in Fig. 5(g). This can be understood by comparing the variations of diffusion fields along and directions. The gap between the diffusion distance indicated by the same colored lines in Fig. 6 reflects that the local driving force of the interface along line OA is higher than that along line OB, causing a faster growth rate in direction and a star-shaped crystal. With the continuing enlargement of this difference shown in Fig. 6, the time for atoms to aggregate at positions along direction grows tremendously. In other words, atoms take much longer time to occupy the center of newly nucleated faces, leaving more faces being partially filled in the center, which leads to the formation of dendrite branches. The resulting growth time tN associated with faces is extended, indicated by the curve Clate in Fig. 3(c). As a consequence, the crystal finally evolves into a six-fold dendrite shown in Fig. 5(d).

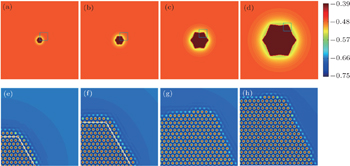
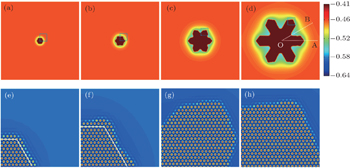
Fig. 4. Growth morphology of hexagonal crystal and the corresponding atomic density fields for the parts enclosed by dashed boxes, simulated with parameter = −0.47 at different times: (a) and (e) t = 2100, (b) and (f) t = 5000, (c) and (g) t = 19200, and (d) and (h) t = 72000. The white lines in panels (e) and (f) outline the newly generated layers. The color bar in the top row represents the variation of the smoothed atomic density field nsmooth.
Fig. 5. Growth morphology of hexagonal crystal and the corresponding atomic density maps for the parts enclosed by dashed boxes simulated with parameter = −0.462 at different times: (a) and (e) t = 1600, (b) and (f) t = 4000, (c) and (g) t = 20000, and (d) and (h) t = 63000. The white lines in panels (e) and (f) outline the newly generated layers. The color bar in the top row represents the variation of the smoothed atomic density field nsmooth.
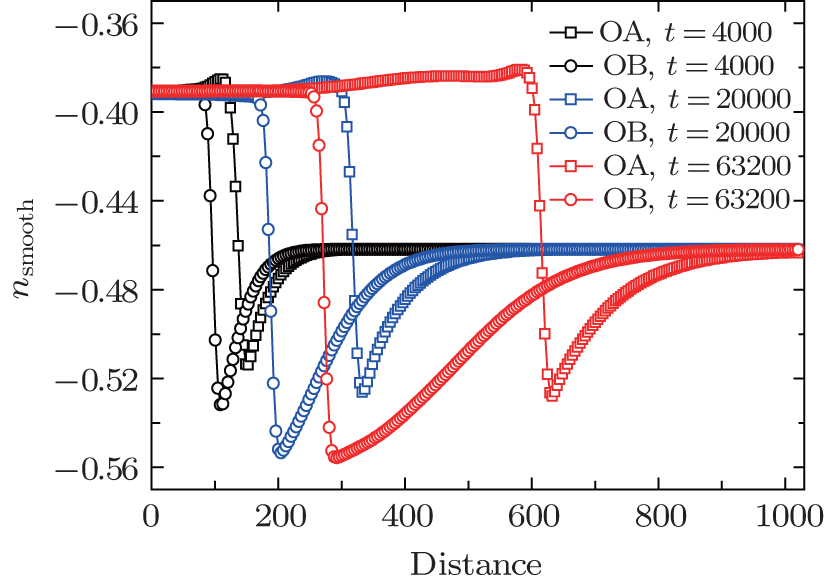
Fig. 6. The smoothed density profiles of hexagonal crystal along lines OA and OB (shown in Fig. 5) at different times.

Similar growth patterns and migration mechanism are also found in the crystallization process of square crystal when increasing the driving force, as shown in Fig. 7. In order to characterize the morphological change resulting from the collective interplay between {10}sq plane and {11}sq plane, we define a parameter using the ratio of distances from the growth front to crystal center along [10]sq and [11]sq, respectively. When the system is at a low driving force, the crystal stays in the ‘truncated square zone’ (yellow region in Fig. 7(a)) with the small {10}sq faces along 〈10〉sq directions. As the driving force is raised, the crystal gradually goes across the ‘truncated square zone’ into the ‘apex-bulged square shape zone’, as shown by the red curve in Fig. 7(a). For a high driving force, the crystal eventually evolves into the ‘four-symmetric dendrite zone’. Accompanied by the dynamic variation of crystal morphology during growth, the migration mechanism in each zone accordingly transits from LL to ML mode, as shown in Figs. 7(c1)7(c3). Summarizing the atomistic evolution process of hexagonal and square crystals, a unified regime describing the dynamic variations of growth morphology and its associated migration mode is established.

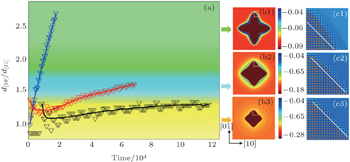
Fig. 7. (a) Distance ratios of growth fronts along [10]sq and [11]sq directions, (b1)–(b3) three characteristic morphologies and (c1)–(c3) the corresponding atomic configurations of the area enclosed by the white box in panels (b1)–(b3). Black, red, and blue triangle symbols in panel (a) are simulated with parameter = −0.1, −0.07, and −0.05, and the curves represent the corresponding smoothed data. The color bars in panels (b1)–(b3) mark the variation of the smoothed atomic density field nsmooth.

Our simulations reveal the orientation selection process associated with various growth patterns of hexagonal crystal and square crystal, which is helpful to illuminate the physical origins of morphological diversity. In our simulations, a non-uniform distribution of driving force around the crystal causing a preferred nucleation at positions near the corners is observed, in conformity with the Berg effect. On the other hand, in experiments during the growth of colloidal films and isotactic polystyrene,[19,20] the crystal displays as a faceted hexagon at low driving force, and transforms to the edge-concave morphology at intermediate driving force and then to the six-fold dendrite when further increasing the driving force, which is in good accordance with the morphological change depicted in Figs. 1,4, and 5. Growth pattern transiting from the square-shaped crystal to the four-fold dendrite is also verified in magnetic alloy and polymers[21,22] with a great resemblance with Fig. 7. In addition, because direct observations of the atomic process of interface advancement in crystal growth are still hard to achieve in experiments, our simulations can serve as guidance in this regard.

4. Conclusions

In conclusion, the morphological transition and growth mechanism of hexagonal and square crystals under the variation of thermodynamic driving forces are investigated at the atomistic scale using the PFC model. The interface of hexagonal crystal advances through the nucleation of layers and the subsequent lateral growth on the existing faces along directions. With the driving force increasing, the faceted hexagon gradually loses its stability, and transforms to a six-fold dendrite with the tips pointing to directions, where the growth mechanism correspondingly changes from LL mode to ML mode. For the square crystal, similar growth regimes are obtained when tuning up the driving force, with the morphology transiting from a truncated square to the four-fold dendrite.

Reference
1Hoyt J JAsta MKarma A 2003 Mater. Sci. Eng. R 41 121
2Sunagawa I1999Forma14147
3Barrett J WGarcke HNürnberg R 2012 Phys. Rev. E 86 011604
4Ferreiro VDouglas J FWarren J AKarim A 2002 Phys. Rev. E 65 042802
5Chen YQi X BLi D ZKang X HXiao N M 2015 Comput. Mater. Sci. 104 155
6Stegemann BRitter CKaiser BRademann K 2004 J. Phys. Chem. B 108 14292
7Siegfried M JChoi K S 2004 Adv. Mater. 16 1743
8Xu DXue D 2008 J. Cryst. Growth 310 1385
9Emmerich HLöwen HWittkowski RGruhn TTóth G ITegze GGránásv L 2012 Adv. Phys. 61 665
10Tang SWang Z JGuo Y LWang J CLu Y MZhou Y H 2012 Acta Mater. 60 5501
11Tang SYu Y MWang J CLi J JWang Z JGuo Y LZhou Y H 2014 Phys. Rev. E 89 012405
12Yang TZhang JLong JLong Q HChen Z 2014 Chin. Phys. B 23 088109
13Yang TChen ZZhang JDong W PWu L 2012 Chin. Phys. Lett. 29 078103
14Gao Y JHuang L LDeng Q QLin KHuang C G 2014 Front Mater. Sci. 8 185
15Elder K RGrant M 2004 Phys. Rev. E 70 051605
16Greenwood MProvatas NRottler J 2010 Phys. Rev. Lett. 105 045702
17Tegze GGránásy LTóth G IDouglas J FPusztai T 2011 Soft Matter 7 1789
18Humadi HHoyt J JProvatas N 2013 Phys. Rev. E 87 022404
19Skjeltorp A T 1987 Phys. Rev. Lett. 58 1444
20Taguchi KMiyaji HIzumi KHoshino AMiyanoto YKokawa R 2001 Polymer 42 7443
21Huang YLiu X BZhang H LZhu D SSun Y JYan S KWang JChen X FWan X HChen E QZhou Q F 2006 Polymer 47 1217
22Ramanujan R VZhang Y R 2006 Appl. Phys. Lett. 88 182506