3.1. Heating simulationThe thermodynamics properties, the characteristics, and the progress of the Ti@Al NPs melting during the heating process can be obtained from data records by MD simulations. Generally, the transition temperature from the solid to liquid phase is usually identified by investigating the variation in the thermodynamic properties such as potential energy and specific heat. Note that the specific heat can be induced as a function of temperature according to the following equation:[33]

where
U is the potential energy and
Rgc = 8.314 J/(mol·K).
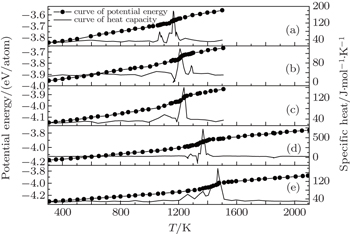
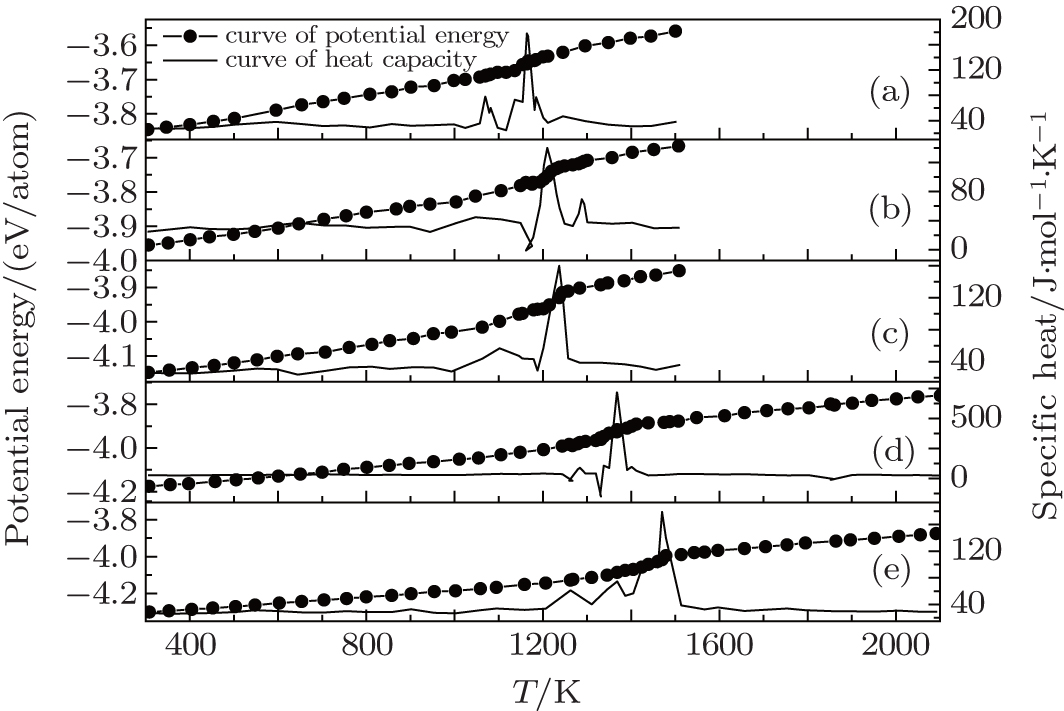
For a constant heating rate of 0.6 K/ps, the temperature dependence of potential energies and specific heat for five Ti@Al NPs is shown in Fig. 2. It can be seen that, the total potential energy decreases with Ti content. This is mainly caused by the lower potential energy of Ti with respect to Al. We also find that, the potential energy for every NP has a linear increase followed by an abrupt jump, occurring due to the release of latent heat of melting. These can be seen clearly in all cases of pure and bimetallic nanoparticles of different composition.[25–28] Hence, the solid–liquid phase transition can be easily revealed by the abrupt change of the potential energy and the sharp peak of the specific heat. The melting point Tm is usually defined as the temperature at which an abrupt jump in potential energy takes place or the temperature at which the specific heat reaches its maximum. The melting temperatures of the five Ti@Al NPs, deduced from the caloric curves, are shown in Table 1. From Fig. 2 and Table 1, it can be seen that for fixed Ti core size, the melting temperature decreases with Al shell thickness. The calculated results can be attributed to the fact that elementary Al possesses an extremely lower melting point than Ti. Therefore, the thinner the Al shell is, the higher composition of Ti, resulting in a higher melting temperature. For different Ti core sized with fixed Al shell thickness, the melting temperature increases with Ti core size. This result demonstrates that for five Ti@Al NPs, Tm gradually increases with Ti composition from NP1 to NP5.
Table 1.
Table 1.
 Table 1. Melting temperature Tm for different NPs. .
| Nanoparticles |
Structure |
Component |
Tm/K |
| NP1 |
Rc = 2 nm, δs = 0.7 nm |
1904 Ti 3662 Al |
1163 |
| NP2 |
Rc = 2 nm, δs = 0.5 nm |
1904 Ti 2462 Al |
1209 |
| NP3 |
Rc = 2 nm, δs = 0.3 nm |
1904 Ti 1280 Al |
1237 |
| pure Ti |
Rc = 2 nm |
1904 Ti |
1375 |
| NP4 |
Rc = 3 nm, δs = 0.5 nm |
6493 Ti 4710 Al |
1368 |
| pure Ti |
Rc = 3 nm |
6493 Ti |
1472 |
| NP5 |
Rc = 4 nm, δs = 0.5 nm |
15176 Ti 7866 Al |
1470 |
| pure Ti |
Rc = 4 nm |
15176 Ti |
1522 |
| Table 1. Melting temperature Tm for different NPs. . |
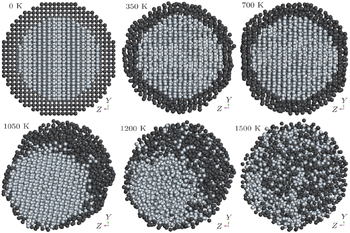
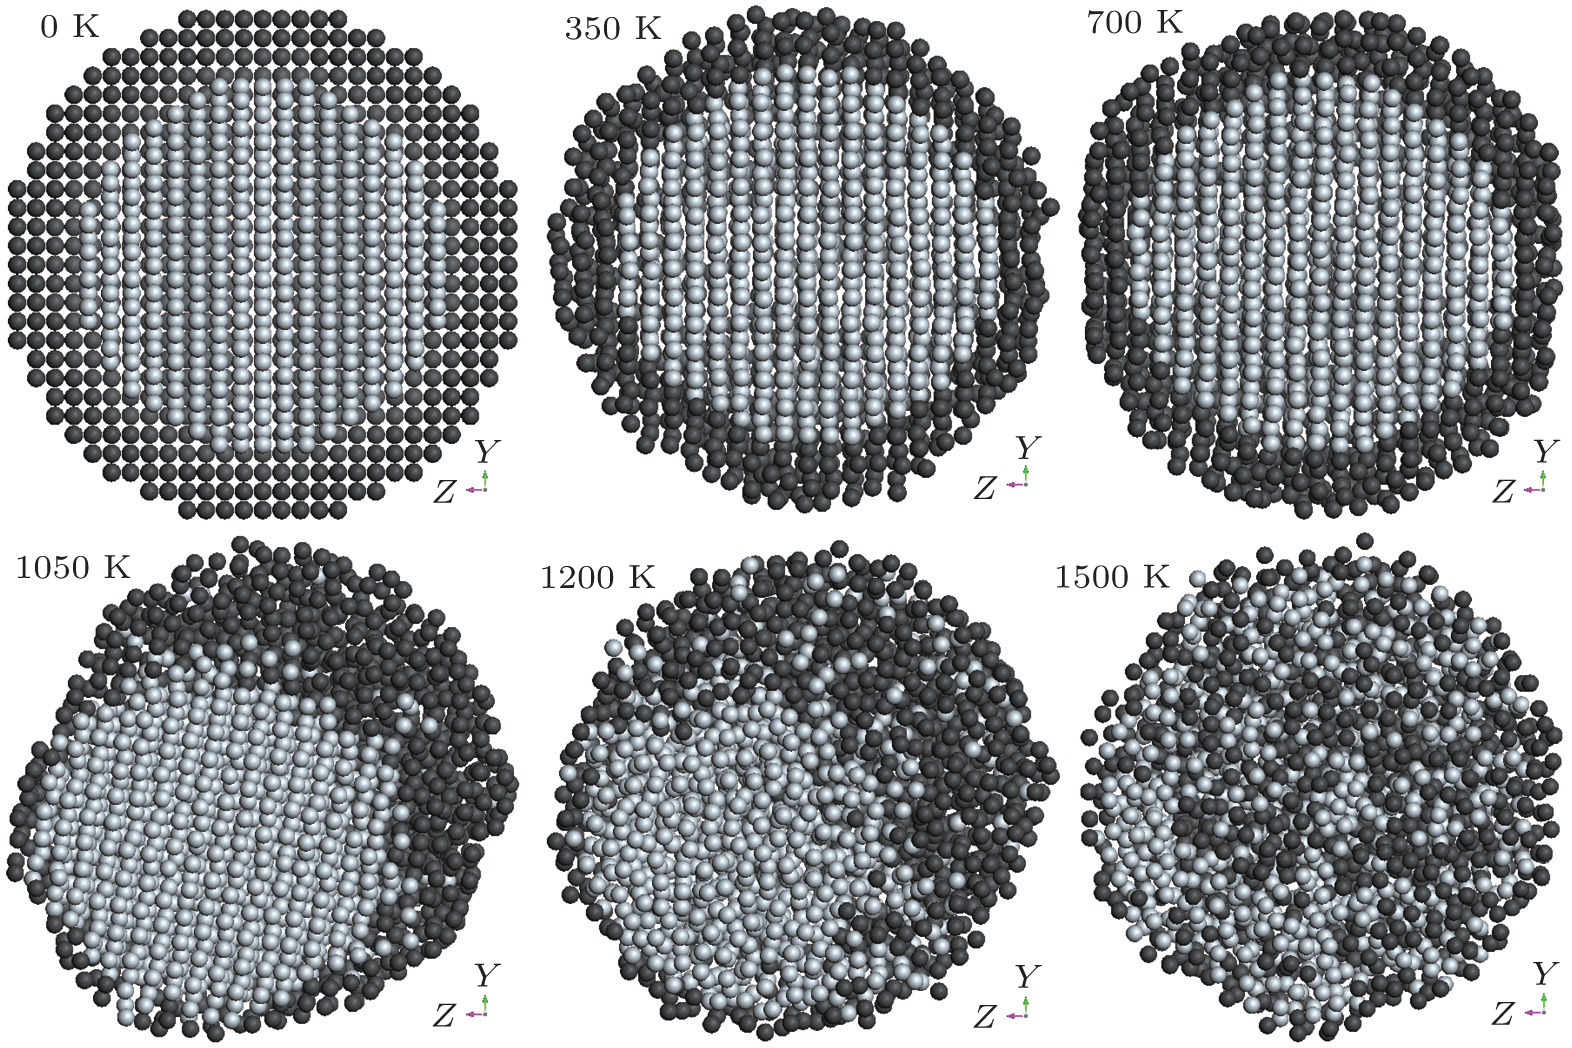
In order to visualize the melting process and to shed light on the melting mechanism, we have investigated atomistic structural evolution of the Ti@Al NPs during the heating process. As a representative, NP2 has been used to exhibit the thermal evolution of core/shell NPs under the continuous heating process. Figure 3 shows the snapshots during continuous heating. Figure 3 displays the two-dimensional cross-sectional view cut through the center of mass. Since the volume of the whole system is constant, these snap shots are taken as radial representations of the whole system. At the lower temperatures, e.g., T = 0 K and 350 K, the Ti@Al NP can retain its initial clear-cut fcc arrangement, which is clearly seen in Fig. 3. When increasing the temperature to 700 K, several surface atoms left their edge location as seen in the snapshots, indicating the premelting occurs on the surface of Al shell firstly. At 1050 K, the position of Al atoms becomes disorderly, but most of the Ti atoms in the core stably preserve the order lattice, indicating the melting of the Al shell. It is concluded that the premelting process of Ti@Al NPs starts from the edge, and then extends to the whole Al surface. At this time, the bimetallic NP can be regarded as a liquid-like Al encapsulated solid Ti particle. This morphology is chemically interesting because the liquid metal atoms on the surface of solid particles may facilitate the dissolution of adsorbates due to their enhanced mobility, enabling the occurrence of different chemical processes.[34] Further elevated temperature could make the melting spread into inner Ti core. At higher temperatures, T = 1250 K, above the melting temperatures, the initial crystalline structure has been completely lost. The global melting is obvious in the snapshots of the NP2 in Fig. 3. The temperature distinctly exceeds the melting points of Al NPs but lower than Tm that of corresponding size pure Ti NPs, meaning that the core/shell structure can be significantly elevated melting temperature of Al shell and reduced melting point of Ti core. We also find that a two-way diffusion is clearly visible, i.e., the Ti core atoms diffusing outward and the shell Al atoms diffusing inward. With the temperature increased to 1500 K, Ti atoms have rapidly diffused into the Al shell due to their enhanced mobility after melting, resulting in the disappearance of core-shell interfacial structure, a well mixed liquid Ti@Al functional droplet forms. The aforementioned results show that the melting of Ti@Al NPs has experienced from surface into interior, exhibiting a distinct two-stage process.
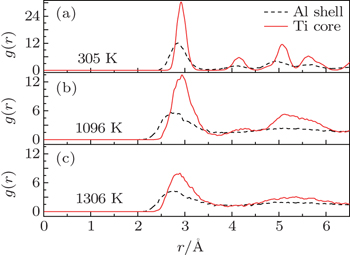
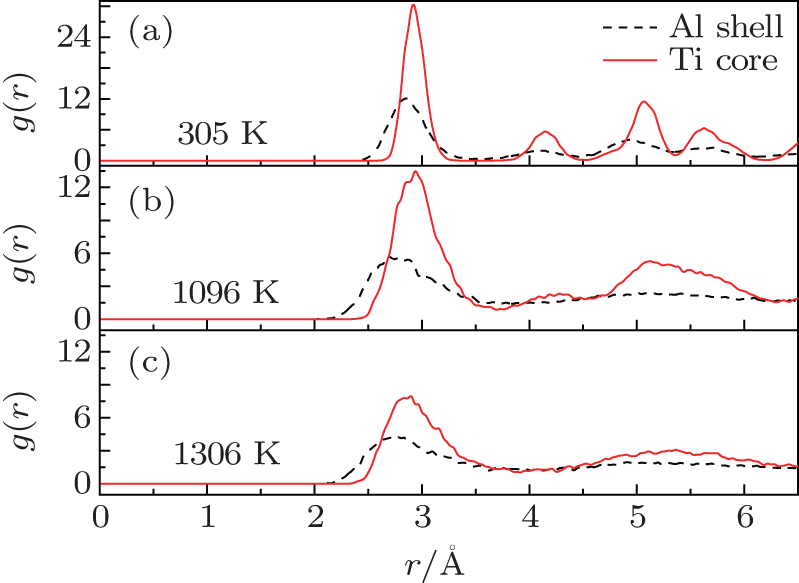
Radial distribution function (RDF) is of importance to the analysis of particle structures and properties. RDF gives the local atomic arrangement and is a tool to distinguish between solids and liquids. The heights of the RDF peaks manifest the local order of structure. While crystalline solids are characterized by a repeating sequence of sharp peaks separated by distances between neighbors, RDF for liquids has few peaks at short distances and no long range order. Here, we use RDF to support above conclusion that the shells melt first and then the cores for core/shell Ti@Al NPs. We calculate the RDF of the core and the shell for Ti@Al core/shell NP2 of 4366 atoms, the results shown in Fig. 4. From the curve, the sharp characteristic peaks can be seen clearly, which shows that the core and the shell keep the FCC structure at 300 K. At 1096 K, the number of the peaks of the core reduced, at the same time, the value of the peaks also drop, indicating that its long-range order become weak, but the FCC structure still remains. To the shell, the first peak of the curve becomes lower and wider, but the other peaks almost disappear totally, these illustrate that the shell loses its long-range order and become liquid. As the temperature rises to 1306 K, to the core and the shell, the value of the first peak is lower than 1096 K, and other peaks disappear, which means that Ti@Al NPs all melt.
Single-particle MD simulations are also conducted on pure Ti NPs to establish a comparative basis for the heating study of the five different NPs. The melting temperature for three different-sized pure Ti NPs is also listed in Table 1. The result shows that strong size-dependent melting temperatures for pure metal NPs are due to the increased fraction of loosely bounded surface atoms at reduced dimension. From Table 1, we also find that the melting point of core/shell structured Ti@Al NPs is remarkably lower than that of corresponding size pure Ti NPs. Evidently, the lowered melting point can be attributed to the influence of Al shell. From Figs. 3 and 4, one can see that the Al shell melts prior to the Ti core. Therefore, it is naturally explained that, after melting of shell, the melted Al atoms motivate those Ti atoms initially located in the outer layer of the core to move more easily, leading to the lower melting temperature of the Ti core, which has been verified by Fig. 3.
3.2. Solidification simulationThe solidification simulation continues after heating the five different Ti@Al NPs. As a representative, NP2 has also been used to exhibit the thermal evolution of Ti@Al NPs under the continuous cooling process.
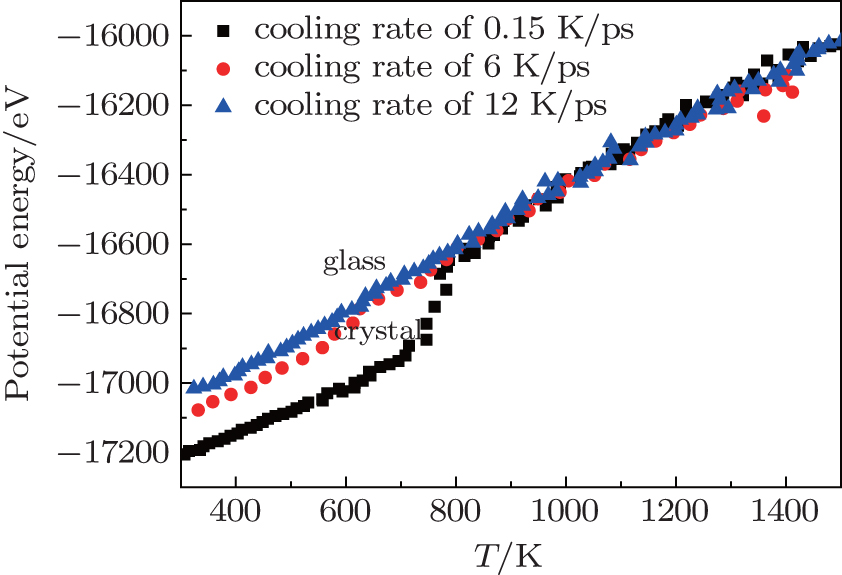
Reference [35] reported that there are some difficulties in the amorphization process of TiAl alloys using the conventional rapid quenching technique. To validate this conclusion, first of all we calculate the potential energies for three cooling rates of NP2, with the results shown in Fig. 5. For the slow cooling rate of 0.15 K/ps, simulation produces an abrupt decrease in the potential energy, around 761 K, which is a clear indication of the formation of crystal structures. The crystallizing phenomenon can be identified by the distinct decrease in the potential energy. In this case, the crystallizing temperature Tc is determined as 761 K. For the cooling rate of 6 K/ps, the abrupt decrease of the potential is also found in Fig. 5, indicating that the crystal structure is formed. References [24] and [29] pointed out that at this cooling rate, a glassy phase has been formed. This supports the conclusion in Ref. [35]. The crystallizing temperature Tc for the cooling rate of 6 K/ps is 612 K, which is different from the cooling rate of 0.15 K/ps. So we conclude that the crystallizing temperature is largely dependent on the cooling rate, which is in good agreement with Ref. [36]. The crystallizing temperature Tc of five different Ti@Al NPs for the cooling rate of 0.15 K/ps is also listed in Table 2. We find that the crystallizing temperature Tc becomes higher with increasing total atom number, which shows a strong size-dependent crystallizing temperature. This result is different from the melting trend, which is a composition-dependent melting temperature. We should point out that the crystallizing temperature is largely dependent on the initial temperature and cooling rate, but the trend observed is reliable in the same condition. For the fast cooling rate of 12 K/ps, the potential energy exhibits a smooth linear decrease with the decrease of temperature, corresponding to a glassy phase formation.
Table 2.
Table 2.
Table 2. Crystallizing temperature Tc, and glass formation temperature Tg for different NPs. .
| Nanoparticles |
Structure |
Component |
Tc/K |
Tg/K |
| Np1 |
Rc = 2 nm, δs = 0.7 nm |
1904 Ti 3662 Al |
882 |
803 |
| NP2 |
Rc = 2 nm, δs = 0.5 nm |
1904 Ti 2462 Al |
761 |
785 |
| NP3 |
Rc = 2 nm, δs = 0.3 nm |
1904 Ti 1280 Al |
694 |
759 |
| NP4 |
Rc = 3 nm, δs = 0.5 nm |
6493 Ti 4710 Al |
901 |
844 |
| NP5 |
Rc = 4 nm, δs = 0.5 nm |
15176 Ti 7866 Al |
973 |
905 |
| Table 2. Crystallizing temperature Tc, and glass formation temperature Tg for different NPs. . |
Here, we calculate RDF to monitor particle structure evolutions during the simulation, as shown in Fig. 6 for two cooling cases. For the fast cooling rate of 12 K/ps, the RDF peaks increase with the decrease of temperature. The whole trend of RDF shows no major changes. This indicates that NP2 is from liquid phase to amorphous solid phase (the glass formation) during fast quenching. An empirical criterion for the onset of amorphous glass is given by Wendt and Abraham.[37] They defined RWA = gmin/gmax, where gmin and gmax denote the magnitude of the first minimum and the first maximum of RDF, respectively. RWA = 0.14 is the threshold value for the onset of the glass phase. On the basis of such a criterion, the calculated glass formation temperature Tg of five different Ti@Al NPs for the cooling rate of 12 K/ps is also listed in Table 2. We can easily see that the glass formation temperature also becomes higher with increasing total atom number. This conclusion also shows a strongly size-dependent glass formation temperature, which has much common with the analysis of the crystallizing temperature. For the slow cooling rate of 0.15 K/ps, RDF reveals features of transition from amorphous liquids to crystalline solids. Figure 5 has shown that the solidification point is clearly identified at 761 K by the abrupt decrease of potential energy. As shown in Fig. 6(b), the first peak becomes bigger and narrower with decreasing temperature, more peaks besides the primary peak start to emerge and grow below 600 K. These phenomena show that the structure of Ti–Al alloy has become more order and is crystal at low temperature (below 600 K). Here the detailed phase evolution during the quench process has been illustrated from the RDF profile. In addition, the calculated enthalpy change of the fast cooling rate of 12 K/ps is relatively lower than at the slow cooling rate of 0.15 K/ps. This reduces the crystallization driving force, thereby increasing the amorphous alloy forming ability. From the RDF profile, it is found that at solidification temperature, the rapid cooling rate makes the Al–Ti internal atomic do not have enough time to crystal and be frozen in the liquid atomic position, so as to form the amorphous structure.
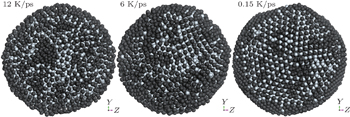
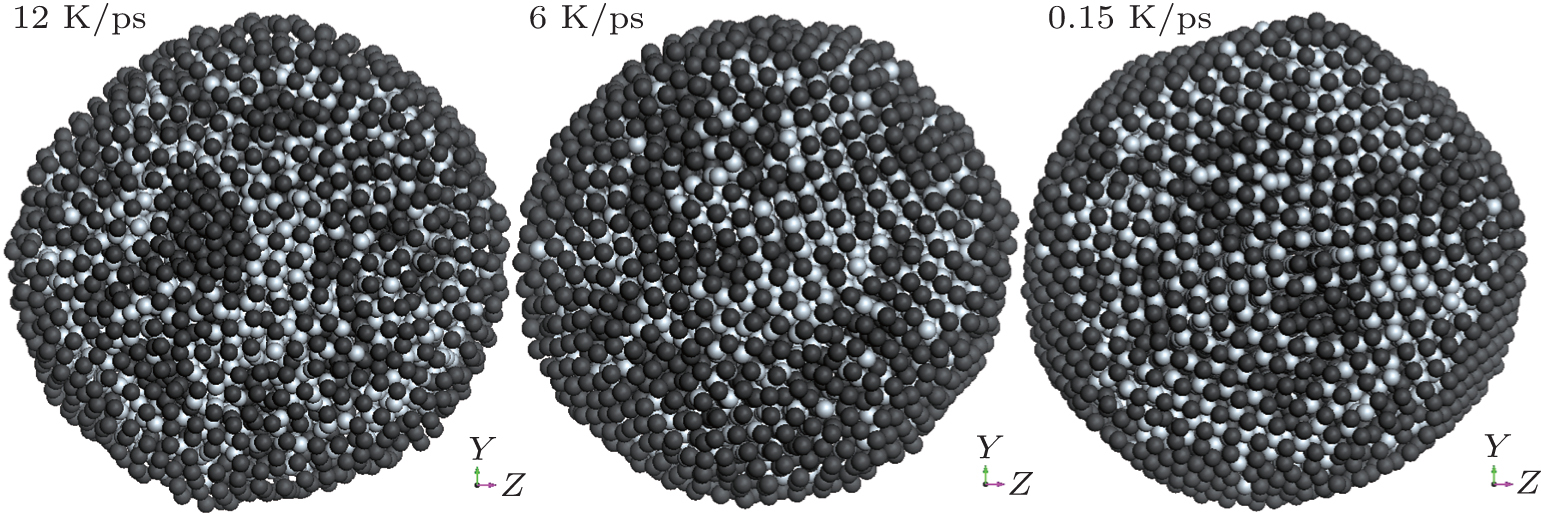
In order to provide intuitive structure of the final quench product under different cooling rates, we present the final snapshot of the quenching as shown in Fig. 7. It is clear from the figure that the structure of the final product is different for three different cooling rates. Under the fast cooling rate of 12 K/ps, the final product is irregular, which shows that the atoms remain disorderly arranged after the solidification. When the cooling rate decreases to 6 K/ps, the final product is found in the crystalline order, but not very regular. We can conclude that the final product is not the glassy phase. For the slow cooling rate of 0.15 K/ps, it is easy to see the existence of crystalline ordering. This conclusion is in excellent agreement with the result discussed in Fig. 5. In Fig. 7, we also find that the icosahedron is formed for NP2 at the slow cooling rate of 0.15 K/ps. This is because the icosahedral structure optimizes the surface energy, so the icosahedral structure is more stable for nanoparticles. Nam et al.[38] have explained why the icosahedral structure is dominantly formed during the freezing of nanoparticles by using MD simulation.


 , Zhang Yang-Yang1, Wang Er-Ping1, Tang Cui-Ming2, Cheng Xin-Lu2, Zhang Qiu-Hui3]