† Corresponding author. E-mail:
Project supported by the National Natural Science Foundation of China (Grant Nos. 71473207, 51178445, and 71103148), the Research Grant Council, Government of Hong Kong, China (Grant No. CityU119011), and the Fundamental Research Funds for the Central Universities, China (Grant Nos. 2682014CX103 and 2682014RC05).
A series of accidents caused by crowds within the last decades evoked a lot of scientific interest in modeling the movement of pedestrian crowds. Based on the discrete element method, a granular dynamic model, in which the human body is simplified as a self-driven sphere, is proposed to simulate the characteristics of crowd flow through an exit. In this model, the repulsive force among people is considered to have an anisotropic feature, and the physical contact force due to body deformation is quantified by the Hertz contact model. The movement of the human body is simulated by applying the second Newton’s law. The crowd flow through an exit at different desired velocities is studied and simulation results indicated that crowd flow exhibits three distinct states, i.e., smooth state, transition state and phase separation state. In the simulation, the clogging phenomenon occurs more easily when the desired velocity is high and the exit may as a result be totally blocked at a desired velocity of 1.6 m/s or above, leading to faster-to-frozen effect.
The evacuation system of buildings provides the last defense line for occupants within a fire emergency. In recent decades, the evacuation becomes more and more challenging for modern buildings, which are characterized by the increases in size, height and occupancy as well as complexity of layout and evacuation routes. Usually, a modern building would accommodate a large number of people. When a huge amount of people gather together, the over-congested crowd substantially reduces the exit flow rate and may trigger potential disasters such as trampling and stampede, which have resulted in many deaths and injuries in previous decades.[1] Building codes in different countries worldwide stipulate the requirements on the design of the egress system, whose performance in a real fire scenario is difficult to assess. The design of an egress system for complex buildings is a formidable task. With the advancement of simulation techniques and the power of computers, researchers have developed dozens of evacuation models, such as Exodus,[2] SGEM,[3] SFF,[4] etc., to evaluate the effectiveness of the escape system or evacuation plan in buildings.
These models can deepen our understanding and may help in preventing accidents due to overcrowding. Thus this research topic has attracted attention from physicists and sociologists in recent years. Generally speaking, pedestrian movement models can be classified into different categories such as macroscopic continuum models,[5,6] force-based models,[7–9] and cellular automaton (CA) models.[10–12] Macroscopic models describe the pedestrian movement at a high level of aggregation as fluid flow,[5,6] which can optimize the overall evacuation network,[13] whilst microscopic models describe the behavior of each individual and their interactions in detail. The movement of people in microscopic models is simplified as a kind of self-driven particle[7,8,14–16] in which the driving force is not external, but from each particle itself. Helbing et al. proposed a pedestrian model to quantitatively explain the behavior of panicked individuals.[7,15,16] They created a generalized force model using Newton’s formula in which force equals pedestrian mass multiplied by its corresponding acceleration. They found “faster is slower effect” in a panicked evacuation. Over several decades, studies specifically looking at panic behavior in fires have consistently shown that non-adaptive and irrational behaviors are actually a rare occurrence.[17–19] After a study of the crowd incident in the love parade on 24th July 2010, in Duisberg, Germany, Helbing et al.[20] concluded that there was no sign of panic in the crowd flow during the incident. A special crowd movement pattern, i.e., crowd turbulence, as found in Ref. [21], would be the cause of the loss of 21 lives in the tragedy. In Refs. [8] and [14], based on suitable video recordings of interactive pedestrian motion and improved tracking software, the authors proposed an evolutionary optimization algorithm to determine optimal parameter specifications for the social force model. The calibrated model is then applied in exploring large-scale pedestrian and evacuation simulations including pilgrimage and urban environments. They found the phenomena of intermittent flows and stop-and-go wave in crowd flow at extremely high densities.[22] Stop-and-go wave is an onset followed by a highly irregular motion of crowd, i.e., the occurrence of crowd turbulence.[20–22] This crowd dynamics is dangerous and it may cause people to fall down. It is noted that the reaction of pedestrians to what happens in front of them is much stronger than to what happens behind them and a centrifugal social force model[23,24] was proposed by taking into account the distance between pedestrians as well as their relative velocities. Recently, researchers modified the social force model and analyzed the faster-is-slower phenomenon by performing animal experiments.[25,26] The social-force model has also been used to investigate the effect of complex building architecture on the uncoordinated crowd motion during urgent evacuation.[27] In particular, how the room door size, the size of the main exit, the desired speed, and the friction coefficient affect the evacuation time and under what circumstances the evacuation efficiency improves.
Discrete element method (DEM) is a numerical method for computing the motion and effect of a large number of particles.[1,28–30] The forces acting on each particle are calculated and force balance is integrated explicitly and acceleration velocity, velocity and the coordinate at each time step is deduced accordingly by applying the second Newton’s law. Normally, soft-sphere is used where particles are allowed to slightly overlap. Lin et al.[1] proposed a granular dynamic method to study the egress pattern of evacuees in a densely populated enclosed space. A DEM-technique-based crowd dynamics model, i.e., CrowdDMX had also been developed by Langston.[31] They further investigated the behavior of subgroups in crowd dynamics.[32] An agent-based algorithm-based DEM algorithm has been incorporated in FDS-Evac[33] and it was further extended to model agents’ behavior in counter-flow situations.[34] However, the faster-is-slower effect, as observed in Helbing’s original social force model, is not reported in the CrowdDMX and FDS-Evac despite both the models having adopted the social force model as a basic model.
The objective of this paper is to study how the desired velocity affects the throughput of the exit by using the discrete element method. The paper is structured as follows. In Section 2, we first introduce the original social force model, then discuss its limitations and lastly make some revisions accordingly. We will detail the formulation of the proposed model based on the theory of granular dynamic. In Section 3, a parametric study will be conducted. The characteristics of crowd flow at different desired velocities and the flow rates out of the exit are then investigated. Section 4 presents the conclusions.
In the original social force model,[7,15,16] the movement of people is quantified by the following equations:


In the social force model, a person receives repulsive forces from all the people around him so as to keep a comfortable distance to these people. That is to say, distance is an important factor in the social force model. However in the centrifugal force model,[23,24] another important factor, the relative velocity was also taken into account. Recently, it was found that the reaction of pedestrians to what happens in front of them is much stronger than what happens behind them.[8] Thus, a so-called anisotropic social force model is proposed in Ref. [32]. In this model,

Furthermore, the contact force within the human body is an important factor to describe the forces within the human body when they are physically contacted. In the original social force model, as implemented in FDS-Evac and CrowdDMX, the human body is assumed to be an elastic object and the contacted forces are represented by Hooke’s law where the compressive force of the human body is linearly dependent on the distance they are pressed. For two spherical particles, the normal push-back force for two overlapping particles is a non-linear function of the overlapped distance but is proportional to the overlapped area as illustrated in the Hertz contact model.[28,30] Therefore, the contact force in the social force model is over-simplified.
In DEM simulation, a granular material is modeled based on a finite number of discrete, semi-rigid spheres interacting by means of contact or non-contact forces, and the translational and rotational motions of every single particle in a considered system are described by Newton’s laws of motion.[37] In situations such as massive crowd evacuation, each individual does whatever he can to escape, e.g., rushing, pushing, or twisting, to get out the exit as quickly as possible. As a result, translational and rotational movements should both be considered. For simplicity, spherical particles used in the present study are limited to represent granular pedestrian system.
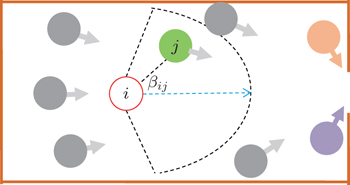
For the translational movement, we assume that the movement of people is restricted in two-dimensional space, xoy, while the position in z direction keeps constant. The basic translational motion equations of the human body are similar to the ones used in social force, as detailed in former sections. We noticed the animal dynamics reported in Ref. [25] and as a consequence assume that the people in front of a person i pose a much higher social impact on him than the persons behind him when there is no physical body contact. That is to say, the social force has an anisotropic feature, as shown in Fig. 

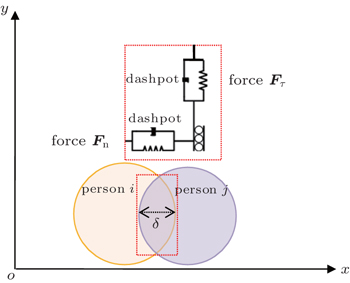
When there is physical body contact, the contact force is an important factor to describe the forces among human bodies. The most used contact model is the Hertz contact model[28] as shown schematically in Fig.


The rotational movement of the human body is restricted in z directions only and the rotations in directions x and y are set to be zero.


The algorithm of translational crowd movement based on the DEM includes the following steps.


Similarly, the rotational crowd movement can also be realized following similar steps by replacing force, location, speed, and acceleration items with moment, orientation, angular speed, and angular acceleration items respectively.
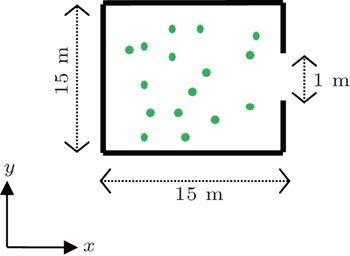
A number of simulations have been performed for the evacuation of people through an exit. The room is 15 m×15 m and has an outlet of 1 m wide as shown in Fig.
| Table 1. Key input parameters in the simulations. . |
First, we simulate an evacuation scenario of 100 people getting out of a 1-m-wide door at a desired velocity (DV) of 1 m/s and simulation results are shown in Fig.
 | Fig. 4. Evacuation process of 100 people getting out of a 1-m-wide door at a desired velocity of 1 m/s. |
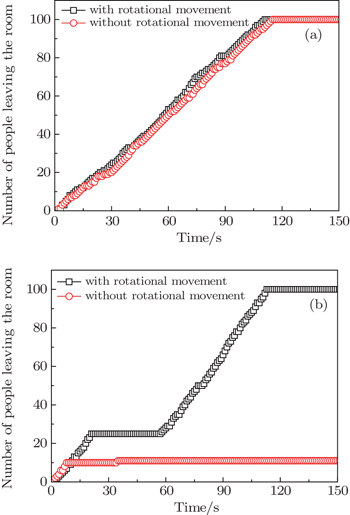
To determine the effect of rotation in the present model, more simulations are conducted by deactivating the rotational Eq. (
The clearance time of the occupants within the room is further studied for scenarios with 200 and 300 persons, which are equivalent to an initial density of 0.88 m−2 and 1.33 m−2, respectively. Other key input parameters are shown in Table
For 200 people in the room, we show in Fig.
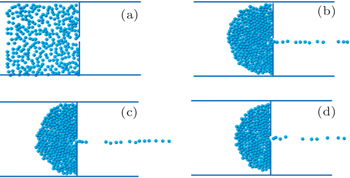 | Fig. 6. Snapshots of the crowd evacuation at the time of (a) 0 s, (b) 30 s, (c) 60 s, and (d) 120 s. |
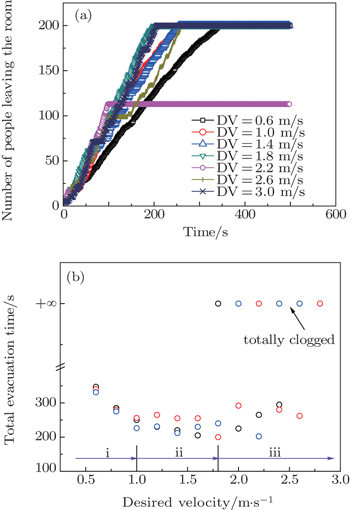 | Fig. 7. The leaving process (a) and clearance time (b) of 200 persons at different desired velocities. In panel (b), different colors mean different runs of the simulation. |
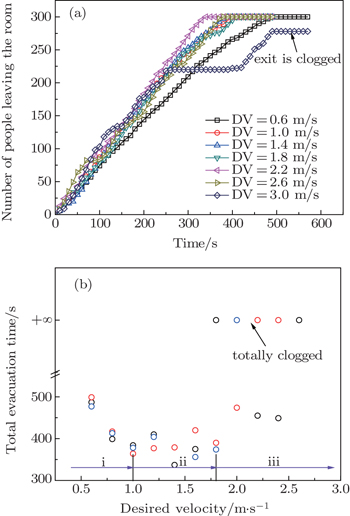
Further study with 300 persons is conducted and the results are shown in Fig.
The exit flow rate is measured at small temporal intervals (10 s) to investigate the flow rate at different desired velocities. Examples of typical results are presented in Fig.
 | Fig. 9. The flow rates of 100 people (a) and 300 people (b) getting out of the exit at different desired velocities. |
In the social force model, we know that a special phenomenon named “faster-is-slower” is observed. The quickest leaving time of 200 persons is around 150 s at a desired velocity of 1.5 m/s and the leaving time increases to 200 s at a desired velocity of 5 m/s.[16] Here, in Fig.
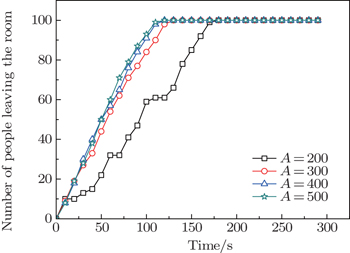
The average flow rate of people getting out of the exit is further investigated with different initial number of people to be evacuated. The results are summarized in Fig.
In the original social force model, the parameters for the social force are questionable and the contact force due to body deformation is over-simplified. Thus in the present study, we built a model for crowd flow through an exit by adopting the theory of granular dynamic. In the proposed model, the human body is treated as a granular particle and the dynamical movement of people is studied by applying the second Newton’s law. The Hertz contact model is incorporated to describe the contact forces on the human body when they are physically contacted. The friction force among particles is also considered, and finally a revised anisotropic discrete element crowd model is formalized. Within this model, the effect of DV was investigated. It was assumed that a larger desired velocity means a higher degree of intention of people wanting to get out of the room. The clearance time and flow rate of people getting out of a room at different desired velocities were investigated. The relationship between the clearance time/flow rate and the desired velocity exhibits three distinct states as follows.
Our simulations show that the clogging phenomenon occurs more easily at the exit if all people still try to get out at a desired velocity irrespective of the net distance/space available. The competitiveness of the crowd cannot improve the flow rate but only adds to its fluctuation and the over-competitiveness of the crowd could lead to the clogging at the exit, i.e., faster-to-frozen effect.
It should be noted that the current model only considers the rotation of the human body due to external contact force. In fact, people are self-driven particles and they can provide internal rotational force so as to twist or rotate their body if they are jammed at the exit. It is believed that the internal rotational force could reduce the clogging possibility. It should also be noticed that in the current model, the evacuation process with only one exit was considered, whilst two or more exits is generally provided in the reality. By introducing a novel potential field such as the one proposed in Refs. [42] and [43], multi-exit evacuation will be further studied in the future.
| 1 | |
| 2 | |
| 3 | |
| 4 | |
| 5 | |
| 6 | |
| 7 | |
| 8 | |
| 9 | |
| 10 | |
| 11 | |
| 12 | |
| 13 | |
| 14 | |
| 15 | |
| 16 | |
| 17 | |
| 18 | |
| 19 | |
| 20 | |
| 21 | |
| 22 | |
| 23 | |
| 24 | |
| 25 | |
| 26 | |
| 27 | |
| 28 | |
| 29 | |
| 30 | |
| 31 | |
| 32 | |
| 33 | |
| 34 | |
| 35 | |
| 36 | |
| 37 | |
| 38 | |
| 39 | |
| 40 | |
| 41 | |
| 42 | |
| 43 |


