† Corresponding author. E-mail:
Project supported by the National Natural Science Foundation of China (Grant Nos. 61101175, 61571305, and 61227802).
A fast and simple method to extract phase-contrast images from interferograms is proposed, and its effectiveness is demonstrated through simulation and experiment. For x-ray differential phase contrast imaging, a strong attenuation signal acts as an overwhelming background intensity that obscures the weak phase signal so that no obvious phase-gradient information is detectable in the raw image. By subtracting one interferogram from another, chosen at particular intervals, the phase signal can be isolated and magnified.
X-ray phase-sensitive technique is an important extension of x-ray radiographic imaging that is widely used in medicine, nondestructive testing, and security. Besides conventional absorption images, phase-sensitive imaging can offer two other images: phase distribution and dark field distribution.[1–4] Various phase-sensitive techniques have been proposed and developed over the past decade.[5–21] Among them, the differential phase contrast (DPC) imaging can be used in a broad range of applications due to its low requirements for source coherence, mechanical stability and detector resolution.[6]
Without specimen, interferograms of phase gratings consist of many regular fringes. An object introduced in the light path distorts the fringes, and the resulting variations in the intensity pattern encode the wavefront phase. The obtaining of the phase distribution of the sample requires a phase retrieval procedure that calculates the phase image from multiple intensity measurements. In the visible light region, Fourier-transform and phase-stepping algorithms are common phase retrieval methods.[8,9] Naturally, those techniques were introduced in DPC imaging system and yielded excellent results[8,10,11] No less than three images are needed for a phase-stepping algorithm; usually, the number of intensity measurements is in a range of 5 ∼ 11.[12] Multiple exposures cause excess exposure time and increased x-ray absorption, which are disadvantageous in medical and biological applications. Bennett et al. proposed a fast and simple algorithm that requires no movement of the grating.[10] However, it requires individual harmonic spectrum, resulting in the loss of high spatial frequency.
In this paper, we deduce the intensity distribution in a detecting plane for a finite-size x-ray source. The formula of intensity shows that the analysis grating parameters and x-ray source spatial coherence have the greatest effects on phase signals. The attenuation signals have more contributions than the phase shift signals in intensity image. Thus, usable phase information requires a map of phase retrieval. We propose a fast and simple method based on the intensity formula to extract the phase-gradient signals from the raw data without losing the high spatial frequency. Relative numerical calculations and experimental results demonstrate our method effectiveness.
We consider a common x-ray interferometer with a finite-size x-ray source as shown in Fig.
The complex transmission function T(x) of G1 can be expressed with a Fourier series as


When a sample is placed just before G1, G1 will split the incident light carrying the complex amplitude of the sample into different diffraction orders. As a consequence, the amplitude transmission function of the sample A(x,y)eiϕ(x,y) is shifted by ns along the x-axis, such that


Assuming that the shearing amount ns is sufficiently small,[5] equations (


According to the van Cittert–Zernike theorem, the intensity distribution of a source will smoothen the interferogram I(x,y;l), so in the detecting plane, the intensity I′(x,y;l) is calculated as[15]


The multi-slit source has periodicity p0 and the slit width α, as illustrated in Fig.
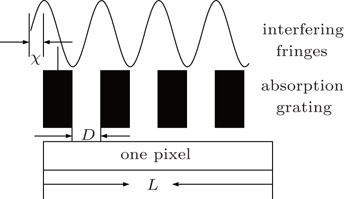
The final intensity distribution on the detector is determined by taking into account the effect of the third grating G2 with periodicity p2. Assuming that G1 and G2 are parallel, the intensity signal detected by one pixel, according to the model in Fig.

The signal I″ would be a very complex expression if we implement Eq. (


Now we can discuss the contributions of A(x,y) and ϕ(x,y) to the intensity signal I″(x,y). The value of γ determines the contribution of A(x,y) and small apertures of G0 and G2 can increase the occupancy rate of ϕ(x,y) in I″(x,y). However, a and D cannot be very small. In general, we choose parameters such that half the incident light passes though G0 and G2, which means that a/p0 = D/p2 = 0.5 and γ ≈ 0.4. Thus, the phase information amplitude only contributes 15% of the measured intensity, and most energy is attributed to the attenuation term Γ(x,y). The phase contrast signals, which provide more structural information, are consequently hard to detect for the attenuation signal.
We estimate the values of ϕ(x,y) and A2(x,y) from the following equations:


If the strong background signal Γ(x,y) can be eliminated from Eq. (


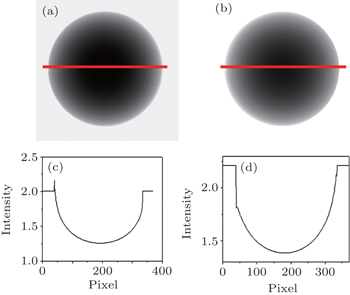
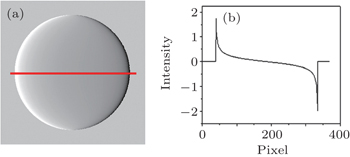
In this section, we show the results of numerical calculations of one carbon ball on the basis of Eqs. (
Figures
A fresh pig foot purchased from a supermarket was imaged using a non-absorption grating imaging system described in Ref. [14]. Two raw data images and a phase gradient image are shown in Figs.
 | Fig. 5. Radiography images: panels (a) and (b) are raw images collected with the phase grating at two different positions. |
The x-ray source is a common x-ray tube with no filter, at a 70-kV acceleration voltage, and with a 2-mA anode current. The distance between sample and detector is 105 mm. The phase grating is made of silicon, has a 5.6-μm period, a 0.5-duty ratio, and a 40-μm depth, corresponding to a π phase shift for 31-keV x-rays. The scintillator is directly coupled with an ANDOR 2048×2048-pixel (13.5 μm/pixel) CCD camera through a fiber optical tape, with 2× demagnification.
We present intensity formulae for x-ray Talbot interferometry with a partial spatial coherent source. On the basis of these formulae, we find that the structural parameters of the source and analyzer gratings greatly affect the phase-gradient signal intensity. For G0 and G2, a larger aperture in one periodicity dramatically reduces the amplitude of phase information to the extent that the phase-gradient image is difficult to detect in raw data. We propose a simple approach to extracting the phase image from raw signals and demonstrate its effectiveness through numeral calculation and experiment. Compared with the existing stepping methods using no less than three interferograms, our method is simpler and much faster.
| 1 | |
| 2 | |
| 3 | |
| 4 | |
| 5 | |
| 6 | |
| 7 | |
| 8 | |
| 9 | |
| 10 | |
| 11 | |
| 12 | |
| 13 | |
| 14 | |
| 15 | |
| 16 | |
| 17 | |
| 18 | |
| 19 | |
| 20 | |
| 21 |


