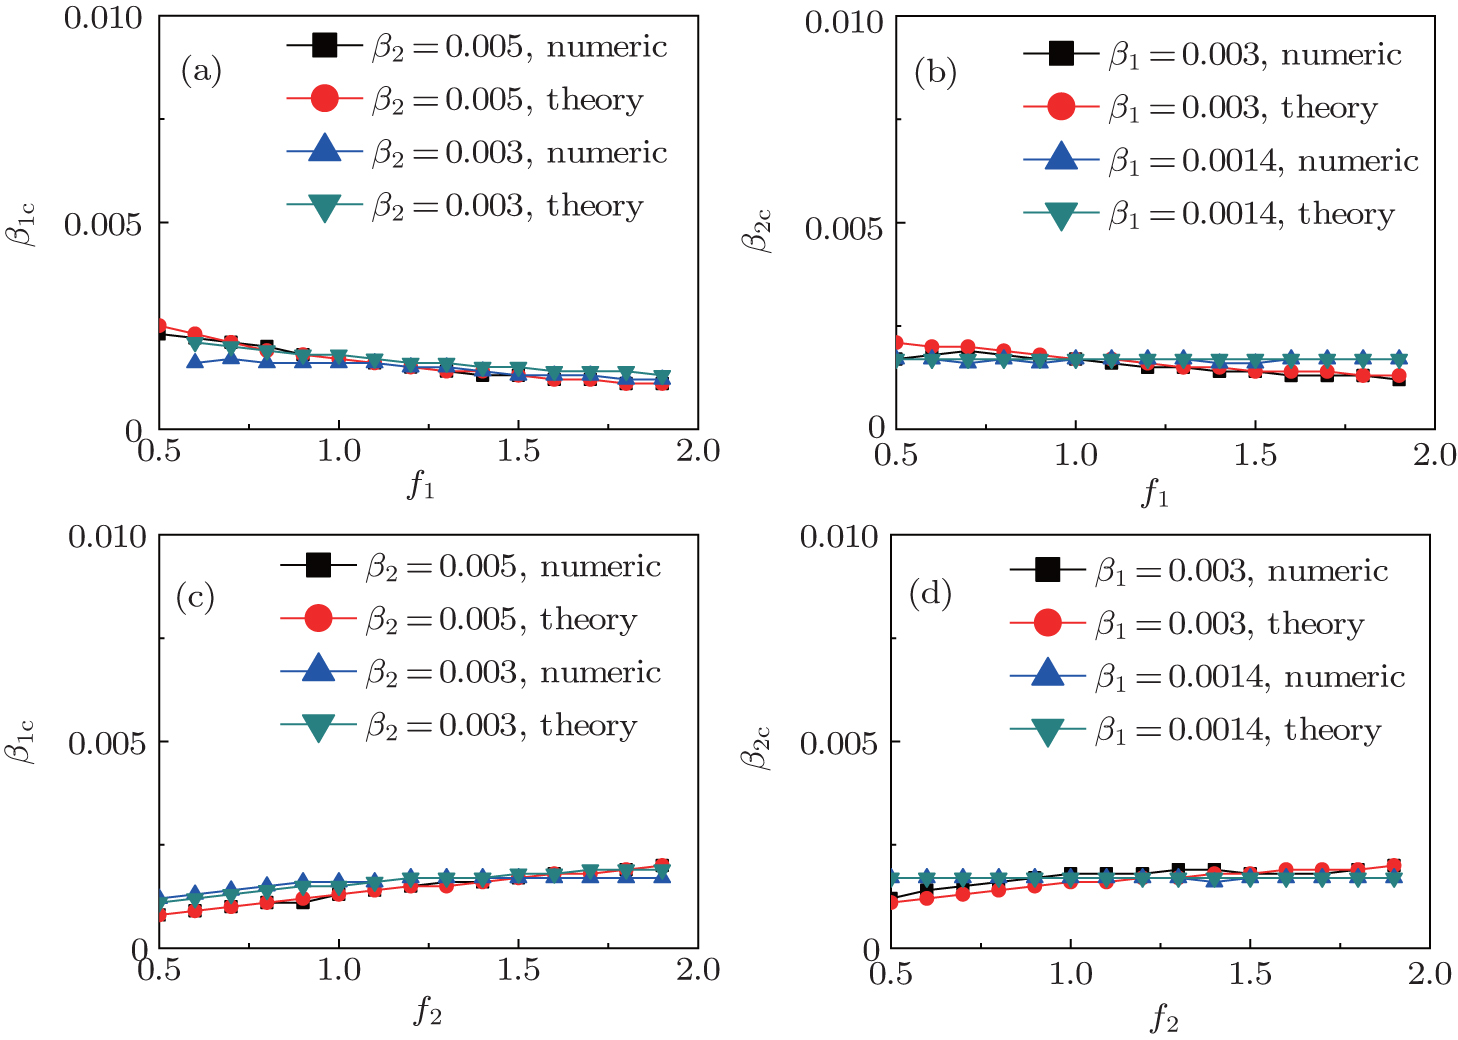
Influence of f1 and f2 on the epidemic thresholds β1c and β2c with fixed p = 0.005, where the “squares” and “uptriangles” represent the numerical simulations and “circles” and “downtriangles” represent the corresponding theoretical results from Eqs. (2)–(5). (a) β1c versus f1 with f2 = 1, where the “squares” and “uptriangles” represent the cases of β2 = 0.005 and 0.003, respectively. (b) β2c versus f1 with f2 = 1, where the “squares” and “uptriangles” represent the cases of β1 = 0.003 and 0.0014, respectively. (c) β1c versus f2 with f1 = 1, where the “squares” and “uptriangles” represent the cases of β2 = 0.005 and 0.003, respectively. (d) β2c versus f2 with f1 = 1, where the “squares” and “uptriangles” represent the cases of β1 = 0.003 and 0.0014, respectively. The results are averaged over 1000 realizations. |

