Effects of Ni doping on the structural properties and collapse of magnetic ordering in NdFe1−xNix O3 (0.1 ≤ x ≤ 0.7) orthoferrites
[Ahmad I.1, 2, Akhtar M. J.2, †,  , Siddique M.2]
, Siddique M.2]
|
|


† Corresponding author. E-mail:
NdFe1−x NixO3 (0.1 ≤ x ≤ 0.7) orthoferrites are synthesized by solid state reaction method, and the structural properties of these materials are investigated by employing x-ray diffraction (XRD), scanning electron microscopy (SEM) and Mössbauer spectroscopy. The orthorhombic structure is observed in all systems; however, with the increase in Ni doping, the increase in tolerance factor and the decrease in the cell volume are observed. Orthorhombic distortion decreases with Ni content increasing up to 50%, while above 50% Ni doping it increases. SEM examination indicates the increases in grain size and intermixing of grains with increase in Ni concentration. Comparison between bulk and theoretical densities shows that in each of all samples porosity is less than 2%. Mössbauer spectroscopic investigations are performed to explain local structure, Fe oxidation states and collapse of the magnetic ordering. In these samples the Fe oxidation state remains +3 and there is no considerable increase in hole states observed; however due to mismatch of the ionic radii between Fe3+ and Ni3+, octahedral distortions, sagging and distribution of hyperfine parameters increase with increase in Ni concentration. The major factors behind the collapse of magnetic ordering in the Ni-doped systems are the weakening of the super-exchange interactions, decrease in the Neel temperature, increase in spin–spin relaxation frequency and high spin to low spin transition.
The perovskite-based ceramic oxides are well known due to their excellent oxidation resistances, chemical stabilities, structural, electrical, magnetic, and mechanical properties. Owing to these properties oxide-based ceramics are widely used in numerous areas.[1–3] RFe1−xBxO3 orthoferrites (where R denotes a rare earth ion and B a transition metal ion such as Ni, Co, Mn, Cr) are one of the most studied classes of perovskites. Doping at B-sites affects the physical properties with change in their ionic radii, oxidation states and spin states which play a key role in determining the structural, electronic and magnetic properties.[3–6]
The structure of NdFeO3 is orthorombically distorted derivative of cubic perovskites with Pbnm symmetry. The crystallographic unit cell of NdFe1−xNixFeO3 can be visualized as three-dimensional (3D) tilted, slightly deformed and corner sharing FeO6 octahedron while the A-site cations (Nd3+) are dodecahedrally coordinated by 12 O2− ions and fit in the cavities comprised of eight FeO6/NiO6 octahedra. The Neel temperature of NdFeO3 is 760 K which decreases with the increase in nickel content. Each Fe ion is coupled by superexchange interaction with six nearest Fe ions, resulting in antiferromagnetic ordering while weak ferromagnetism is observed due to canting of spins.[5–9]
Strong interactions among localized moments, magnetic ordering, itinerant electrons, and spin canting, normally result in the interesting phenomenon in these materials. Owing to these factors, the ABO3 type perovskite materials exhibit huge variations in properties; which are observed due to the changes in oxidation and spin states, local structural, and chemical factors, difference in band gap, octahedral tilting, cations displacements, colossal polarizeability (with electronic, ionic, and dipolar polarization mechanisms) and relaxer like properties. These perovskites are widely studied both theoretically and experimentally due to very broad range of electrical properties from insulators to superconductors, metal to insulator transitions, magnetic properties, magneto-resistive properties, electrochemical and catalytic properties. Owing to these properties transition metal oxides have become important materials for several high-tech applications such as solid oxide fuels cells, gas sensors, catalysis, spin valves, magnetic field sensors, magnetic sensors, electro-magnets, spintronic devices, oxygen permeable membranes, environmental monitoring applications, random access memory devices based on capacitive components, miniaturization of device sizes, multilayer ceramic capacitors, dielectric substrates, thermoelectric power conversion microwave components for communication systems, etc.[10–20]
When Ni is doped at the Fe sites in orthoferrites, a transition from insulating to metallic state is observed. The difference in ionic radius between Fe3+ and Ni3+ produces structural distortions. According to the rigid band model, the Fe3+ ions have more localized states as compared with the Ni3+ ions, thus the nickel doping in orthoferrites increases the concentration and delocalization of charge carriers.[5,21,22] The RNiO3-type nickelates are paramagnetic metallic oxides due to the presence of Ni3+ in low spin state with its eg electrons having no localized moments. The t2g band of these systems is completely filled and conduction band is created by the hybridization of the Ni3+ eg orbitals and O2− 2p orbitals.[23] In NdFeO3 the Fe ions are in high spin state. The Ni doping in this system can increase oxidation state of the iron ions only if the nickel ions are present in mixed oxidation states (+2 and +3) and oxygen stoichiometry of the system is also maintained which may result in an increase in hole state. Idrees et al. have observed increase in hole states and presence of Fe4+ with the increase in Ni concentration in LaFe1−xNixO3.[24,25] Makhdoomi et al.[26] have reported the transition of Fe3+ ions from high spin to low spin in PrFe1−xNixO3 orthoferrite system with the increase in Ni concentration. Fe, Co and Ni are neighbors in the periodic table and NdFeO3, NdCoO3, and NdNiO3 crystallize in the same crystal structure; however, NdFeO3 is an insulator, NdCoO3 is a semiconductor and NdNiO3 shows a metallic behavior.[7] The metallic or insulating behaviors of these materials dependon the extent of distortion from ideal cubic perovskite structure and on B–O–B bond angle.[5] Rao et al.[27] studied the LaNi1−xFexO3 system and found that the itinerancy raises with the increase in the nickel concentration. They also observed that the increase in covalent character of B–O bond results in itinerant behavior of perovskite oxide, with B-site cation in the low spin state. Furthermore, the charge carriers of ABO3 oxide having higher ionic character of B–O bond will be localized and in this case the B-site cations will be in the high spin state.
In NdFe1−xNixO3 system both Fe and Ni are magnetic 3d transitions metals, and show magnetic ordering below TN which is ∼ 700 K for NdFeO3 and ∼ 200 K for NdNiO3. The exchange interaction between B-site ion and Nd ions can be divided into isotropic and anisotropic components. The isotropic exchange is canceled by compensating for contributions from anti-parallel moments. However, the anisotropic exchange is not completely compensated for, which results in the appearance of internal field HNd–B and polarizes the Nd sub-lattice at lower temperatures both in NdFeO3 and NdNiO3. Magnetic vacancies are introduced into the Fe sub-lattices when iron ions are substituted by non-magnetic ions. This results in the dilution of the Fe sub-lattices which stimulates the lowering of Neel temperature till quenching of magnetic ordering.[28]
Tin oxide and zinc oxide are widely studied materials as gas sensors but these materials have poor stabilities and selectivities which restricted their usefulness as gas sensing materials. Doped and undoped perovskite oxides are other types of materials which are extensively studied as gas sensors due to superior selectivity. Zhang et al.[29] have studied the CO gas sensing properties of NdFe1−xCoxO3 system and observed that NdFeO3 has very good response as CO gas sensor.
In this work NdFe1−xNixO3 orthoferrites are synthesized by solid state reaction method and characterized by XRD, pycnometer, SEM and Mössbauer spectroscopy.
Polycrystalline NdFe1−xNixO3, (where x = 0.1, 0.2, 0.3, 0.4, 0.5, 0.6, and 0.7), samples were synthesized in air by a conventional solid state reaction method, using high purity (99.99%) Nd2O3, NiO and Fe2O3 obtained from Sigma Aldrich. To obtain a homogenous mixture, stoichiometric quantities of all the chemicals were mixed in highpurity acetone followed by grinding. Appropriate measures were taken to ensure that starting materials are moisture free, by preheating at 100 °C for 2 h before weighing. The mixtures of oxides were heated at 1000 °C, 1100 °C, and 1200 °C for 16 h at each temperature with intermediate grinding. After this heat treatment, circular pellets of 10-mm diameter and ∼ 1.5-mm thicknesses were fabricated from the ground powder under a pressure of 3 tons/inch2 (1 ton = 1.01605 t, 1 inch = 2.54 cm). These pellets were finally sintered at 1300 °C for 16 h. Heating rate was maintained at 5 °C/min during sintering at each temperature, while all samples were cooled in closed off furnace. The phase purity of each sintered pellet was confirmed by x-ray diffraction (XRD) using Cu Kα radiation (1.5418 Å). The room temperature XRD data were collected for 20° ≤ 2θ ≤ 70° with 0.02° scanning step size and 3 s per step counting time. In order to calculate the lattice parameters, least square fitting technique was used. Densities of these sintered pallets were measured using pycnometer. SEM analyses of all these samples were performed using SEM LEO 440i. For SEM analysis each sintered pallet was fractured perpendicularly to the circular plane and analyses of these fractured samples were carried out. Fe57 Mössbauer spectra were taken at room temperature in transmission mode using the Co57 in Rh matrix as a source of γ-rays. For the calibration of Mössbauer spectrometer, a thin α -Fe foil was used. MOS-90 computer program was used to analyze the Mössbauer data; where analysis was performed on the assumption that all peaks are Lorentzian in shape.
Figure
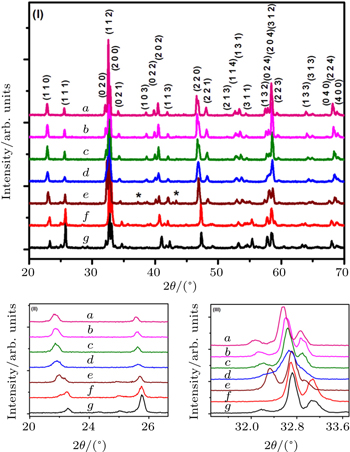
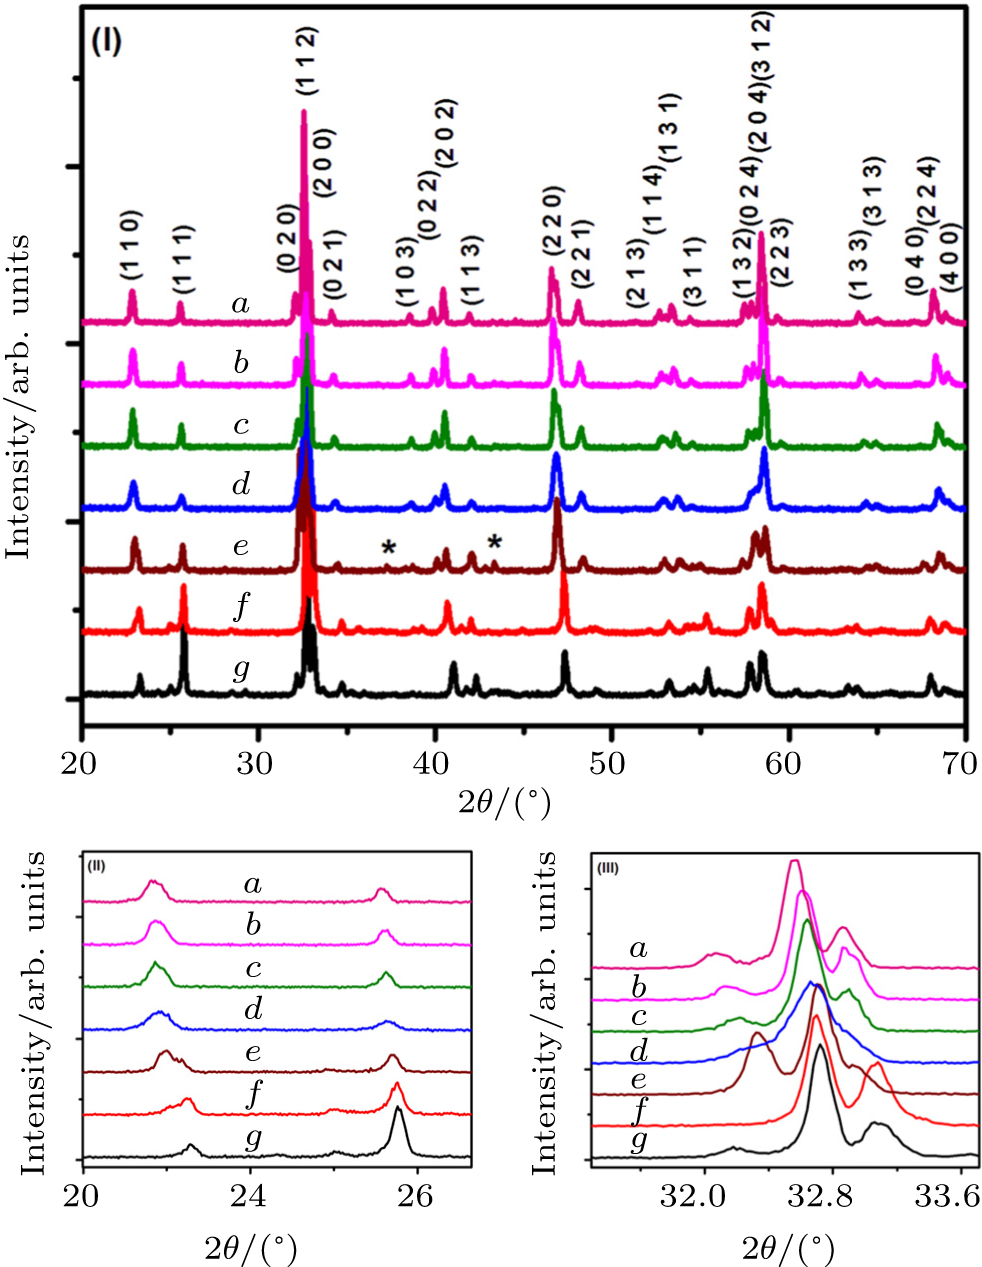 | Fig. 1. XRD patterns of (curve a) NdFe0.9Ni0.1O3, (curve b) NdFe0.8Ni0.2O3, (curve c) NdFe0.7Ni0.3O3, (curve d) NdFe0.6Ni0.4O3, (curve e) NdFe0.5Ni0.5O3, (curve f) NdFe0.4Ni0.6O3, and (curve g) NdFe0.3Ni0.7O3 collected at room temperature. Symbol * indicates peaks due to a minor tetragonal Nd4Ni3O8 phase. |
| Table 1. Phase symmetry, cell parameters a, b, and c, and cell volumes of NdFe1−xNixO3. . |
In Table
| Table 2. Calculations of Goldsmith tolerance factor, orthorhombic distortion parameter, XRD density, bulk density, and calculated porosity of NdFe1−xNixO3 samples. . |
For the calculation of tolerance factors the ionic sizes are cited from Ref. [33] by Shannon. It is evident from these results that the values of Goldsmith tolerance factor (t) increase slightly with the increase in Ni.
The orthorhombic distortion parameter (D), which is a measure of deviation of unit cell from ideal cubic structure and is represented by the following formula:[34]
In this formula, α1 = a, α2 = b, 

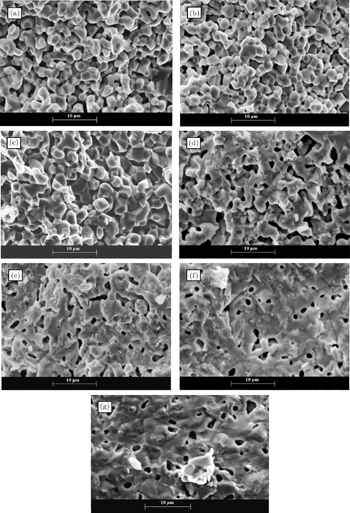
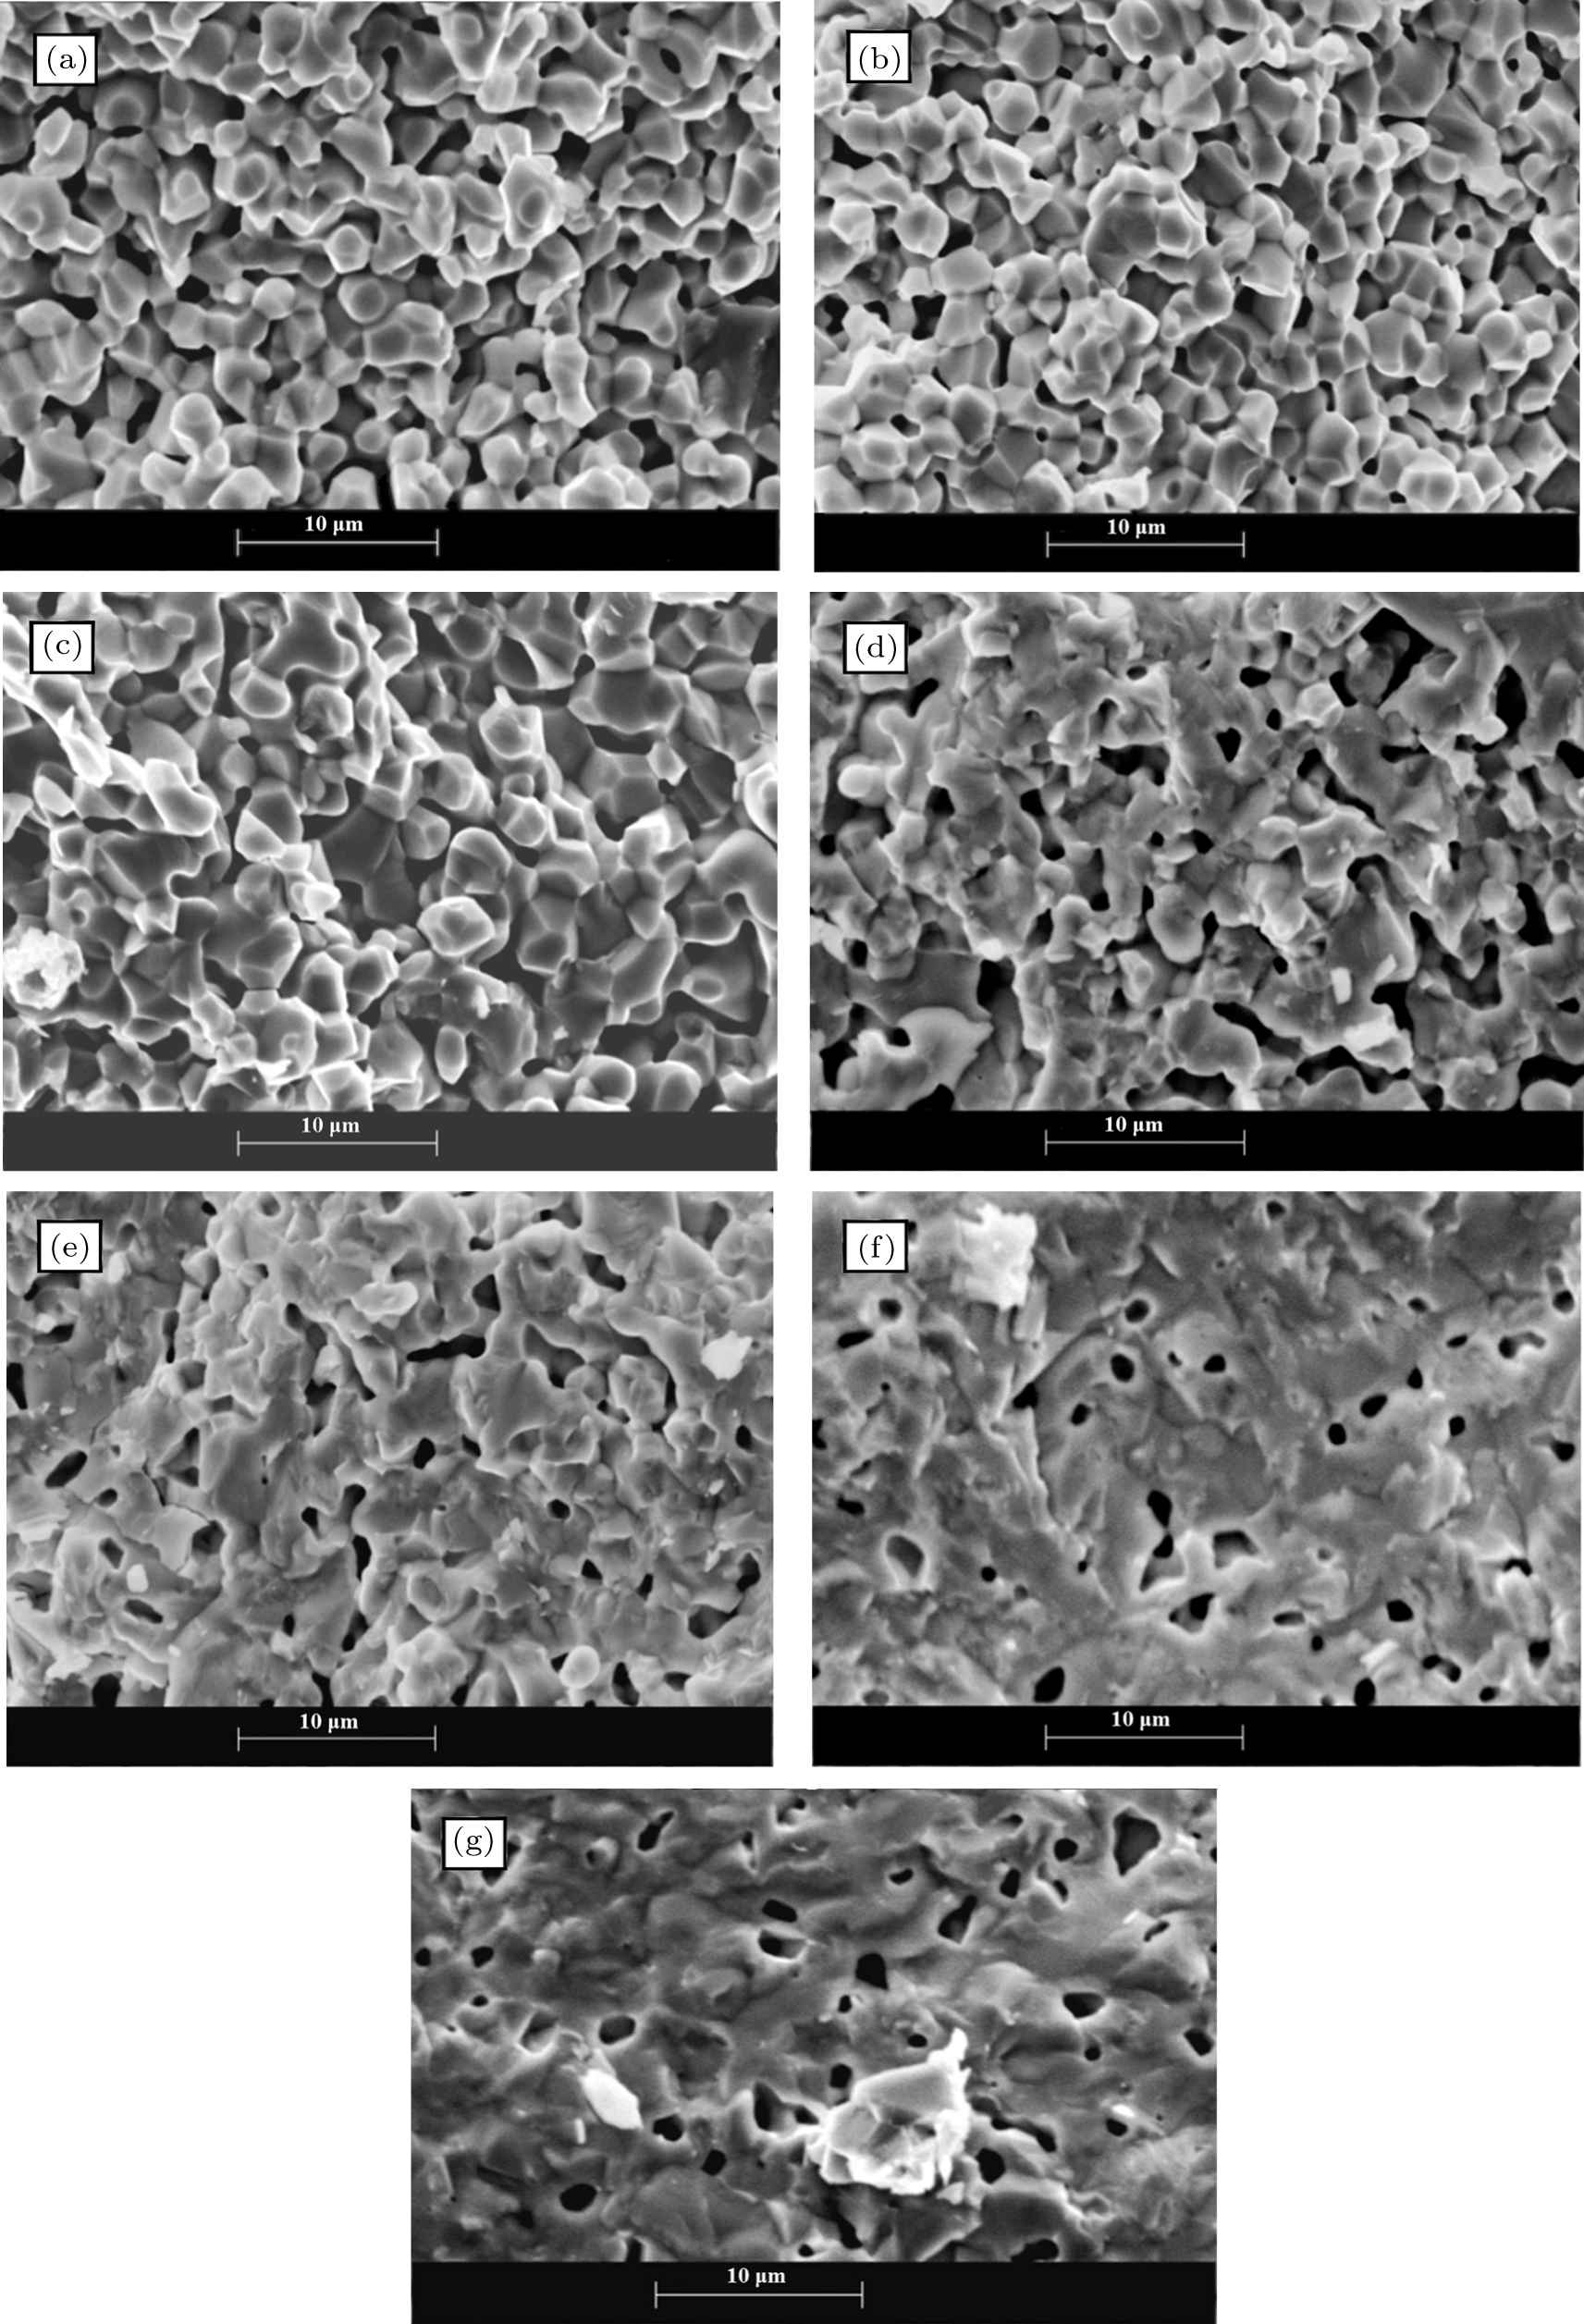 | Fig. 2. SEM micrographs (at 3000× magnification) taken from the fractured surfaces of the sintered pellets of (a) NdFe0.9Ni0.1O3, (b) NdFe0.8Ni0.2O3, (c) NdFe0.7Ni0.3O3, (d) NdFe0.6Ni0.4O3, (e) NdFe0.5Ni0.5O3, (f) NdFe0.4Ni0.6O3, and (g) NdFe0.3Ni0.7O3. |
The density of the material is an important parameter; the bulk density must be above ninety percent of the theoretical density for the determination of electrical and thermal properties.[35] The bulk density of each of NdFe1−xNixO3 samples is measured using pycnometer while the theoretical density is calculated from the following equation:


The results of theoretical density (dth), bulk density (d) and calculated porosity (P) are also shown in Table
In order to investigate the effects of nickel doping on the particle size, porosity, grain connectivity and grain boundary, we have carried out scanning electron microscopy (SEM). The SEM micrographs of the NdFe1−xNixO3 pellets (fractured face) sintered at 1300 °C are shown in Figs.
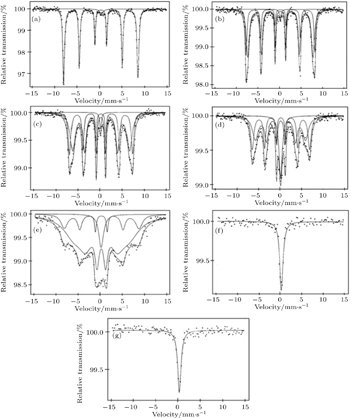
The effects of Ni doping on the local environment of Fe sites in NdFe1−xNixO3 (0.1 ≤ x ≤ 0.7) are investigated by Mössbauer spectroscopy to explore the roles of Ni doping in the oxidation state of Fe, octahedral distortions and the change in the strength of magnetic ordering. The Mössbauer spectra of NdFe1−xNixO3 (0.1 ≤ x ≤ 0.7) samples are shown in Fig.
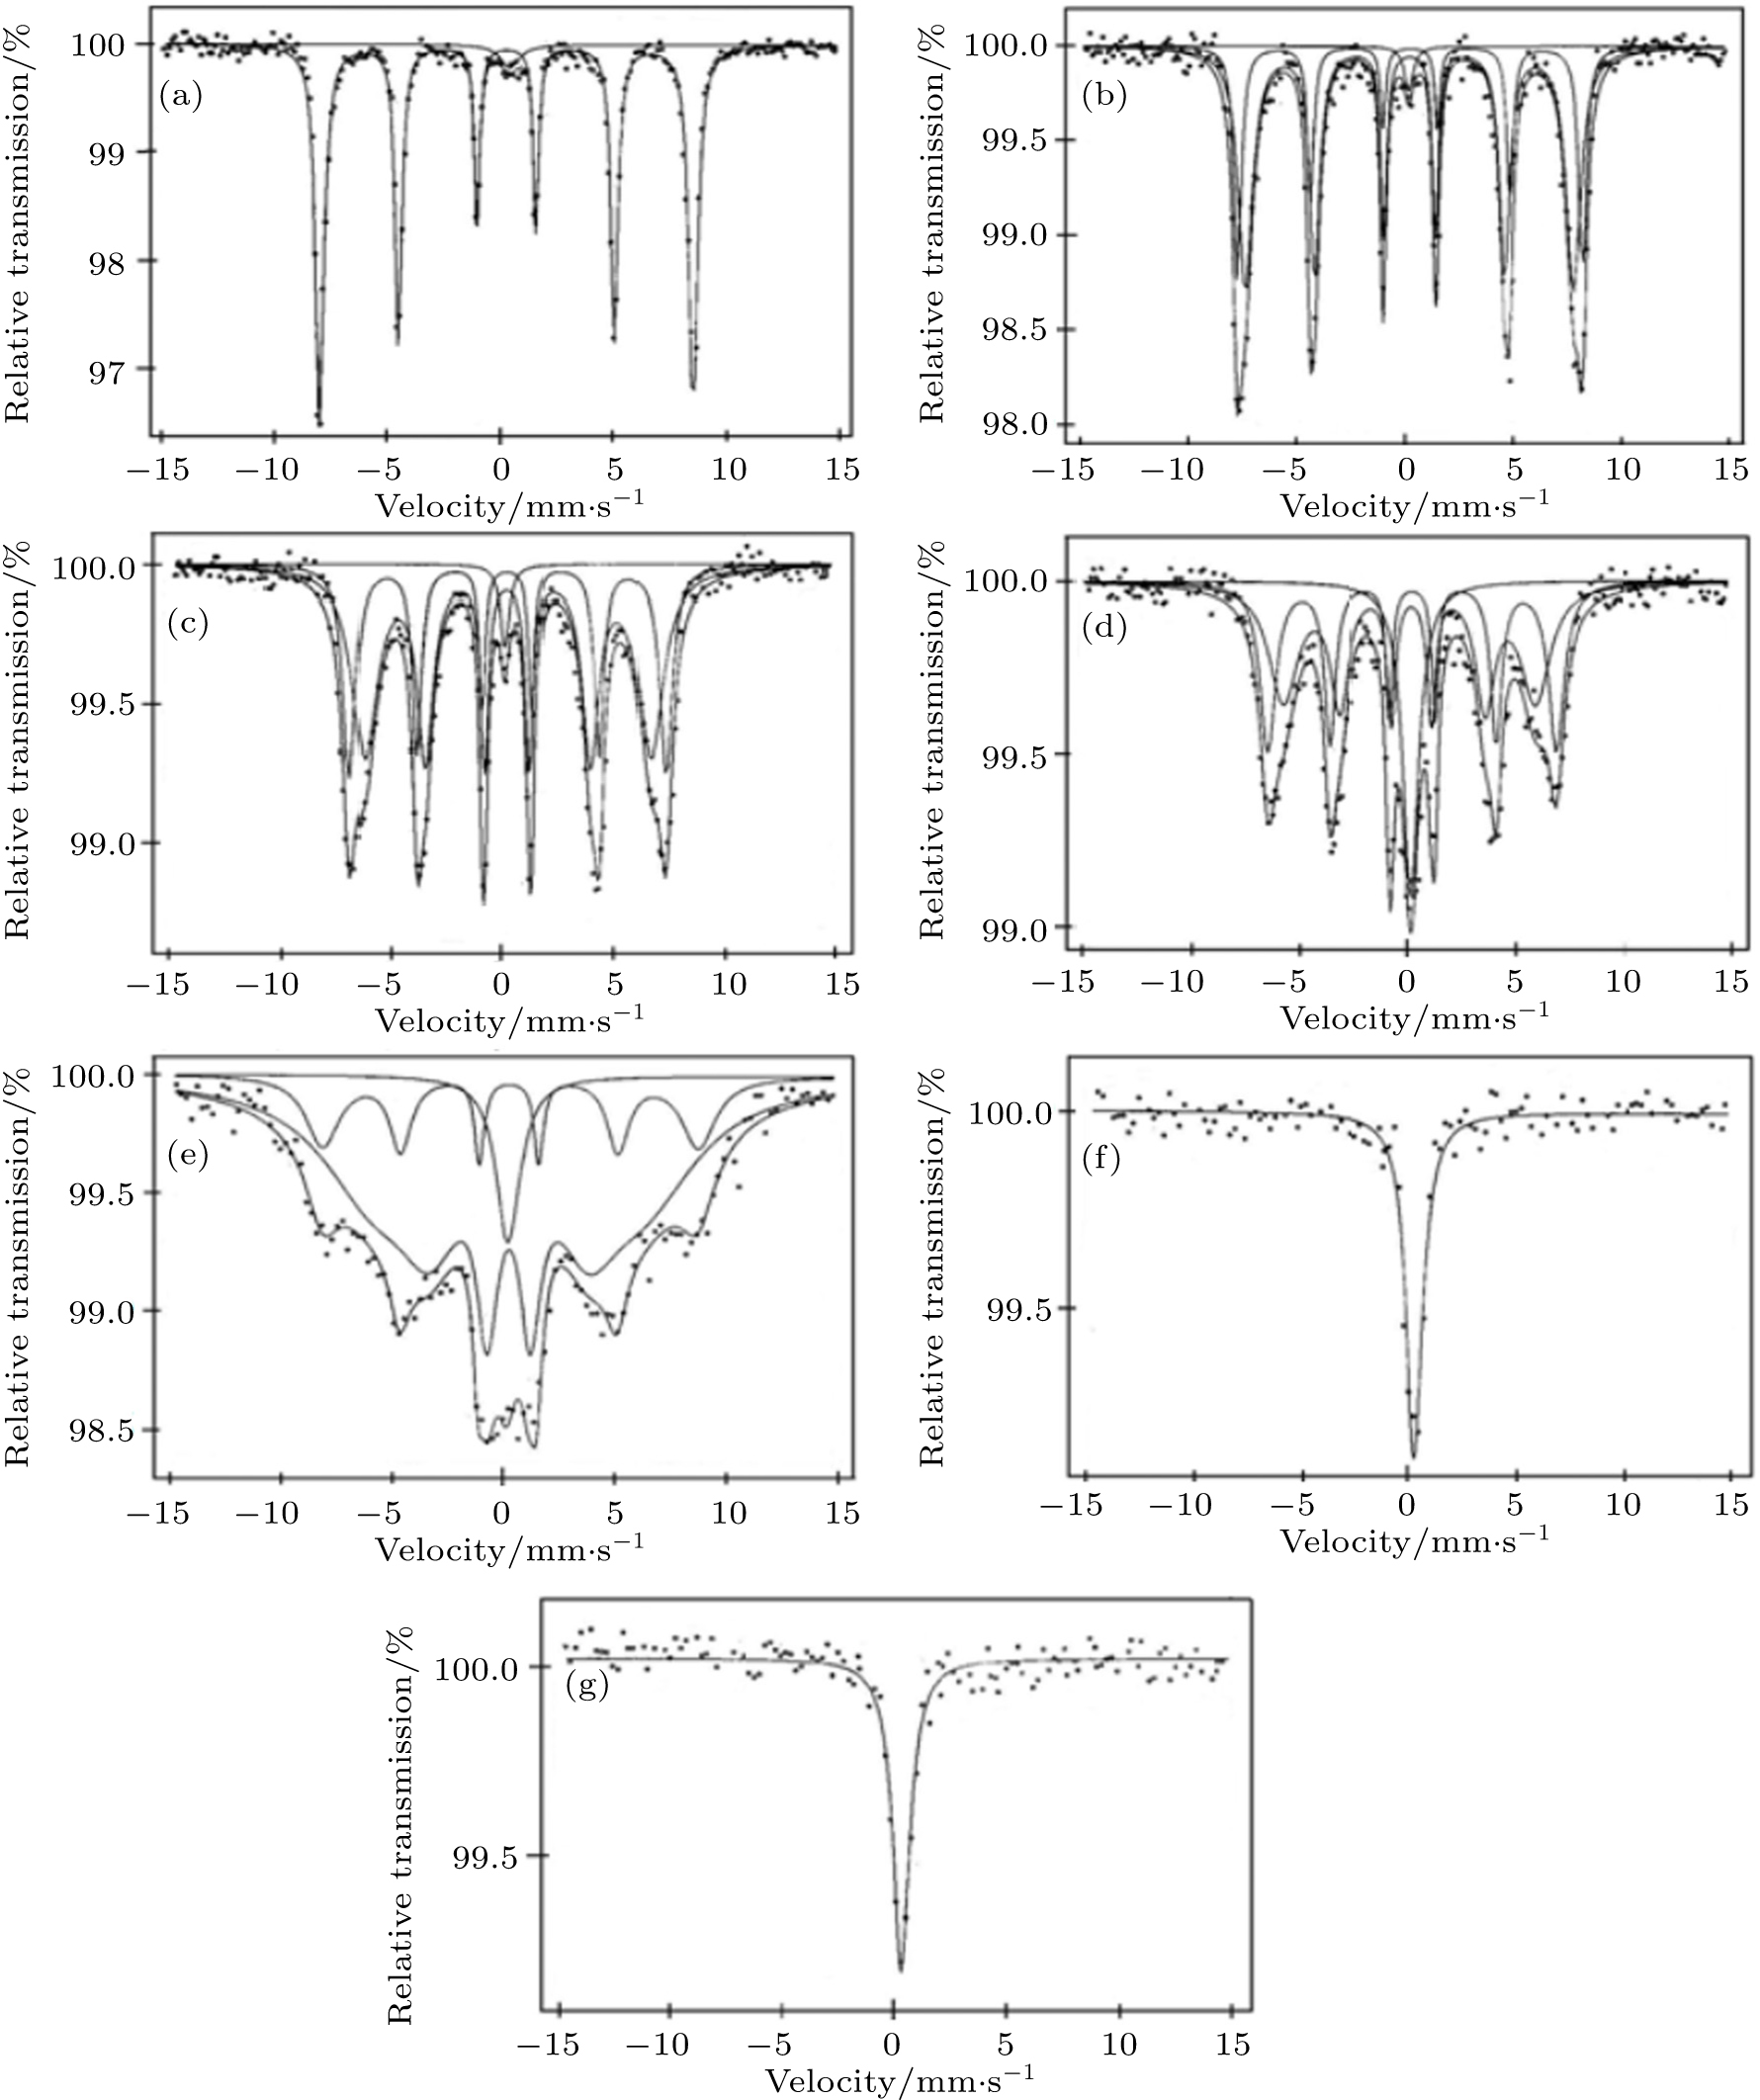 | Fig. 3. The room temperature Mössbauer spectra of (a) NdFe0.9Ni0.1O3, (b) NdFe0.8Ni0.2O3, (c) NdFe0.7Ni0.3O3, (d) NdFe0.6Ni0.4O3, (e) NdFe0.5Ni0.5O3, (f) NdFe0.4Ni0.6O3, and (g) NdFe0.3Ni0.7O3. |
The Mösbasuer spectra of NdFe1−xNixO3 (0.2 ≤ x ≤ 0.5) are shown in Figs.
| Table 3. Values of magnetic hyperfine field (HB), isomer shift (IS), quadrupole splitting (Δ), line width (Γ), and relative area (%) associated with each spectral feature in 57Fe Mössbauer spectra of NdFe1−xNixO3. The unit 1 Oe = 79.5775 A·m−1. . |
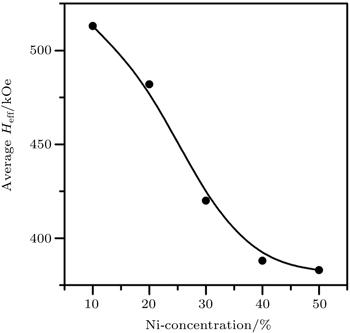
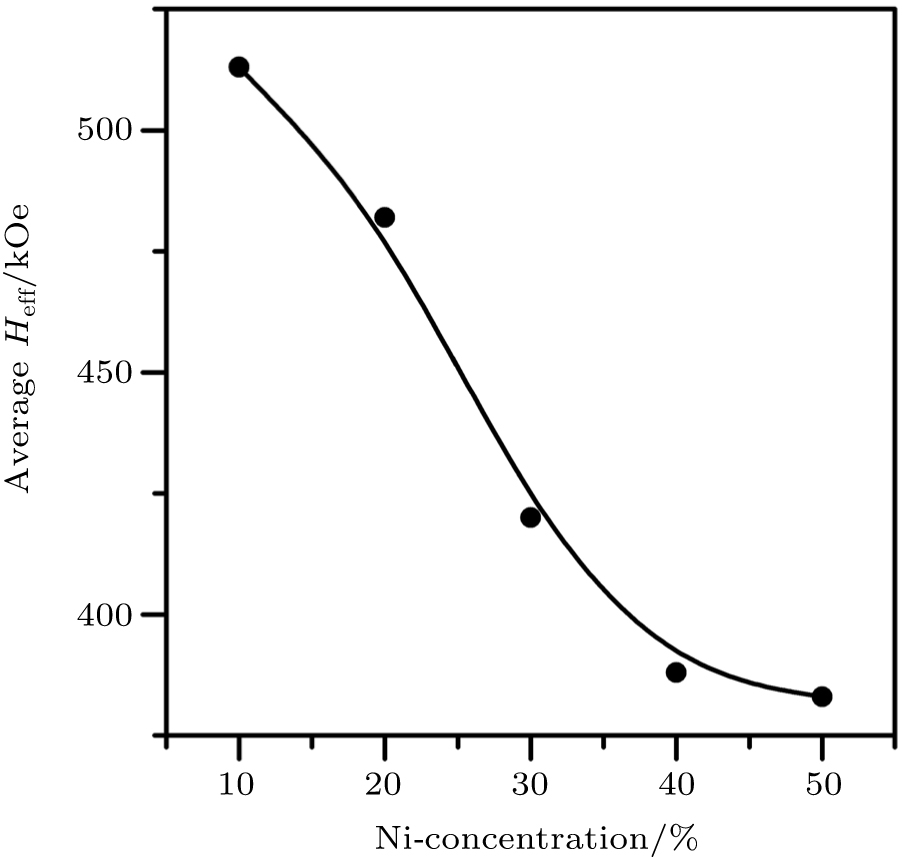 | Fig. 4. Variation of average internal magnetic field with Ni concentration in NdF1−xNixO3. |
The Mösbasuer spectra of NdFe1−xNixO3 (0.6 ≤ x ≤ 0.7) are shown in Figs.
As observed by the Mössbauer spectra and broadening or sagging of the magnetically split lines, a progressive collapse of magnetic ordering is observed with the increase in Ni concentration of NdFe1−xNixO3 (0.1 ≤ x ≤ 0.7). It is interesting to note that the collapse of magnetic ordering is also observed in other Ni-doped LaFeO3, PrFeO3, and NdFeO3 orthoferrite systems.[4,37–39]
Makhdoomi et al.[38] observed that in PrFe1−xNixO3 system when octahedral distortions around Fe3+ increase, it results in the increase in crystal field splitting energy which becomes higher than average spin pairing energy of electrons. Consequently, due to the spin crossover the high spin configuration of Fe3+ (with 5 unpaired spins) is converted into low spin (with only one unpaired spin) one. But the observed magnetic field values for up to 50% Ni samples are higher than the expected field due to low spin of Fe3+ with 5 t2g and zero eg electrons in the valence shell. Thus up to 50% Ni concentration samples, Fe is not converted into low spin configuration while in higher doped samples it may be the case.
In the case of LaFe1−xNixO3 system, Marzec[39] explained the transition from a magnetically ordered state to a spin disordered state by a spin–spin relaxation phenomenon which becomes faster than the characteristic Mössbauer experiment time window with Ni doping. The increase in spin–spin relaxation frequency with temperature can account for the temperature-dependent sagging of the sextet and collapse of the magnetically order state above Neel temperature into orthoferrites.[37–40] With the increase in nickel concentration, a progressive increase in itinerant behavior is observed and results in less localized electron spins. Consequently, the spin relaxation becomes easier which results in the progressive collapse of the magnetically ordered state into spin disordered state. Asai and Sekizawa[41] also established that in these materials progressive sagging of sextet increases with the decrease in characteristic relaxation time constant.
The strength of the super-exchange interaction in orthoferrites depends upon the nature of B-site cation and the B–O–B bond angle. Thus the collapse of magnetic ordering, sagging behavior and decrease in Neel temperature can also be correlated with the weakening of super-exchange interactions. As a result of doping, the Fe3+–O2−–Fe3+ interactions in NdFeO3 become Fe3+–O2−–Fe3+, Fe3+–O27−–Ni3+, and Ni3+–O2−–Ni3+ interactions in NdFe1 −xNixO3 (0.1 ≤ x ≤ 0.7). The super-exchange angle also changes which leads to a decrease in super-exchange interactions with the increase in Ni content. It is inferred that all above factors contribute to the collapse of magnetic ordering with the increase of Ni concentration in NdFe1−xNixO3.
In the present study polycrystalline NdFe1−xNixO3 (0.1 ≤ x ≤ 0.7) orthoferrites are synthesized by a solid state reaction method. From the XRD results it is found that the orthorhombic structure is retained in each of all samples; however, by increasing the Ni concentration, tolerance factor increases while cell volume decreases. The orthorhombic distortion is found to decrease with Ni concentration increasing up to 50%, while above 50% Ni doping it starts to increase. The calculated porosity value in these systems are all below 2%. From SEM results it is found that when the concentration of nickel is low, the grains have more regular shapes and with the increase in Ni concentration grain connectivity grain size gradually increases. From these results it is also inferred that the intermixing grains increase with the increase in Ni concentration. The pores size differs from area to area and sample to sample but mostly their sizes are all less than 1 μm. Mössbauer spectroscopic results indicate that the oxidation state Fe ion is Fe+3 for each of all samples. The increase in distribution of hyperfine parameters and the decrease in magnetic ordering with the increase in nickel concentration are also observed. The major factors behind the collapse of magnetic ordering in this orthoferrite system may be the weakening of superexchange interactions, the transition from high spin to low spin and the increase in spin–spin relaxation frequency due to the increase in the delocalization of charge carriers.
| 1 | |
| 2 | |
| 3 | |
| 4 | |
| 5 | |
| 6 | |
| 7 | |
| 8 | |
| 9 | |
| 10 | |
| 11 | |
| 12 | |
| 13 | |
| 14 | |
| 15 | |
| 16 | |
| 17 | |
| 18 | |
| 19 | |
| 20 | |
| 21 | |
| 22 | |
| 23 | |
| 24 | |
| 25 | |
| 26 | |
| 27 | |
| 28 | |
| 29 | |
| 30 | |
| 31 | |
| 32 | |
| 33 | |
| 34 | |
| 35 | |
| 36 | |
| 37 | |
| 38 | |
| 39 | |
| 40 | |
| 41 |