

Wind tunnel experiments on flow separation control of an Unmanned Air Vehicle by nanosecond discharge plasma aerodynamic actuation
[Chen Kang1, Liang Hua2, 3, †,  ]
]
]
|
|


† Corresponding author. E-mail:
Project supported by the National Natural Science Foundation of China (Grant Nos. 61503302, 51207169, and 51276197), the China Postdoctoral Science Foundation (Grant No. 2014M562446), and the Natural Science Foundation of Shaanxi Province, China (Grant No. 2015JM1001).
Plasma flow control (PFC) is a new kind of active flow control technology, which can improve the aerodynamic performances of aircrafts remarkably. The flow separation control of an unmanned air vehicle (UAV) by nanosecond discharge plasma aerodynamic actuation (NDPAA) is investigated experimentally in this paper. Experimental results show that the applied voltages for both the nanosecond discharge and the millisecond discharge are nearly the same, but the current for nanosecond discharge (30 A) is much bigger than that for millisecond discharge (0.1 A). The flow field induced by the NDPAA is similar to a shock wave upward, and has a maximal velocity of less than 0.5 m/s. Fast heating effect for nanosecond discharge induces shock waves in the quiescent air. The lasting time of the shock waves is about 80 μs and its spread velocity is nearly 380 m/s. By using the NDPAA, the flow separation on the suction side of the UAV can be totally suppressed and the critical stall angle of attack increases from 20° to 27° with a maximal lift coefficient increment of 11.24%. The flow separation can be suppressed when the discharge voltage is larger than the threshold value, and the optimum operation frequency for the NDPAA is the one which makes the Strouhal number equal one. The NDPAA is more effective than the millisecond discharge plasma aerodynamic actuation (MDPAA) in boundary layer flow control. The main mechanism for nanosecond discharge is shock effect. Shock effect is more effective in flow control than momentum effect in high speed flow control.
Lift enhancement and drag reduction continues to be a perpetual requirement for aircrafts. There are various technologies which can enhance the performances of aircrafts. Active flow control (AFC) is considered to be one of the most promising technologies. AFC can expand the flight envelope of aircrafts, improve their aerodynamic performances, and also broaden the design dimension from the constraints of traditional aerodynamic control methods remarkably. Plasma flow control (PFC) is a newly emerged active flow control technique. The PFC has many distinct advantages such as its low weight and size, no need of complex mechanical components, wide operation frequency range, and relatively low power consumption.
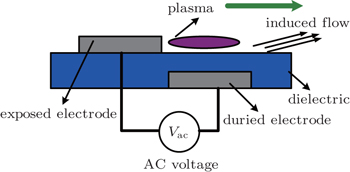
Surface dielectric barrier discharge (SDBD) is a most widely used method to produce plasma aerodynamic actuation in PFC.[1] Figure
 | Fig. 1. Typical sketch map of plasma aerodynamic actuator. |
A lot of work focusing on plasma flow control has appeared in recent years. The plasma actuator has been used in many areas, such as separation control on airfoils,[4–9] jet mixing intensification,[10] laminar and turbulent flow transition control,[11] flow separation suppression for turbine blades,[12] dynamic stall vortex control of oscillating airfoils,[13] plasma slats and flaps for aircrafts,[14] lift enhancement on airfoils,[15] cavity tones control,[16] and boundary layer acceleration.[17] In most early studies, the waveform of the voltage supplied to the electrodes was AC sine wave, and the discharge was on a timescale of milliseconds which is called millisecond surface dielectric barrier discharge (MSDBD). Research on nanosecond surface dielectric barrier discharge (NSDBD) used in flow control has been a newly-rising focus since 2005.[15]
The nanosecond discharge was first used for plasma flow control by Opaits et al. in 2005.[15] The effectiveness for nanosecond discharge used for flow separation control was shown in a velocity range from 20 m/s to 75 m/s. A numerical model based on streamer propagation was proposed to explain the effect of flow acceleration by plasma actuators. The high efficiency of nanosecond pulsed discharge was shown in a velocity range from 20 m/s to 110 m/s.[12] The latest study showed that nanosecond pulsed discharges result in fast (1 μs) thermalization.[10] The fast thermalization induces shock waves and secondary vortex which can disturb the main flow. The disturbance causes an efficient transversal momentum to transfer to the boundary layer and further flow attachment to the airfoil surface in a very wide velocity range (M = 0.03–0.75) and a Reynolds number range (Re = 104–2× 10⁶). The surface dielectric barrier discharges were used to delay flow separation behind a bluff body in atmospheric pressure air.[18] It was found that at an identical discharge power, the AC discharge showed higher ability of flow alteration than the nanosecond pulse discharge. The DBD plasma actuators driven by repetitive nanosecond pulses added to low frequency bias voltage were studied, and parametric results of plasma-induced thrust versus voltage profile parameters were presented.[19,20] The results of the thrust measurements are in agreement with tuft flow visualization results obtained earlier, indicating that dielectric surface charge plays a major role in the thrust. Direct measurements of the dielectric surface potential and its dynamics show that charge builds up at the dielectric surface and extends far downstream of the plasma. The electrical parameters such as applied voltage, discharge current, and transported charge for nanosecond discharge were investigated.[21,22] It was concluded that the discharge current pulse includes two current spikes during the discharge. The first spike results from the discharge propagation in the form of wave ionization and displacement current. The second current spike is due to the repeated re-ignition of the surface dielectric barrier discharge on the area covered previously by the wave ionization. A three-electrode geometry actuator driven by a nanosecond sliding discharge was studied.[23] The three-electrode geometry actuator can extend the length up to the electrode gap. The deposited energy can be increased greatly. The pressure wave due to the surrounding gas heating was studied. This new three-electrode geometry actuator may intensify the flow control ability obviously. It has been demonstrated that the nanosecond discharge could be used in some areas, such as the corner separation control of compressor cascade,[24] stall margin extension in an axial compressor,[25] oblique shock wave control,[26–28] and flow separation control for two-dimensional airfoil.[29,30]
Great progress has been made in nanosecond discharge plasma flow control. In the present work we show that NSDBD can control the flow separation effectively and MSDBD. But the research objects in previous work are mainly two-dimensional airfoils, and the freestream is less than 30 m/s. The mechanism of nanosecond discharge plasma flow control is not clear yet. In the present paper, the flow separation control of a three-dimensional UAV model by NDPAA is studied experimentally. The effects of various discharge parameters on the aerodynamic characteristics are investigated systematically. The paper aims to evaluate the performance of NSDBD on UAVs for providing lift enhancement control and increase the control effectiveness by optimizing the actuator parameters such as pulse frequency and supplied voltage.
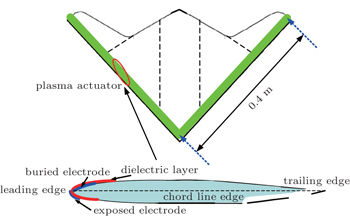
The test model used in a wind tunnel for the present paper was a UAV with a 47° leading edge sweep. The UAV model used in the paper was originally designed by the U.S. Army. The sketch map of the UAV model used for wind tunnel experiments is shown in Fig.
 | Fig. 2. Schematic diagram of the UAV model used for wind tunnel experiments. |
The plasma aerodynamic actuator contained two 0.018-mm thick copper tape electrodes separated by three layers of 0.065-mm-thick Kapton film. The Kapton film will be destroyed when the discharge voltage is strong enough. Each Kapton layer can withstand a voltage of 6 kV in the experiment. The width of the exposed electrode was 3 mm and the width of the buried electrode was 5 mm. The lengths of the electrodes were both 0.4 m. The electrodes were arranged just asymmetrically. The exposed electrode was positioned on the lower side of the UAV model near the leading edge. The buried electrode was positioned on the upper side near the leading edge. There was no overlap distance between exposed and buried electrode. The exposed and buried electrodes were arranged in the chordwise direction. A schematic map of the plasma actuator arrangement is shown in Fig.
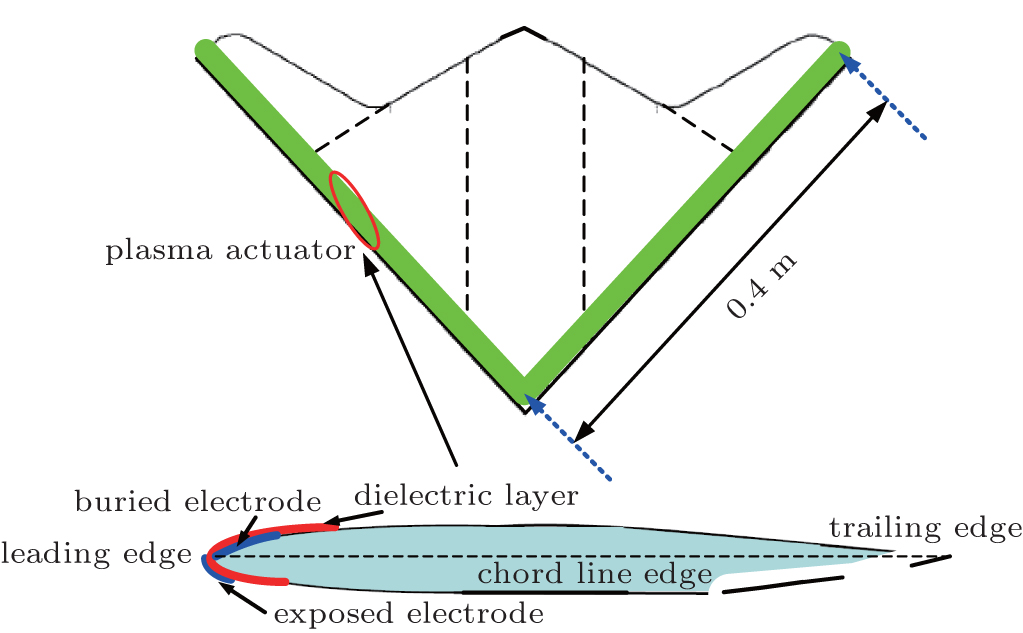 | Fig. 3. Schematic map of the plasma actuator arrangement on the UAV. |
Two different power supplies were used in the wind tunnel experiments. The first one is millisecond discharge power supply with a high-amplitude AC output voltage from 0 kV to 30 kV. The basic frequency is from 6 kHz to 30 kHz. The basic frequency was fixed at 22 kHz in the paper. The discharge pulse frequency and the duty cycle were from 1 Hz to 10 kHz and from 1% to 99% respectively. More detailed information about the millisecond discharge power supply can be seen in Ref. [31]. Another one is nanosecond discharge power supply with an output voltage from 0 kV to 80 kV and a pulse frequency from 1 Hz to 5 kHz. The rise time of the voltage waveform is from 10 ns to 30 ns and the half width is from 50 ns to 300 ns for the nanosecond power supply.
The experiments were conducted in an open-return subsonic wind tunnel at Aerodynamics Research Institute of Aviation Industry Corporation of China. The wind tunnel has a circular test section with 1.5-m diameter and 1.95-m length, with freestream velocity ranging from 0 m/s to 53 m/s. The turbulence level of the wind tunnel is less than 0.5% at test speeds above 53 m/s. The accuracy of the freestream velocity measurement of the test section is 0.01 m/s. The angles of attack in our wind tunnel tests range from −5° to 35°. The wind tunnel blockage effect of the UAV model is less than 3% at an angle of attack of 35°. The freestream velocity is from 20 m/s to 50 m/s and the corresponding Reynolds number is from 2.48× 10⁵ to 6.21× 10⁵ based on the mean aerodynamic chord length of 0.22 m.
The tested UAV model was fastened on the support sting of a six dimension force balance on the wind tunnel. The support sting was in the middle of the test section. The force balance could measure the lift coefficient and drag coefficient and moment coefficient of the UAV model. It was mounted on the bottom of the test section. The six dimension force balance was driven by a stepper motor to different angles of attack. The uncertainty of the angle of attack was less than 0.002°. The force balance was calibrated with the UAV model fixed before the wind tunnel experiments and the maximal measurements uncertainty of the force balance was 0.1% in lift coefficient and 0.6% in drag coefficient. The UAV model fastened in the test section of the wind tunnel is shown in Fig.
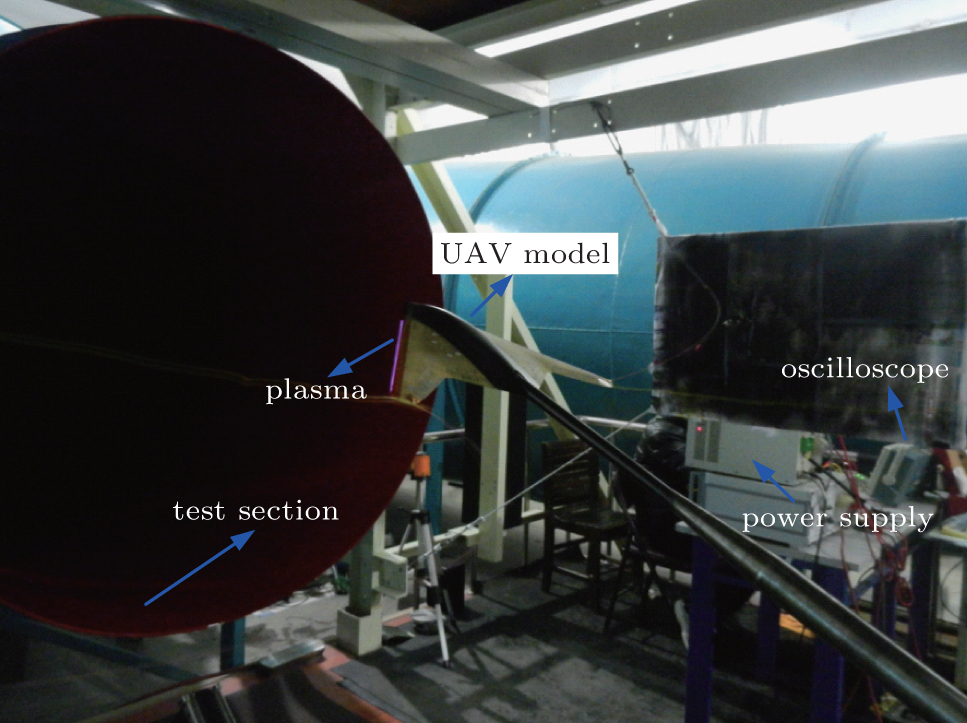 | Fig. 4. Pictures of the UAV model fastened in the test section of the wind tunnel. |
The applied voltage and the discharge current were captured by a high voltage probe (Tektronix P6015A) and a current probe (Tektronix TCP312 + TCPA300) respectively. Voltage and current signals were recorded by an oscilloscope (Tektronix DPO4104).
The velocity and vorticity induced by the plasma aerodynamic actuation were measured by Particle Image Velocimetry (Lavision). A high repetition double pulsed Nd:YAG laser (135 mJ/pulse) was used as a light source. The interval of the laser pulse was 120 ns. The repetition rate of each laser was 5 kHz. The resolution of the camera was 1600 pix × 1200 pix. The air was seeded by vaporization of mineral oil with a mean size of about 0.3 μm. The flow characteristics of nanosecond discharge plasma aerodynamic actuation were measured.
The shock waves generated by the nanosecond discharge were measured by high speed schlieren technique. The schlieren system consists of light source and concave mirrors and CCD camera (PCO-dimax). The high-speed CCD camera was used to capture the instantaneous shock waves with a framing rate of 35714.3 Hz. The first pulse of the discharge current signal was selected as a trigger signal. The trigger signal was inputted into a synchronization controller DG535. Then the CCD camera began to record the occurrence and development of the shock wave induced by nanosecond discharge.
Nanosecond discharges can result in intense electromagnetic interference which will affect the function of measurement instruments such as force balances, CCD cameras, and pressure sensors. Some methods were adopted to eliminate the effects of the electromagnetic interference on the measurement instruments. All measurement instruments were connected to the ground wire. The nanosecond power supply was seeded by the uninterruptible power system. The signal wires of the wind tunnel were separated by the shielded cells. The UAV model was made of glass fiber reinforced plastics which can insulate the plasma aerodynamic actuator and the force balance. Test results show that the effects of electromagnetic interference were completely eliminated by taking these measures.
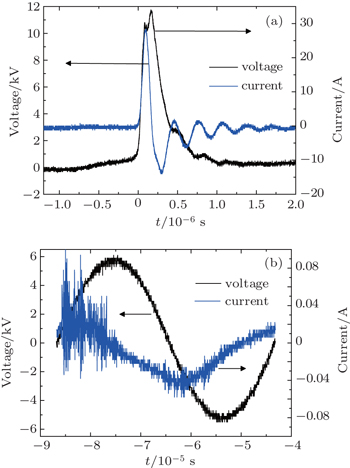
The plots of the applied voltage and the discharge current versus time for MDPAA and NDPAA are shown in Fig.
We can see from Fig.
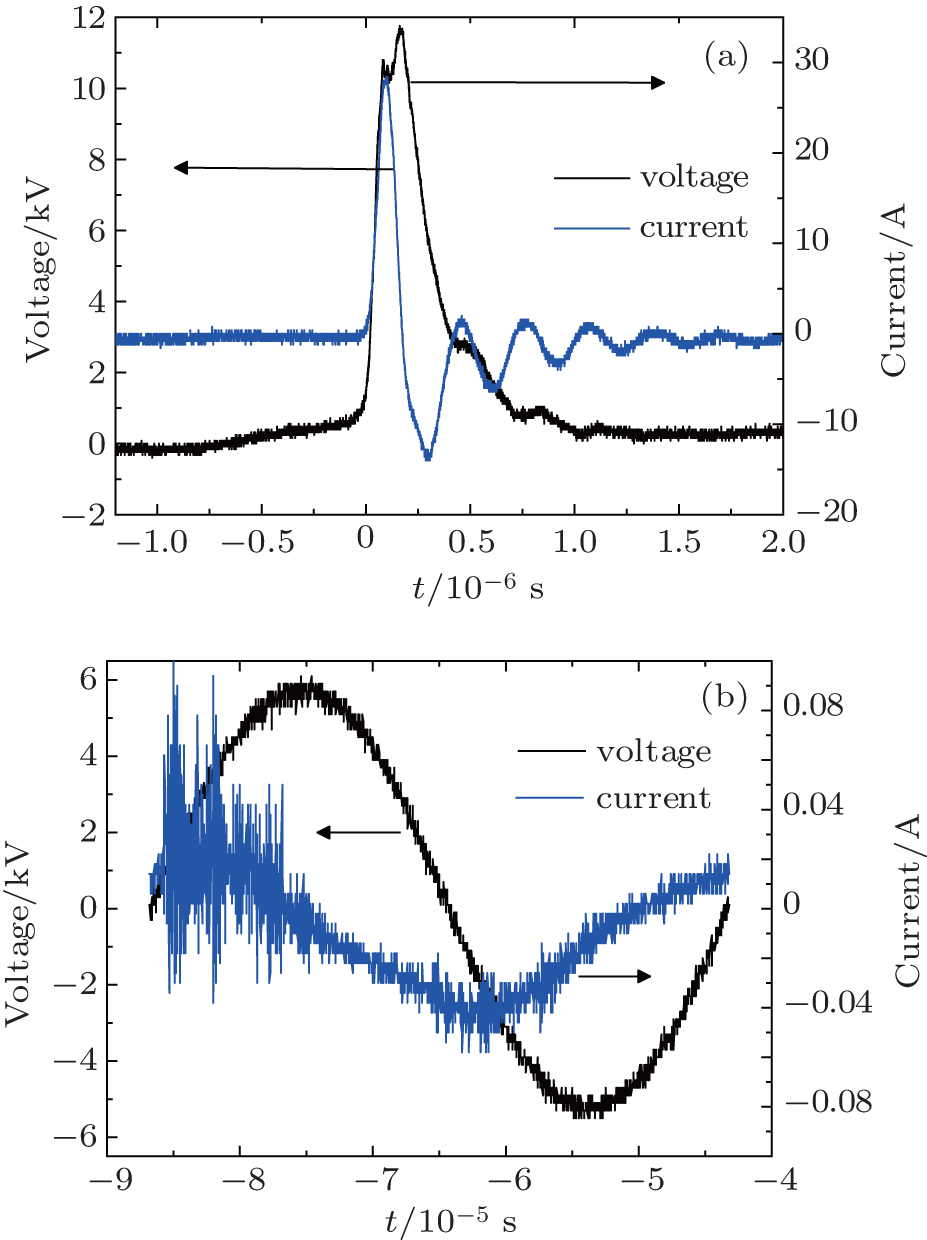 | Fig. 5. Plots of applied voltage and discharge current versus time for (a) nanosecond discharge and (b) millisecond discharge. |
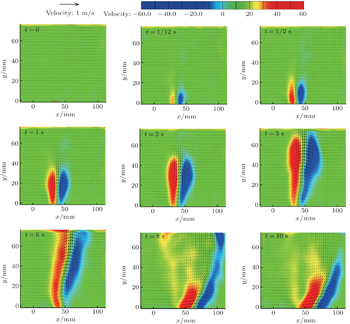
The PIV tests can reflect the macroscopic characteristics of the flow induced by NDPAA such as flow velocity and vorticity. The actuator geometry for PIV test is the same as the actuator mounted on the UAV model. The measurement results of flow induced by NDPAA are shown in Fig.
We can see from Fig.
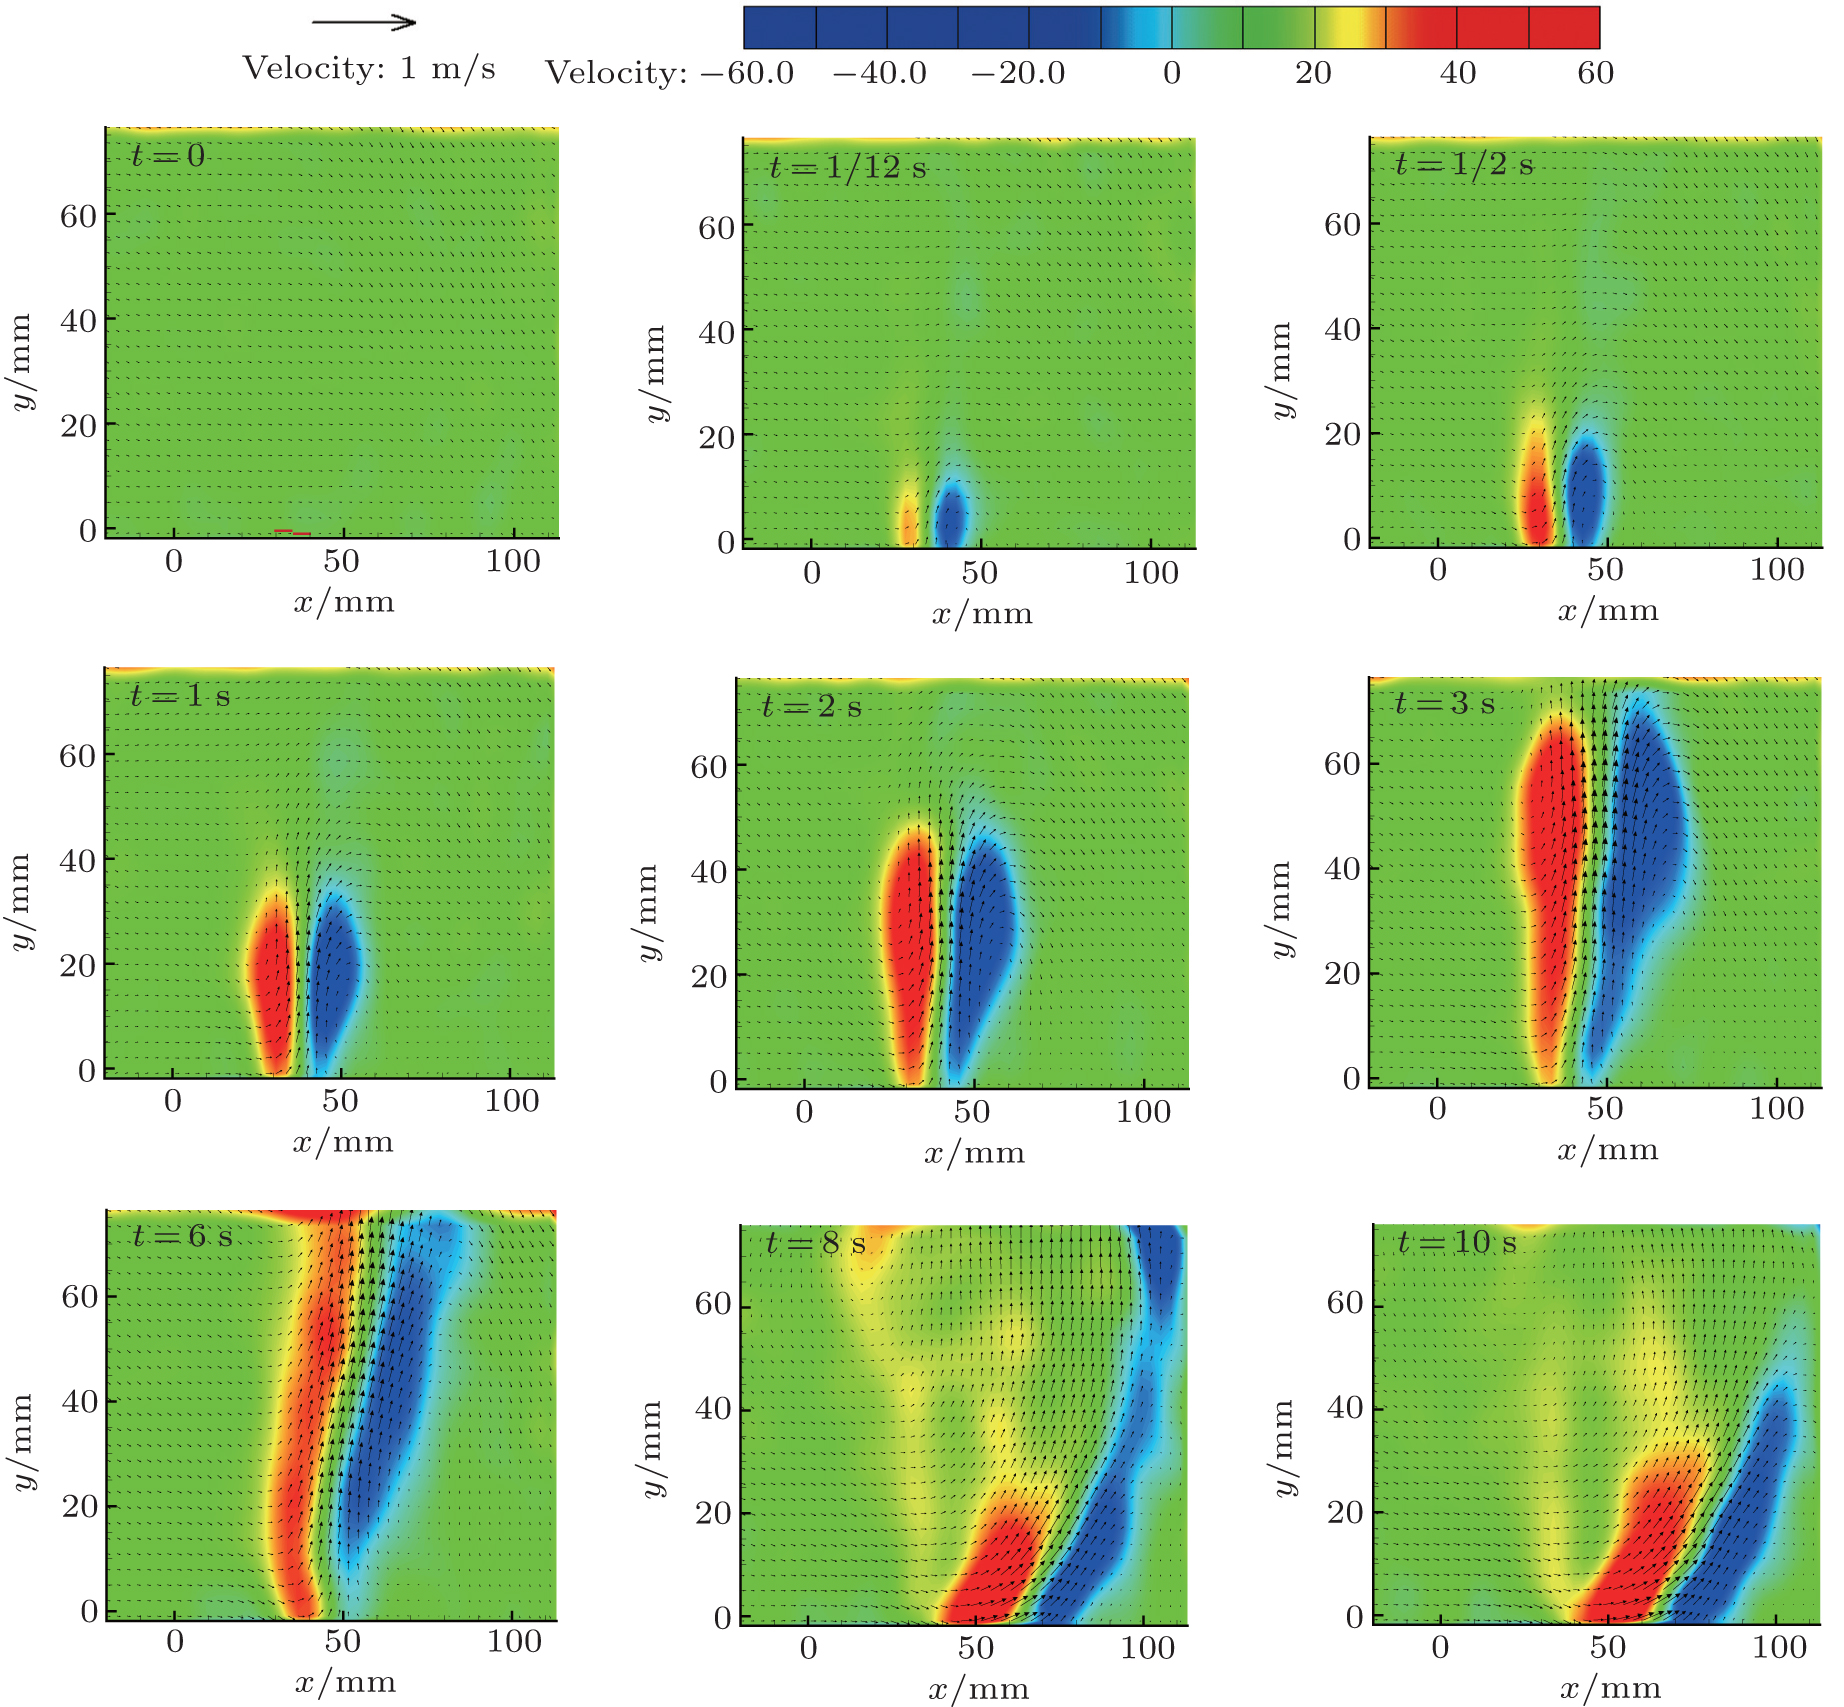 | Fig. 6. PIV test results of velocity and vorticity induced by NDPAA at different times. |
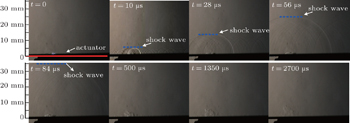
The high speed schlieren tests can depict the detailed microcosmic characteristics of the flow induced by NDPAA such as shock waves. The schlieren test results of shock wave propagation at different times are shown in Fig.
The schlieren test results show that nanosecond discharge can induce shock waves in the quiescent air. The shock waves are captured clearly by the CCD camera ten μs after the nanosecond discharge. The nanosecond discharge has a high reduced electrical field which is responsible for the fast heating in the air. The fast heating results in fast pressure rise and temperature rise near the electrodes and induces a series of shock waves. From 10 μs to 28 μs after discharge, the shock waves spread about 6.9 mm outward. The velocity of the shock wave can be calculated by the time interval and spread distance. It is about 380 m/s which corresponds to a Mach number of 1.2. That is to say, the spread velocity of the shock wave is transonic. As the shock waves spread outward, the contour lines of the shock waves become illegible. The intensity of the shock wave weakens. The visible lasting time of the shock waves is about 80 μs in each pulse discharge cycle. At 80 μs after the discharge such as 500 μs, 1350 μs, and 2700 μs, the shock waves dissipate to a weak disturbance.
 | Fig. 7. Schlieren test results of shock wave induced by NDPAA at different times. |
The freestream inflow velocities range from 20 m/s to 50 m/s in this paper. The effects of the freestream velocity (V∞), angle of attack (α), pulse frequency (f), and the applied voltage (U) are investigated in the paper.
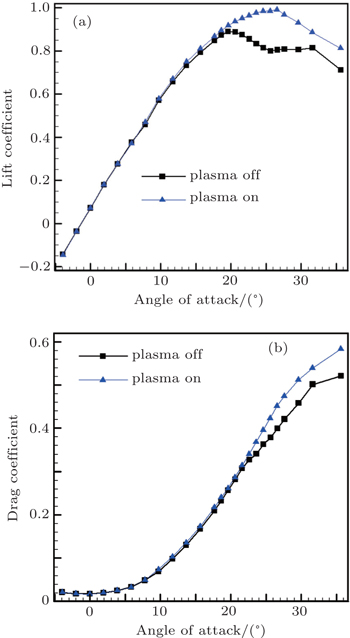
Figure
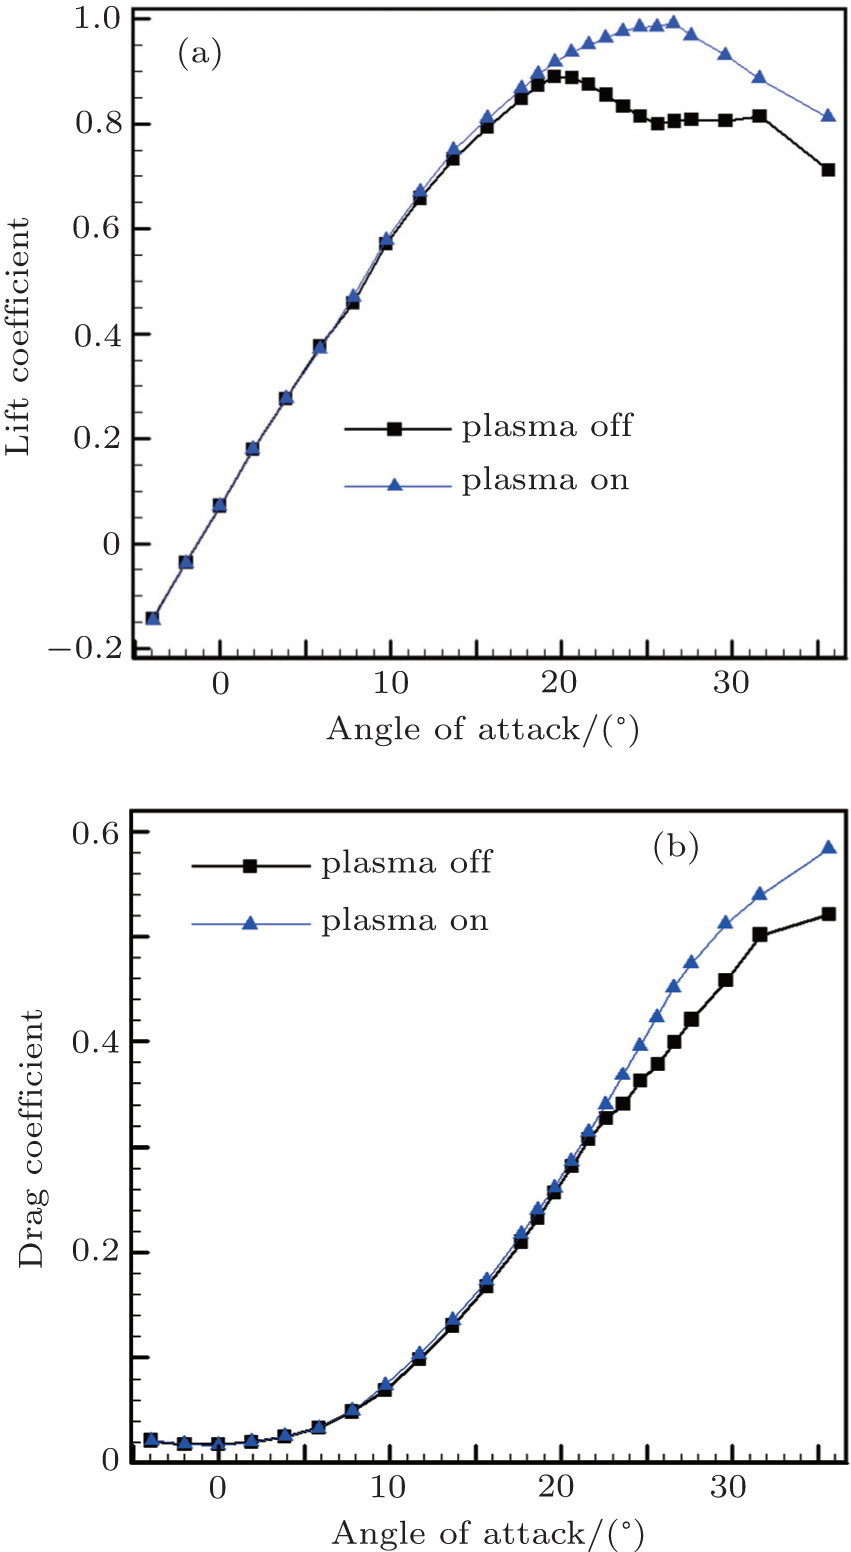 | Fig. 8. Experimental results at different angles of attack (V∞ = 30 m/s and U = 11 kV, f = 200 Hz). (a) Lift coefficient and (b) drag coefficient. |
We can see from the wind tunnel results that when the angle of attack is less than 12°, the flow on the suction side of the UAV model remains adhered to the surface of the model. So the augmentations of lift and drag coefficient are negligible after the nanosecond discharge is on. When the angle of attack is more than 12°, the flow begins to separate at the tip of the UAV model caused by adverse pressure gradient. The flow separation spreads from the tip to the root of the UAV model then is accompanied with the angle of attack increasing. When the angle of attack increases to a critical stall value (20°), the flow separation occupies the whole suction side of the UAV model. The lift coefficient of the model begins to decrease. After actuation, the flow separation can be suppressed effectively by nanosecond discharge, and the lift coefficient is much higher than the uncontrolled condition. The lift coefficient augmentations for different angles of attack are calculated then. The lift coefficient increases 2.24% at an angle of attack 20°. When the angle of attack is more than 20°, the NDPAA can still suppress the separation completely. There is a 23.75% lift coefficient increment after actuation at α = 27°. The maximal lift coefficient increases from 0.89 to 0.99 with an 11.24% augmentation. The critical stall angle of attack of the UAV increases from 20° to 27°.
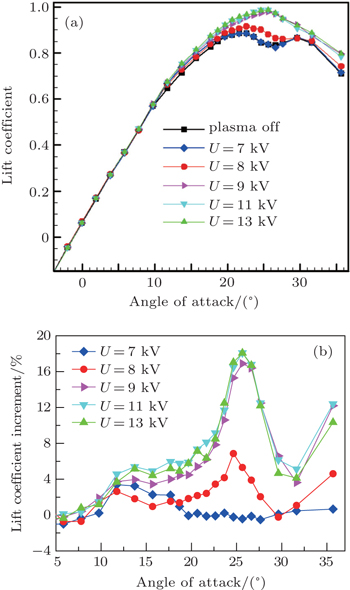
The effect of the applied voltage is examined. The wind tunnel results of different applied voltages are shown in Fig.
The results indicate that flow separation appears on the suction side of the UAV model at α = 12° and stall separation occurs at α = 20°. When the applied voltage is 7 kV, the NDPAA cannot suppress the flow separation, and the lift coefficient of the UAV model is almost the same as that for plasma off. When the applied voltage is 8 kV, the flow separation can be partly suppressed by the NDPAA, and the lift coefficient increases a little compared with that for plasma off. When the applied voltage is 9 kV, the flow separation can be totally suppressed by the NDPAA. The lift coefficient increases obviously. The lift coefficient increases 17.1% at α = 26° for U = 9 kV. When the applied voltages are increased to 11 kV and 13 kV respectively, the flow separation can be totally suppressed too, and the lift coefficient augmentation is almost the same as that at 9 kV. The lift coefficient increases 18.0% at α = 26° for U = 13 kV. In conclusion, the applied voltage represents the actuation intensity, and it is an important parameter in flow control. A threshold voltage exists in plasma flow control. If the applied voltage is bigger than the threshold value, the flow separation can be suppressed effectively, or else, the flow separation cannot be suppressed. The boundary flow separation is caused by the adverse pressure gradient. The adverse pressure gradient increases obviously at higher inflow velocity. It is difficult to suppress the flow separation with higher adverse pressure gradient. The applied voltage and the actuation intensity should be increased in flow control. So, the bigger the freestream, the bigger the threshold voltage is. In our studies, the threshold voltage is 9 kV at V∞ = 50 m/s and 8 kV at V∞ = 30 m/s for the UAV model.
 | Fig. 9. Experimental results at different applied voltages (V∞ = 50 m/s, f = 230 Hz): (a) lift coefficients for different applied voltages, and (b) lift coefficient increments for different applied voltage. |
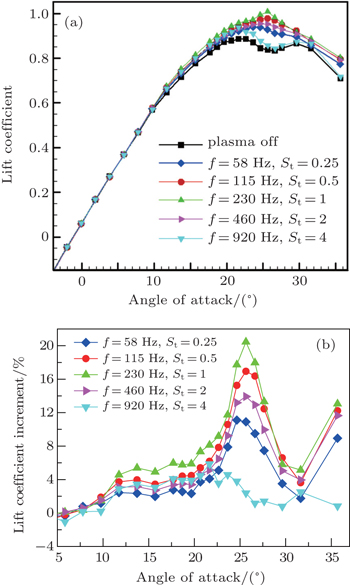
A study is carried out to examine the influence of pulse frequency. Figure
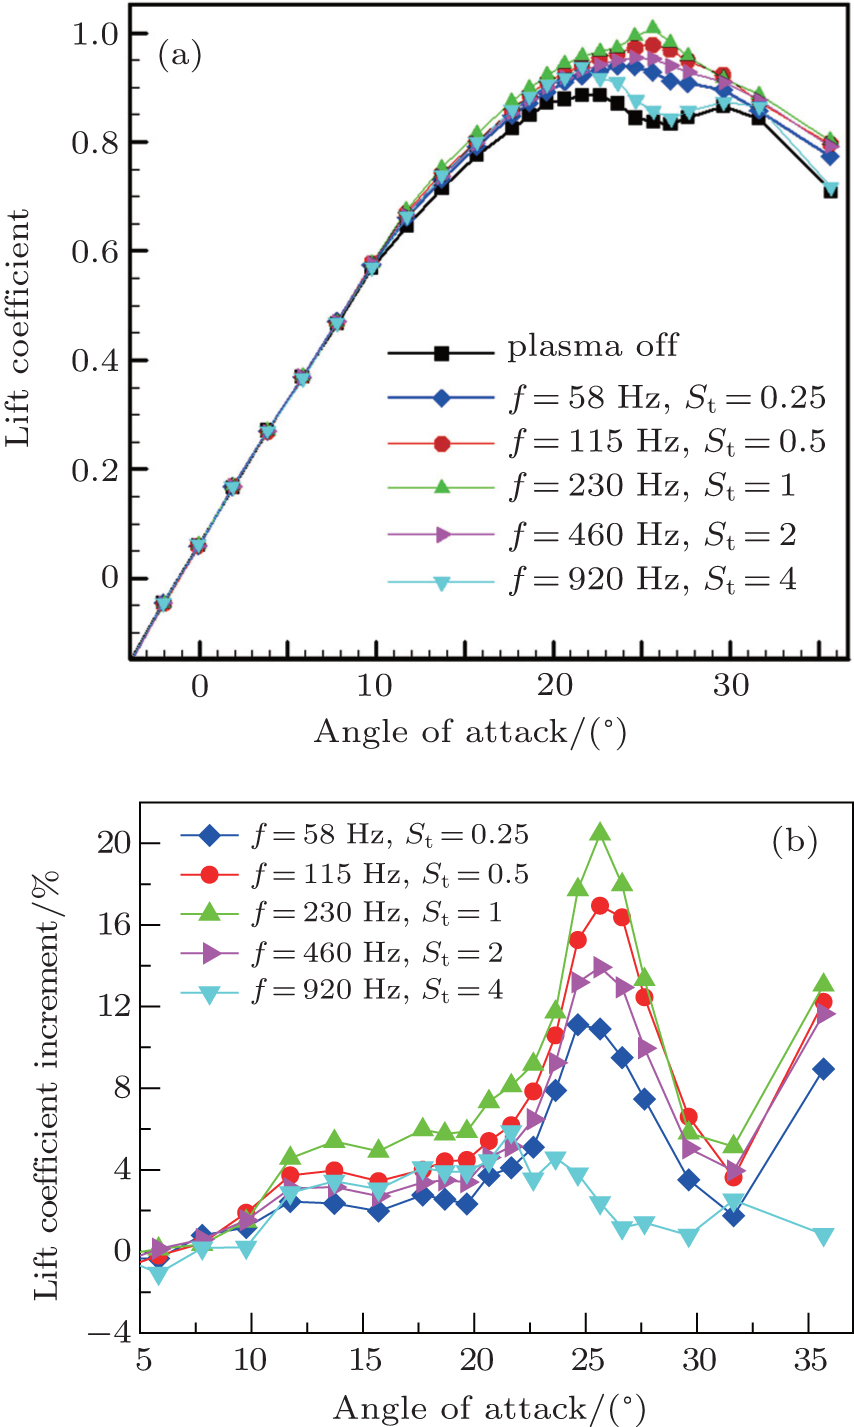 | Fig. 10. (a) Lift coefficients and (b) lift coefficient increments versus angle of attack, measured at different pulse frequencies, V∞ = 50 m/s, α = 22°, and U = 12 kV. |
When the pulse frequency is 920 Hz, the variation of lift coefficient is tiny. The maximal lift coefficient increment is about 5.87% at α = 22°. When the pulse frequency is 460 Hz, the control effect is better than that at 960 Hz, and the flow separation on the UAV model is partly suppressed by the NDPAA. The maximal lift coefficient increment is about 10.90% at α = 26°. When the pulse frequency is 230 Hz, the control effect is the best in cases of all the tested frequencies, and the flow separation can be completely suppressed by the NDPAA, the maximal lift coefficient increment is about 20.45% at α = 26°. When the pulse frequencies are 115 Hz and 58 Hz, the control effects are worse than that at 230 Hz, the maximal lift coefficient increments are about 16.94% and 13.92% at α = 26° respectively. In summary, there is an optimal frequency existing in plasma flow control. The optimal frequency is determined by Strouhal number (St). When Strouhal number equals one, the flow control effect is the best. The Strouhal number is defined as St = fcsep/V∞, where csep is the separation region length, which is equal to the mean aerodynamic chord length (0.22 m) for the UAV test model, f is the pulse frequency of the discharge, and V∞ is the freestream velocity. When V∞ is 50 m/s and csep is 0.22 m, the relations between St and f can be calculated. The optimal pulse frequency is 230 Hz, and the corresponding Strouhal number is 1. The flow control effect of f = 230 Hz is the best which is in accordance with the wind tunnel results.
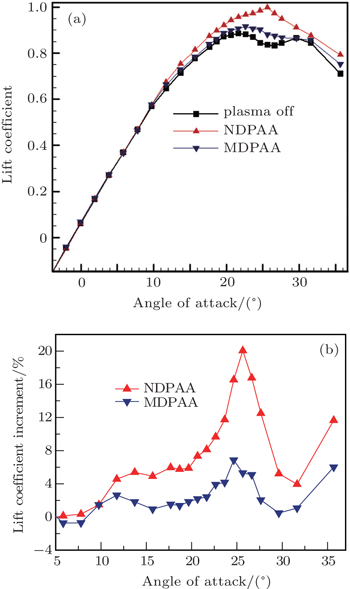
The mechanisms for the NDPAA and MDPAA in plasma flow control are different. The MDPAA accelerates the flow near the actuator and enlarges the velocity of the boundary layer. The NDPAA induces shock waves and enhances the momentum and energy mixing between the boundary layer and the freestream flow. Wind tunnel tests are conducted to compare the flow control ability of NDPAA with that of MDPAA. The lift coefficients of the UAV model before and after control are shown in Fig.
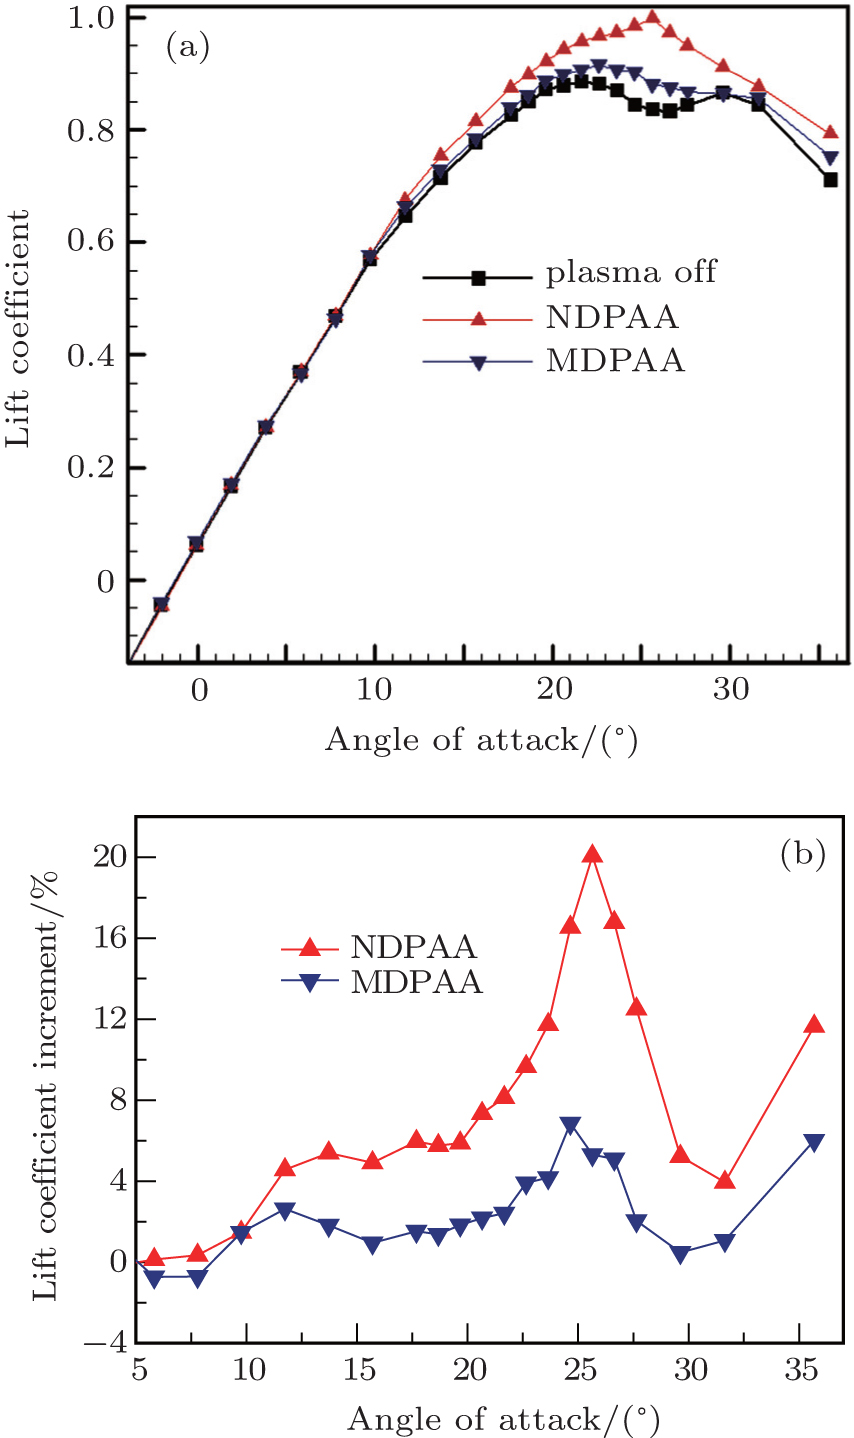 | Fig. 11. Comparisons of (a) lift coefficients and (b) lift coefficient increments versus angle of attack between MDPAA and NDPAA, measured at V∞ = 50 m/s, f = 230 Hz, and U = 12 kV. |
The mechanism for plasma flow control can be momentum effect, shock effect, and chemical effect.[26,27] Momentum effect induces a near-surface flow velocity of 0 m/s–8 m/s.[3] Shock effect induces local pressure or temperature rise near the electrode.[10,16] Chemical effect adds new particles, such as ions, electrons and excited particles, into the flow field.[18] It is widely received that momentum effect, which induces boundary layer acceleration, is the main mechanism for plasma flow control. In our opinion, the momentum effect and shock effect may be working at the same time in plasma flow control. For MDPAA, the momentum effect is the dominant mechanism. MDPAA induces an acceleration of near-surface boundary layer. Energy and momentum are added into the boundary layer, which enhances the ability to resist flow separation caused by adverse pressure gradient for boundary layer. But the maximum induced velocity for MDPAA is less than 10 m/s. It is limited by the property of the dielectric layer and the power supply. The actuators will be destroyed if the discharge voltage is too high. The momentum added into the boundary layer by the millisecond discharge is quite limited. The MDPAA can only work effectively when the freestream velocity is several tens of meters per second.
The millisecond discharge current is only 0.1 A in our research. The shock effect is a secondary mechanism for millisecond plasma aerodynamic actuation. But the main mechanism for nanosecond discharge plasma flow control may be not momentum effect, since the induced velocity is less than 1m/s. The velocity and vorticity measurements by the particle image velocimetry show that the flow direction is vertical, not parallel to the dielectric layer surface. Thus, the main flow control mechanism for nanosecond plasma aerodynamic actuation is presumed to be shock effect, which induces local pressure or temperature rise near the electrode, other than momentum effect. For the NDPAA, energy is released in extremely short time to intensify the instantaneous actuation strength, such as nanosecond discharge. Nanosecond discharge yields strong turbulence even shock waves which act on the boundary layer. Shock waves produce stronger turbulent mixing of the flow, which can enhance momentum and energy exchange between the boundary layer and inflow greatly. High momentum fluid is brought into the boundary layer intermittently, enabling the flow to withstand the adverse pressure gradient without flow separation. That is why the NDPAA can work effectively at higher inflow velocity than the MDPAA.
Experimental results in the paper indicate that the nanosecond discharge is more effective in flow control than the millisecond discharge. One study[16] demonstrated that nanosecond discharge has an extremely high efficiency of operation for aerodynamic plasma actuator in a very wide velocity range (Ma = 0.03–0.75). So shock effect is more important than momentum effect in plasma flow control for the NDPAA.
The flow separation control of an unmanned air vehicle by the NDPAA is investigated in this work. Based on the actuation characteristic test, it is found that the applied voltages for NDPAA and MDPAA are nearly the same. The maximal discharge current for MDPAA is 0.1 A only, the nanosecond discharge is 30 A which is much bigger than that of millisecond discharge. The maximal velocity induced by the NDPAA is about 0.5 m/s. The flow induced by nanosecond plasma actuation is not in the form of starting vortex nor wall jet for the millisecond discharge, and it is similar to a shock wave upward. The fast heating results in fast pressure rise and temperature rise near the electrodes and induces a series of shock waves. The velocity of the shock wave is about 380 m/s. The lasting time of the shock waves is about 80 μs. The shock waves turn into weak disturbance after 80 μs in each pulse discharge cycle. Based on the wind tunnel results, it is found that the NDPAA is effective in flow separation control for the UAV model when the freestream velocity is 50 m/s. Using the NDPAA at a freestream velocity of 30 m/s, the flow separation can be totally suppressed and the critical stall angle of attack for the tested UAV model increases from 20° to 27° with a maximal lift coefficient increment of 11.24%. Flow separation can be suppressed when the discharge voltage is larger than the threshold voltage, and the optimum operation frequency for NDPAA is the one which makes the Strouhal number equal 1. The NDPAA is more effective than the MDPAA in boundary layer flow control. The main mechanism for nanosecond discharge is shock effect. Shock effect is more effective in flow control than momentum effect.
| 1 | |
| 2 | |
| 3 | |
| 4 | |
| 5 | |
| 6 | |
| 7 | |
| 8 | |
| 9 | |
| 10 | |
| 11 | |
| 12 | |
| 13 | |
| 14 | |
| 15 | |
| 16 | |
| 17 | |
| 18 | |
| 19 | |
| 20 | |
| 21 | |
| 22 | |
| 23 | |
| 24 | |
| 25 | |
| 26 | |
| 27 | |
| 28 | |
| 29 | |
| 30 | |
| 31 |