Bubble nonlinear dynamics and stimulated scattering process
Shi Jie1, 2, Yang De-Sen1, 2, Shi Sheng-Guo1, 2, Hu Bo1, 2, †,  , Zhang Hao-Yang1, 2, Hu Shi-Yong1
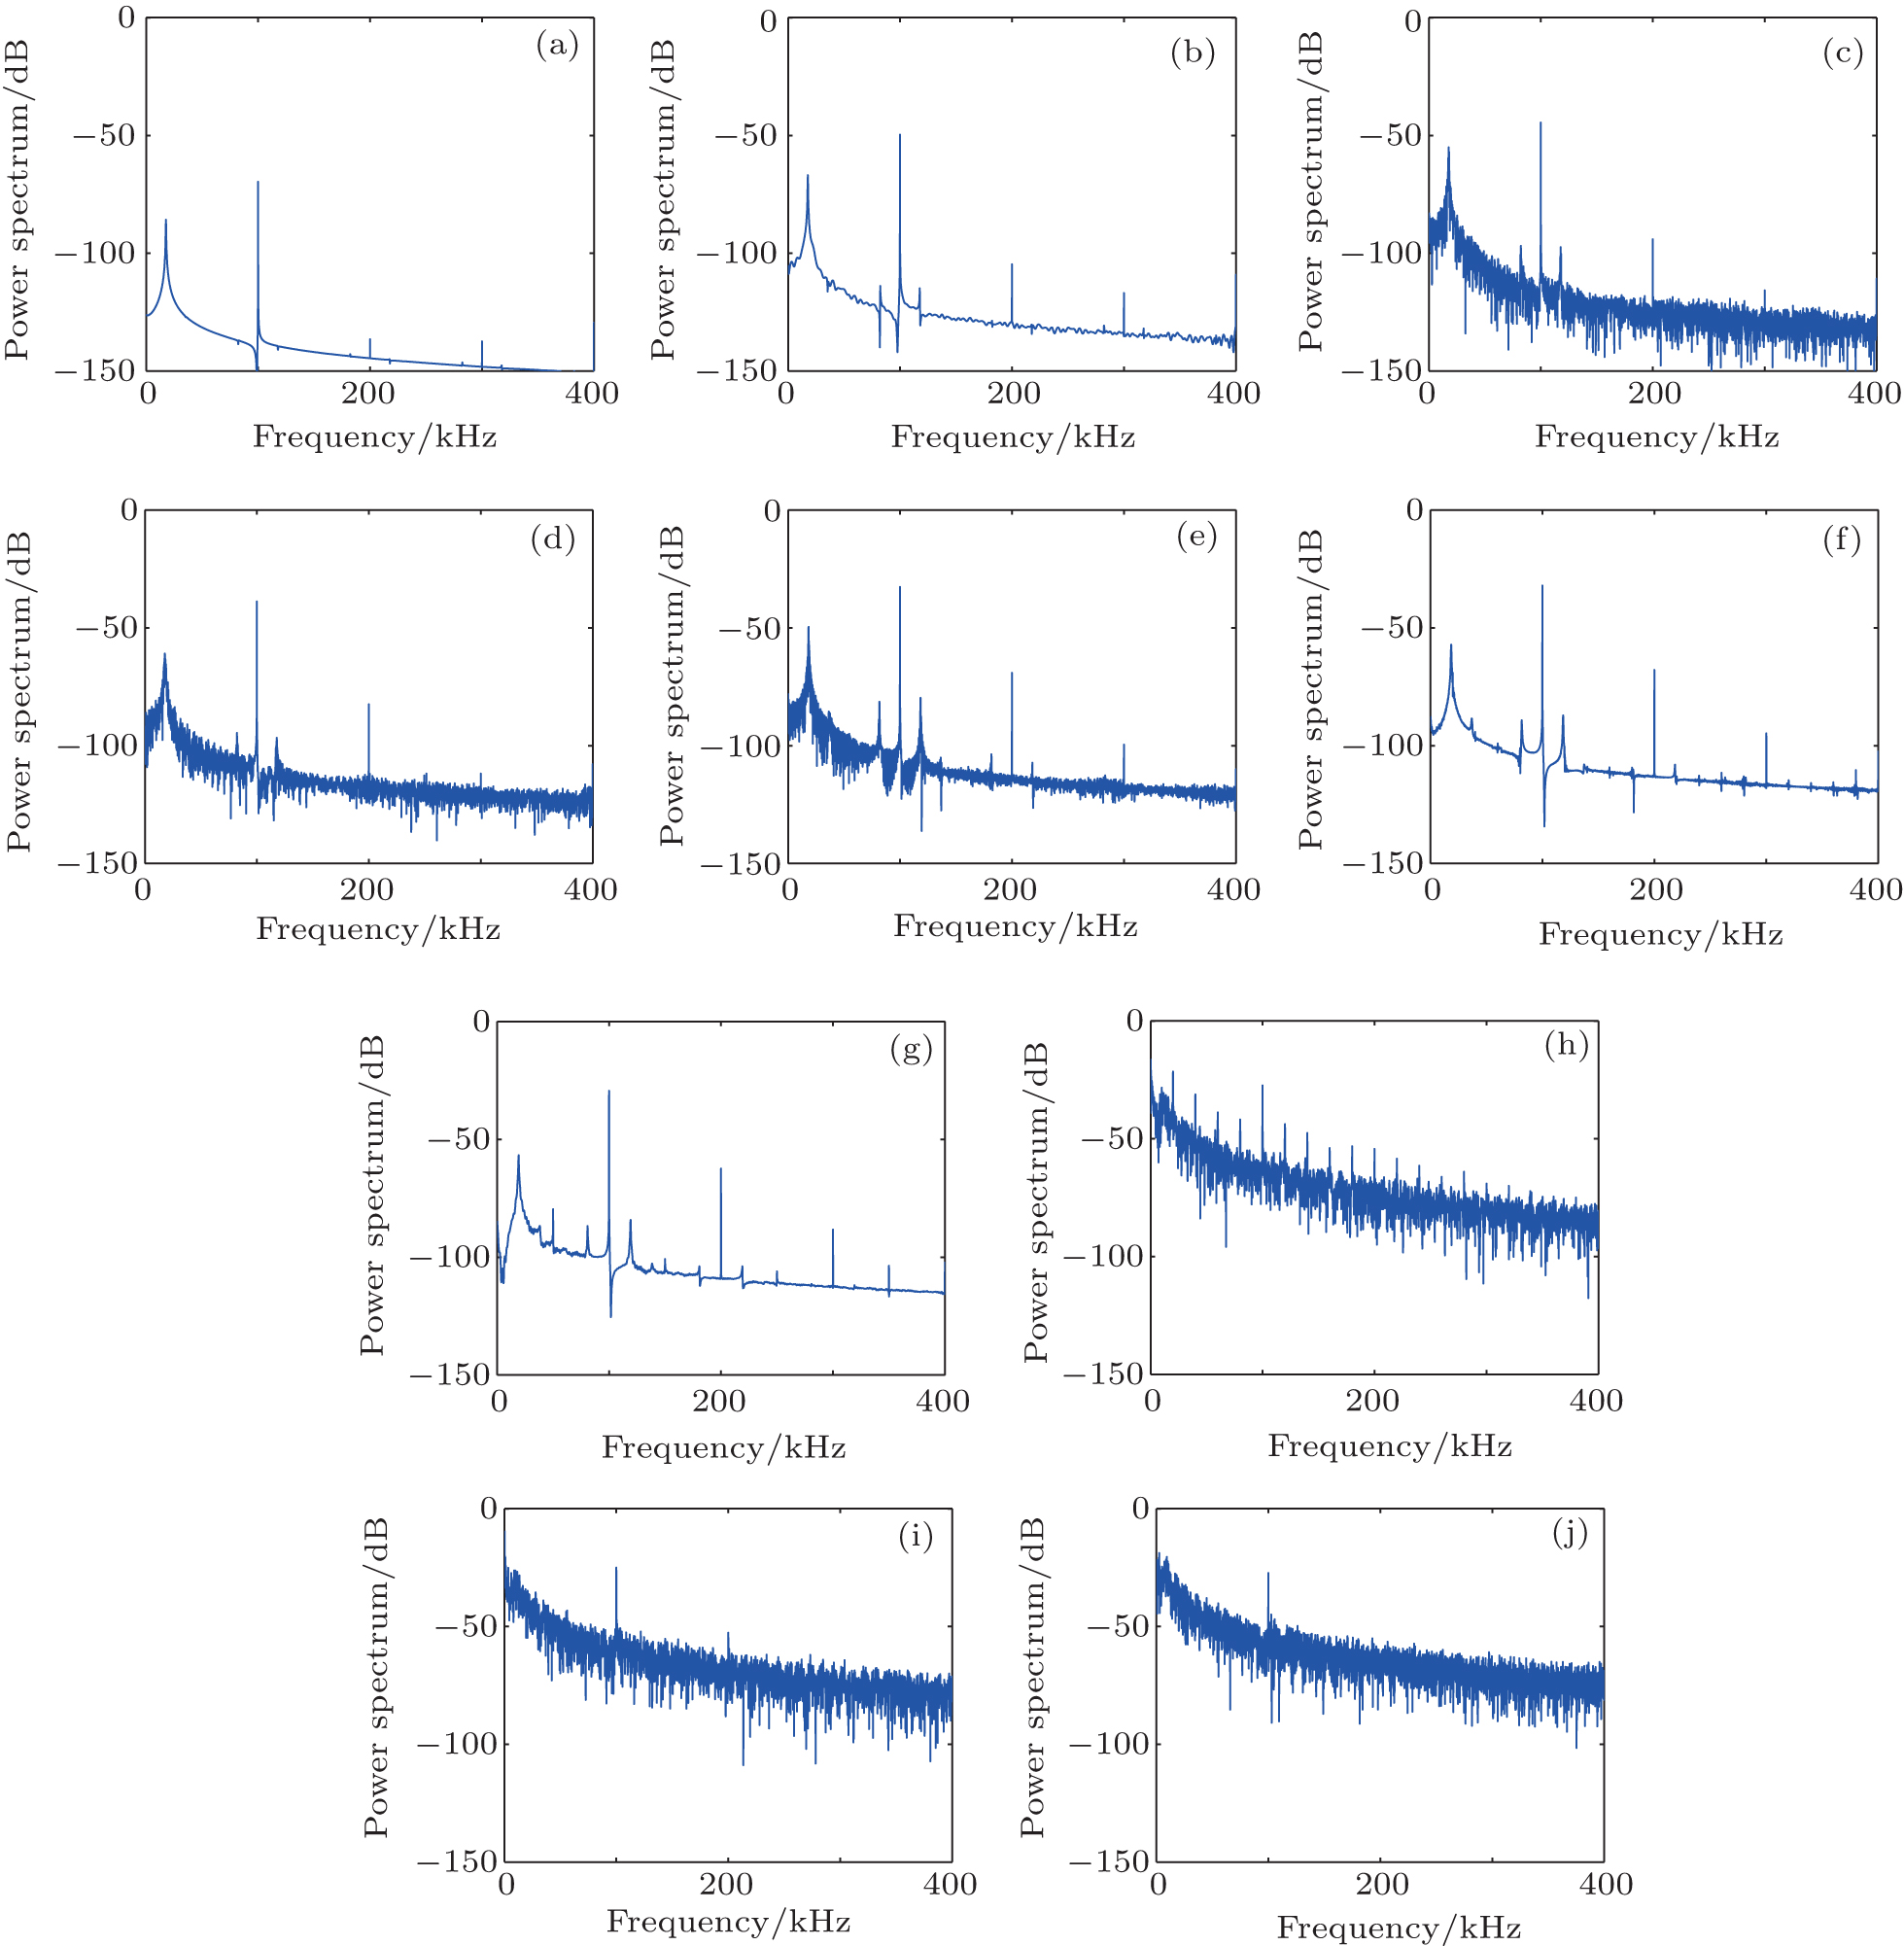
, Zhang Hao-Yang1, 2, Hu Shi-Yong1 Power spectrum diagrams of the oscillation system response versus acoustic pressure amplitude at (a)