

Wavelength modulation spectroscopy at 1530.32 nm for measurements of acetylene based on Fabry–Perot tunable filter
[Li Yun-Long, Yang Bing-Chu†,  , Xu Xue-Mei‡, ]
, Xu Xue-Mei‡, ]
|
|


† Corresponding author. E-mail:
‡ Corresponding author. E-mail:
Project supported by the National Natural Science Foundation of China (Grant Nos. 61172047 and 61071025).
Sensitive detection of acetylene (C2H2) is performed by absorption spectroscopy and wavelength modulation spectroscopy (WMS) based on Fiber Fabry–Perot tunable filter (FFP-TF) at 1530.32 nm. After being calibrated by Fiber Bragg Grating (FBG), FFP-TF is frequency-multiplexed and modulated at 20 Hz and 2.5 kHz respectively to achieve wavelength modulation. The linearity with 0.9907 fitting coefficient is obtained by measuring different concentrations in a 100 ppmv–400 ppmv range. Furthermore, the stability of the system is analyzed by detecting 50 ppmv and 100 ppmv standard gases for 2 h under room temperature and ambient pressure conditions respectively. The precision of 11 ppmv is achieved by calculating the standard deviation. Therefore, the measuring system of C2H2 detection can be applied in practical applications.
C2H2 is a species of toxic gases that have strong chemical activities, and it is easy for them to decompose, burn, and explode. In the field of transformer fault diagnosis, C2H2 is one of the main components of the oil-dissolved fault gases in the transformer.[1] Besides, during the research of plant growth, C2H2 can be used as a kind of plant hormone to ripen the fruits or wither the flowers. Therefore, sensitive C2H2 detection is extremely significant in some practical applications.
For now, there are two major methods of detecting C2H2. One is gas chromatography, which is very universal and valid in industrial applications.[2] However, the method is process-complicated and time-consuming. Hence, it is not suitable for on-line monitoring. The other is tunable diode laser absorption spectroscopy (TDLAS).[3–5] After selecting the apposite absorption line of the gas to be measured, it is easy to achieve highly sensitive and good selective results by scanning a single narrow laser line around the chosen absorption line. To improve gas optical absorption length and measurement sensitivity, a multi-pass absorption cell was proposed. Furthermore, with the development of wavelength modulation technology,[6–8] the second harmonic detection method was employed in measuring the densities to obtain higher signal-to-noise ratio (SNR). Various trace gases have been detected successfully by this method.[9]
In some special applications, it is very necessary to measure various gases at the same time. For example, during transformer fault diagnosis, it is usually required to detect several oil-dissolved fault gases simultaneously, such as acetylene (C2H2), ethylene (C2H4), methane (CH4), etc. A logical solution of TDLAS is to use multiple distributed feedback (DFB) lasers corresponding to each target gas. Therefore, with the increase of gas species, the gas detection system will become complicated and confused. In the present paper, the DFB laser is substituted by an amplified spontaneous emission (ASE) broadband optical source to detect C2H2 concentration. FFP-TF[10,11] is used to achieve wavelength modulation, and the Fiber Bragg Grating (FBG)[12] is applied to the calibration of FFP-TF. Because the FFP-TF has a broad tunable spectral range, the system hardly requires any change while sensing multi-component gas. In addition, according to the Pacific Northwest National Laboratory (PNNL) spectra database and spectral data from experiment, the apposite absorption line of C2H2 is determined. Moreover, the linearity of the system is tested by measuring different C2H2 concentrations. Besides, the background signals of system due to the fluctuation of ASE source and electric noise are also considered. Finally, the precision and the stability of the gas measurement system are analyzed by the standard deviation.[13,14]
The fundamentals of absorption spectroscopy, wavelength modulation and FFP-TF are presented to guide readers in understanding the system and the discussion presented in Section 3. The absorption of monochromatic light along a uniform path can be described by the Beer–Lambert law,

To improve SNR, wavelength modulation is introduced into the system. In the present paper, the injection voltage of FFP-TF is modulated by a sinusoidal function at frequency f, resulting in simultaneous modulation of passed wavelength (or frequency),


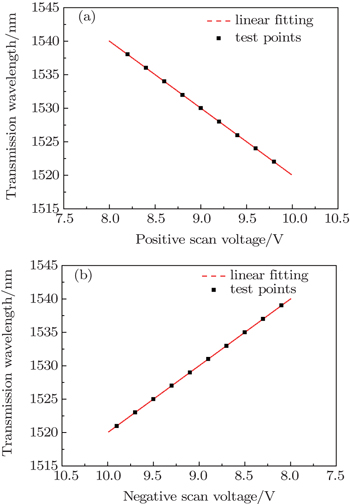
The basic theory of FFP-TF is the multi-beam interference principle. The input and output fibers are fastened to a pair of piezoelectric ceramics, that is, F-P cavity length can be controlled by the operating voltage applied to the pair of piezoelectric ceramics. According to the F-P interference principle, if the F-P cavity length alters, the center wavelength of narrowband interference peak changes, and then the transmission wavelength of FFP-TF shifts. Figures
 | Fig. 1. Transmission wavelengths versus positive scan voltage (a) and negative scan voltage (b). |
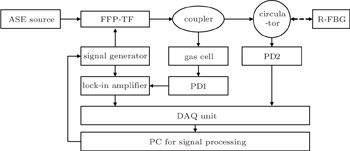
On the basis of theories just described above, the WMS system based on FFP-TF is designed as shown in Fig.
 | Fig. 2. Schematic diagram of the experiment setup for WMS system. |
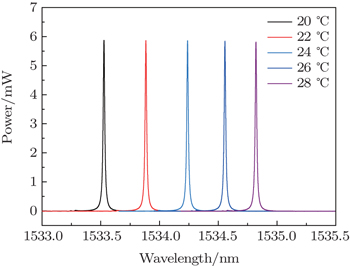
The other part from the coupler is used to calibrate FFP-TF. The FFP-TF is sensitive to temperature because of its construction, that is, when the ambient temperature changes, the transmission wavelength of FFP-TF will shift as shown in Fig.
 | Fig. 3. Powers versus transmission wavelength of FFP-TF for different temperatures. |
The narrowband light from the coupler passes through a circulator and reaches the R-FBG, and then is reflected (only a specific range of wavelengths can be reflected) by R-FBG. The light reflected by R-FBG comes back to the circulator and is detected by InGaAs photodetector2 (PD2). The electric signal from PD2 is sent to the DAQ unit and eventually reaches the PC for signal processing. By analyzing the signal from PD2, the relation between driving voltage of FFP-TF and reflective central wavelength of R-FBG can be calculated. Then the PC for signal processing controls the signal generator to adjust the scan voltage of FFP-TF appropriately for achieving wavelength modulation. This approach can calibrate FFP-TF effectively and eliminate the influence of ambient temperature.
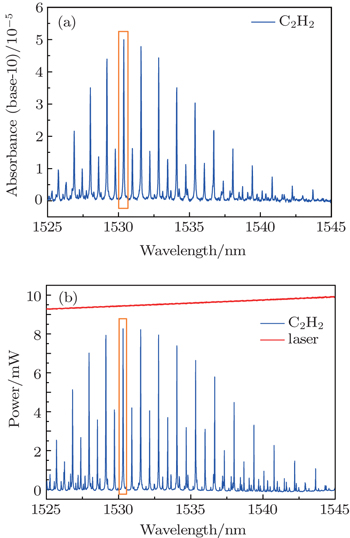
When choosing the absorption line of C2H2, there are two problems to be considered. One is about the spectral absorption line interference from C2H2 itself or other gases. The other is about the intensity of C2H2 absorption line, which determines the detection limit and precision of the system. That is, the sensitivity is higher with greater intensity. Figure
 | Fig. 4. C2H2 absorption lines from PNNL database (a) and experiment (b). |
The initial second harmonic (2f) signal in Fig.
 | Fig. 5. The 2f signals before and after background subtraction. |
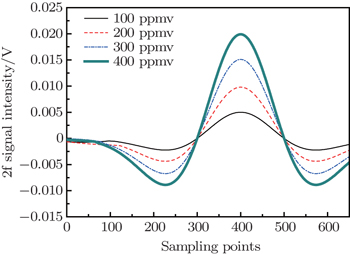
Linearity is one important parameter in a measuring instrument. In the system, standard gases with C2H2 concentrations of 100 ppmv, 200 ppmv, 300 ppmv, and 400 ppmv are detected successively to verify the linearity. Figure
 | Fig. 6. Corrected 2f signals versus sampling point for different concentrations. |
 | Fig. 7. Linearity of the measurement system. The fitting is given by y = 0.0001(0.49x − 1) with 0.9907 fitting coefficient. |
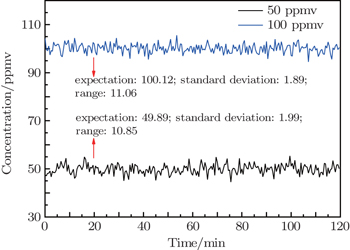
Standard deviation is usually used to measure the stability of the instrument performance, that is, the better stability gives rise to the less standard deviation. In the analysis experiment, standard gases of 50-ppmv C2H2 and 100-ppmv C2H2 are tested for a time of 2 h respectively as shown in Fig.
 | Fig. 8. Measurements of 50-ppmv and 100-ppmv C2H2 standard gases. |
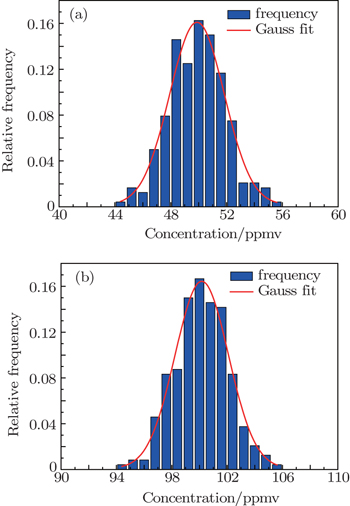
 | Fig. 9. Probability distributions of measurements for 50 ppmv (a) and 100 ppmv (b). |
Wavelength modulation spectrum at 1530.32 nm for the measurement of C2H2 based on FFP-TF is presented. Instead of traditional tunable diode laser, ASE broadband source and FFP-TF are used to achieve wavelength modulation. Under room temperature and ambient pressure conditions, a number of experiments are performed with this system. The experimental results indicate that the system has a good linearity and stability. Although the precision of the system is only 11 ppmv, it still meets the requirements of some practical applications and offers the possibility of measuring species of gases simultaneously without additional installation.
| 1 | |
| 2 | |
| 3 | |
| 4 | |
| 5 | |
| 6 | |
| 7 | |
| 8 | |
| 9 | |
| 10 | |
| 11 | |
| 12 | |
| 13 | |
| 14 | |
| 15 | |
| 16 |