Bidirectional transfer of quantum information for unknown photons via cross-Kerr nonlinearity and photon-number-resolving measurement
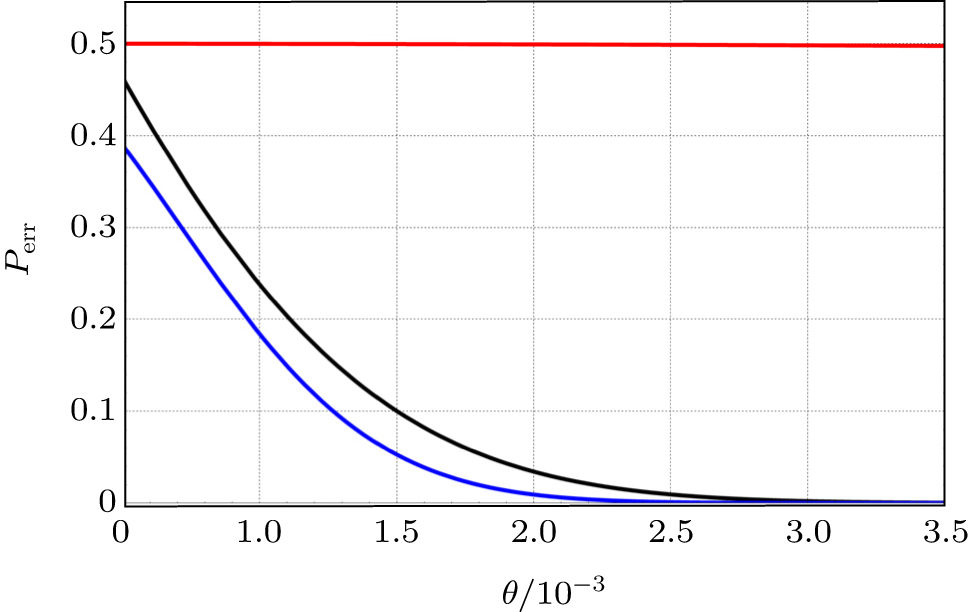
Plots of the error probabilities of the C-path gates based on coherent state and X-homodyne (red line(upper)),[

Bidirectional transfer of quantum information for unknown photons via cross-Kerr nonlinearity and photon-number-resolving measurement |
Plots of the error probabilities of the C-path gates based on coherent state and X-homodyne (red line(upper)),[ |
 |