

Weak value amplification via second-order correlated technique
[Cui Ting1, Huang Jing-Zheng1, †,  , Liu Xiang3, Zeng Gui-Hua1, 2]
, Liu Xiang3, Zeng Gui-Hua1, 2]
|
|


† Corresponding author. E-mail:
Project supported by the Union Research Centre of Advanced Spaceflight Technology (Grant No. USCAST2013-05), the National Natural Science Foundation of China (Grant Nos. 61170228, 61332019, and 61471239), and the High-Tech Research and Development Program of China (Grant No. 2013AA122901).
We propose a new framework combining weak measurement and second-order correlated technique. The theoretical analysis shows that weak value amplification (WVA) experiment can also be implemented by a second-order correlated system. We then build two-dimensional second-order correlated function patterns for achieving higher amplification factor and discuss the signal-to-noise ratio influence. Several advantages can be obtained by our proposal. For instance, detectors with high resolution are not necessary. Moreover, detectors with low saturation intensity are available in WVA setup. Finally, type-one technical noise can be effectively suppressed.
In the theory of quantum mechanics, the process of measuring an unknown state of a system by a meter can be described in two steps: coupling the system with the meter and measuring the meter to get information. For a standard projective measurement, where the coupling is strong, the outcome must be one of the eigenvalues of the system. On the other hand, when the coupling is weak, Aharonov, Albert and Vaidman (AAV)[1] showed that there is a very strange phenomenon that the outcome could be outside the range of the eigenvalues by means of appropriate pre-selection and post-selection on the system. This phenomenon is called weak value amplification (WVA), which plays a significant role in parameter estimation in recent years.[2–11]
So far, many theories and experiments of WVA assume that the meter state is pure.[1,12] However, in some cases, preparing a pure state can be difficult because decoherence is easily induced by environmental disturbance.[13–15] In Ref. [16], Young-Wook Cho, et al. considered this problem and proposed a new scheme applying incoherent meter state to decrease the experimental difficulty. They used pseudo-thermal light instead of laser to repeat the AAV experiment and confirmed the feasibility.
On the other hand, in the AAV weak measurement experiment with photon position as the meter, beam after post-selection is directly collected by a charge-coupled device (CCD).[7,16] Though simple operation and calculation it has, larger displacement and better performance cannot be obtained for lack of sufficient data. It is natural to ask whether an improvement can be achieved by using different detection techniques.
Recently in Ref. [17], Young's double-slit interference experiment was implemented by second-order correlation detection, which was first proposed by Hanbury Brown and Twiss.[18] Researchers found that more data could be collected through two-dimensional second-order correlated function patterns and varied scanning methods, which effectively improved the imaging resolutions.
Inspired by this idea, in this paper, we propose a new scheme combining second-order correlated technique with pseudo-thermal light source to realize WVA. We find that WVA phenomenon can be observed from second-order correlated detection. By applying two-dimensional second-order correlation function patterns, we obtain different WVA amplification factors by means of varied scanning methods.
In the AAV weak measurement scheme,[19] the interaction between a system and a meter can be described by a Hamiltonian:


The feature of the weak value is that it can be arbitrarily large when the pre-selected state and post-selected state are nearly orthogonal.[19] By choosing α = π/4, β = α + π/2 + ɛ, the weak value can be calculated to a simple form which equals

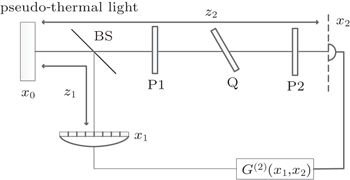
In our proposal, the experimental setup is shown in Fig.
 | Fig. 1. Experiment setup. The pseudo-thermal light is launched by scattering a focused laser beam. The light is divided into two arms by a BS. The signal arm (the upper path) is implemented by the AAV weak measurement system and the light is received by a single point detector. P1 and P2 are polarizers as pre- and post-selection. Q is a quartz plate. The light from the other arm is directly received by a CCD. |
The optical field in the source plane is represented by E(x). According to the optical system theory, the optical field in the detect plane is[20]


Substituting Eq. (
The second-order correlation function in Eq. (
We assume that the pseudo-thermal light is completely incoherent and satisfies the Gaussian type. Therefore, the term of first-order correlation function is

In the signal arm, we assume that the two polarizers are thin enough that their thickness can be neglected. Consequently, both of the polarizers have no effect on the propagation of the light. After the weak-coupled process in the quartz plate, the emission of the beam contains two components, the ordinary and the extraordinary light. In the extraordinary light, the quartz plate will induce a distance d due to birefringence and a phase difference θ. So the impulse response function will be written into the sum of two terms. Therefore, according to the Fresnel-diffraction approximation, the impulse response function of the signal arm can be written as
In the reference arm, the light will directly propagate from the source to the detector D1. Thus, the impulse response function is
Substitute Eqs. (

The position of the detector on the signal arm is fixed. And, we set this fixed position at the center of the signal plane. Thus the intensity fluctuation is

From Eq. (
In fact, from Eq. (
We replace the one-point detector of reference arm in Fig.
 | Fig. 2. Two-dimensional second-order correlation function in Eq. ( |
By choosing different lines on the two-dimensional second-order correlation function figure, any displacements of AAV weak measurement will be obtained. If we rotate the scanning line along different direction clockwise, we can get larger displacements and amplifications than that in the traditional weak measurement. For example, line b describes the case where we just proposed above. Notice that, scanning the detectors through this line cannot get the largest displacement and amplification. Also, the curve is shown in Fig.
 | Fig. 3. Cross-sectional curves of a, b, c, and d represent the corresponding scanning lines in Fig. |
From Figs.

And the minimum resolvable signal dmin is denoted as

| Table 1. Numerical Simulation of σ and Aw in each scanning method. . |
We can see clearly that the ratio between Aw and σ varies in a very small range, and thus we can conclude that both SNR and dmin are independent of scanning methods.
Though, the SNR and resolution cannot be improved whatever scanning methods we choose in our proposal. The advantages are remarkable. First, large displacement will decrease the resolution requirement for detectors. Besides, due to post-selection probability, detectors with low saturation intensity is allowed to use in WVA setup.[24] Finally, it can also reduce type-one technical noise which has been investigated before.[24]
In this paper, we propose a new scheme to implement AAV weak measurement. The theoretical analysis manifests that WVA experiment can also be realized through second-order correlated technique. Moreover, we set up two-dimensional second-order correlated function pattern and describe how the amplification can be improved by choosing different scanning lines. Our theoretical model will pave the way to apply WVA setup in second-order correlated systems, such as ghost imaging. Furthermore, high amplification can reduce technical requirement for devices which lowers the cost and decreases experiment difficulty. Finally, WVA can effectively reduce technical noise. We believe our theory can have a bright prospect for weak measurement and second-order correlated technique.
| 1 | |
| 2 | |
| 3 | |
| 4 | |
| 5 | |
| 6 | |
| 7 | |
| 8 | |
| 9 | |
| 10 | |
| 11 | |
| 12 | |
| 13 | |
| 14 | |
| 15 | |
| 16 | |
| 17 | |
| 18 | |
| 19 | |
| 20 | |
| 21 | |
| 22 | |
| 23 | |
| 24 |