
Analysis of robustness of urban bus network
[Ren Tao†,  , Wang Yi-Fan, Liu Miao-Miao, Xu Yan-Jie]
, Wang Yi-Fan, Liu Miao-Miao, Xu Yan-Jie]
|
|


† Corresponding author. E-mail:
Project supported by the National Natural Science Foundation of China (Grant Nos. 61473073, 61374178, 61104074, and 61203329), the Fundamental Research Funds for the Central Universities (Grant Nos. N130417006, L1517004), and the Program for Liaoning Excellent Talents in University (Grant No. LJQ2014028).
In this paper, the invulnerability and cascade failures are discussed for the urban bus network. Firstly, three static models(bus stop network, bus transfer network, and bus line network) are used to analyse the structure and invulnerability of urban bus network in order to understand the features of bus network comprehensively. Secondly, a new way is proposed to study the invulnerability of urban bus network by modelling two layered networks, i.e., the bus stop-line network and the bus line-transfer network and then the interactions between different models are analysed. Finally, by modelling a new layered network which can reflect the dynamic passenger flows, the cascade failures are discussed. Then a new load redistribution method is proposed to study the robustness of dynamic traffic. In this paper, the bus network of Shenyang City which is one of the biggest cities in China, is taken as a simulation example. In addition, some suggestions are given to improve the urban bus network and provide emergency strategies when traffic congestion occurs according to the numerical simulation results.
Owing to the explosion of complex network science,[1,2] a lot of systems, natural and artificial, are considered as complex networks,[3–6] in which the nodes are the elementary components of the system and the edges connect a pair of nodes that mutually exchange information.[1,7–10]
During the last few years, public transportation systems (PTSs) have received increasing attention. Latora and Marchiori introduced the efficiency measure which gives a more general mathematical definition of small worlds in Boston subway.[11] Sen investigated the structural properties of the Indian railway network.[12] Guimera and Amaral proposed a model to analyse the world-wide airport network and found the most connected cities.[13] In addition, some research work concerned about the global cargo ship movements.[14] In the aspect of bus network, Sienkiewicz and Hołyst studied the bus and tramway systems in 22 Polish cities.[15] In addition, Wu et al. studied the degree distribution and efficiency of Beijing bus network, which shows the scale-free and small-world properties of urban bus network.[16,17] Zheng et al. analysed the topological properties of Beijing bus network in detail.[18] Xu et al. reported the statistical properties of three bus networks in three different cities of China.[19] Soh et al. studied the structures and properties of Singapore bus networks from weighted complex network.[20] Also there are several other researches about Chinese cities.[21–24] All these studies focused on the complexities hiding in the urban bus network by adopting the complex network theory. However, in these researches the robustness analyses of the urban bus network were not taken into consideration.
Robustness analysis has been considered since the work of Barabasi and Albert,[25] and the results showed that there is a huge difference between the ER network and BA network. Since then, increasing researches focused on the robustness analysis of complex network, which can be divided into static invulnerability analysis and dynamic cascade failures analysis. Callaway et al.[26] and Cohen et al.[27] focused on the robustness of the network based on percolation theory. Albert et al. studied the North American power grid in view of network and analysed its invulnerability.[28] Wang et al. studied degree distribution and robustness of cooperative communication network with scale-free model.[29] Not only the static invulnerability research, but also dynamic cascade failures received much attention. Motter and Lai studied the networks where loads can be redistributed among the nodes and the selective attacks can lead to a cascade of overload failures.[30] Kinney et al. modelled the cascade failures in the North American power grid.[31] Wang et al. took into account two stages of the cascading propagation in the interdependent networks.[32] Xiao et al. studied the way to optimize the robustness of complex network against cascade failures.[33] However, for the PTS, especially the urban bus network, most of the researches only focused on the static invulnerability, and their analyses were just for one layer model.[34] In fact, PTS are complex systems with layered structure, and these coexisting topologies interact and depend on each other.[35] On the other hand, PTS have loads which present the transmitting capabilities on each nodes or links and change dynamically.[35]
So in this paper, we analyse the robustness of urban bus network in both static invulnerability and dynamic cascade failures and choose the Shenyang city (one of the biggest cities in China) as the simulation example throughout the paper. The data of the Shenyang bus network are cited from
The rest of this paper is organized as follows. In Section 2, the three static models of urban bus network are described and analysed in detail. In Section 3, the invulnerability of urban bus networks is analysed based on both one-layer networks and two-layer networks under two attack strategies. In Section 4, based on the passenger flows, dynamic layered cascade failure model is constructed, and the robustnesses of urban bus network with different capacities are analysed. Finally, some conclusions are drawn from the present studies in Section 5.
Urban public transport network is a typical complex network which contains bus stops and bus lines. One bus line contains several bus stops. Also, considering the transfer of the passengers, this paper introduces three types of urban bus network models: bus stop network, bus transfer network, and bus line network. For these three types of models, we only concern the topology of the urban bus network, so all the three types of networks are unweighted and undirected.
For bus stop network, the bus stops are chosen as nodes and an edge exists between two nodes if they are consecutive stops on the any bus line.[15] In this way, the node degree k in bus stop network means the number of choices passengers can take to the consecutive stops and the distance d equals the total number of stops passengers need to pass on the shortest path from the start stop to the end stop, but sometimes it ignores the transfer times between two stops. Therefore, the bus stop network can intuitively represent the topology of the urban bus network.
By MATLAB software, we choose the Shenyang bus network as an example, the degree scope of bus stop network is in a range of [2, 13], the average degree of the whole network is 2.7894, and the degrees of most nodes are 2 or 3 since most of stops are in one line and they only connect the previous-stop and the next-stop. A few stops with larger degrees in Shenyang bus stop network are shown in Table
| Table 1. Top 5 stops with the larger degrees in Shenyang bus stop network. . |
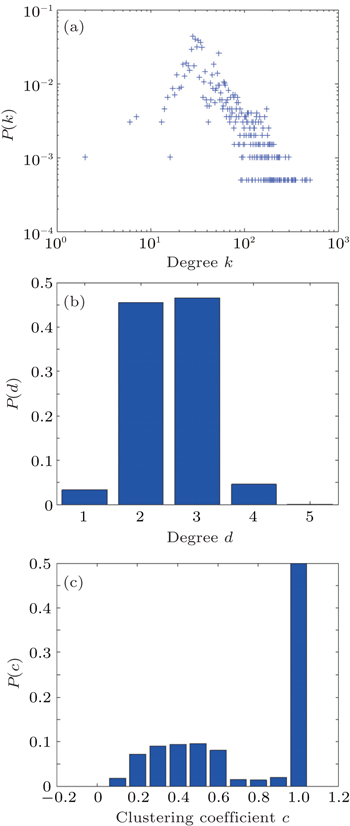
The distribution of degrees, clustering coefficient and distance of bus stop network are shown in Fig.
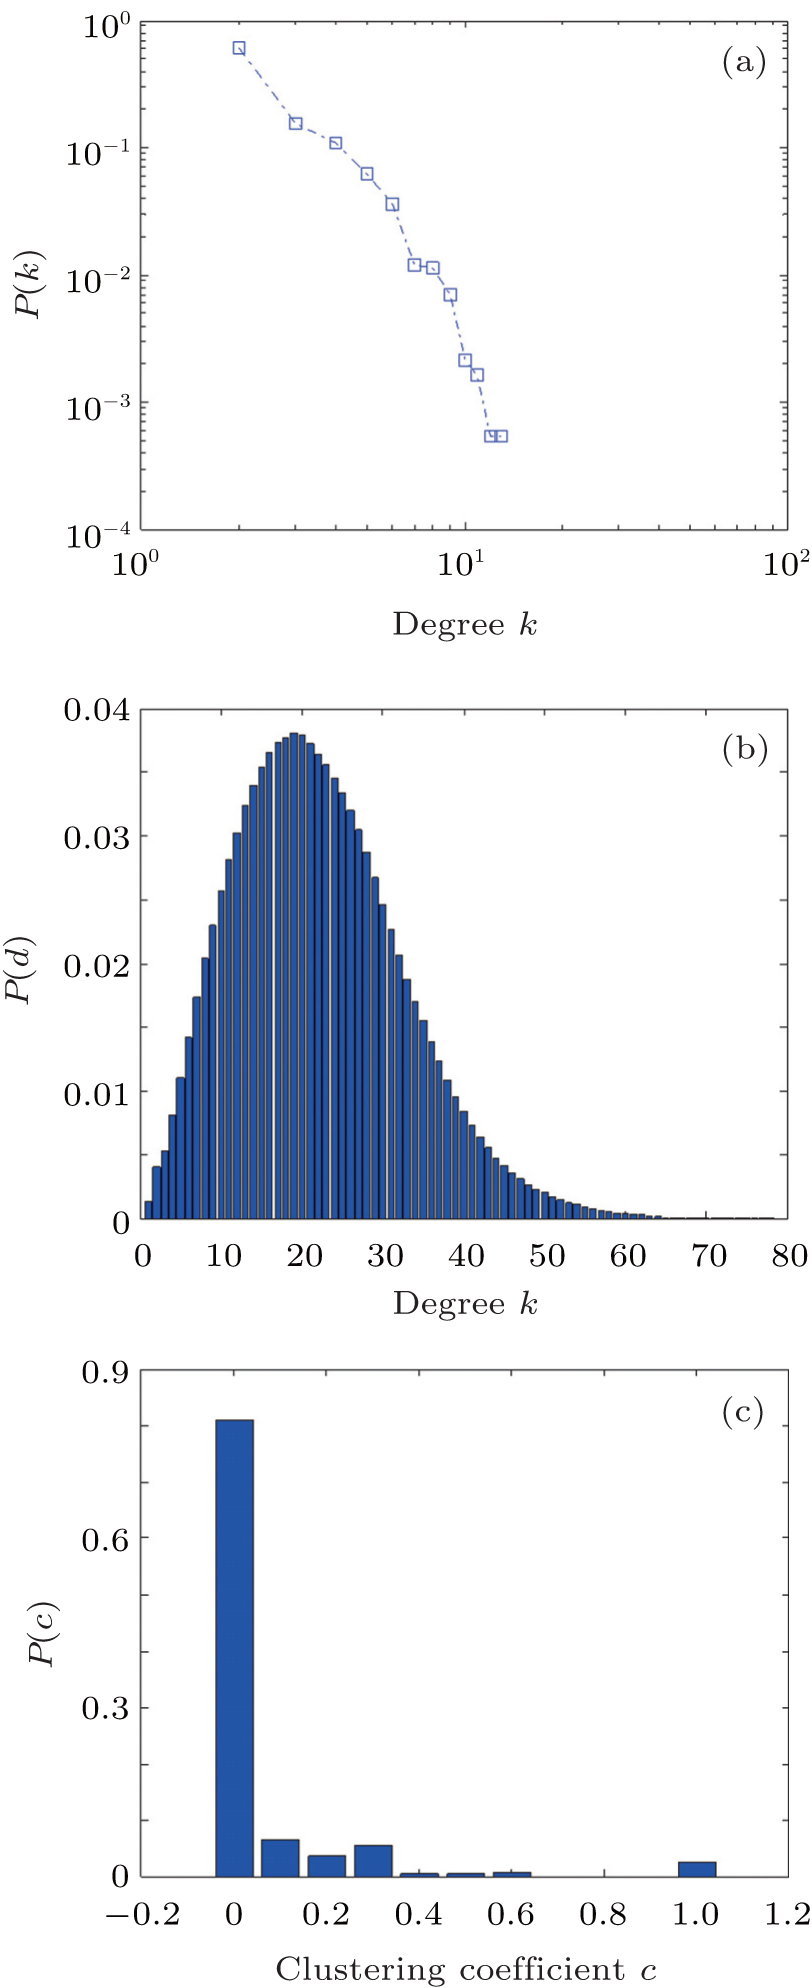 | Fig. 1. Characteristics of Shenyang bus stop network, (a) degree distribution of network, (b) distance distribution of network, (c) clustering coefficient distribution of network. |
From Fig.
From Fig.
The least transfer time means more convenient to travel by bus, so the transfer time is also an important factor for bus network. In bus transfer network, bus stops are also defined as nodes, however, an edge between two nodes exits if there is a direct bus line without transfer between two bus stops. In other words, if bus line A consists of nodes ai, i.e., A = {a1,a2,...,an} then in the bus transfer network the nearest neighbors of the node ai are the rest of the nodes in A.[15] Consequently, the node degree k in bus transfer network is the total number of stops which are reachable without transfer from this node. For some bus stops which are contained in only one bus line, k + 1 is the number of stops in this line. d is the distance between two nodes and d − 1 equals the number of transfer times from one stop to another stop. Therefore, bus transfer network can represent the actual situation about transfer between bus stops.
The degree of Shenyang bus transfer network is from 2 to 503, the average degree of the whole network is 64.95, and the degrees of the most nodes are in a range from 20 to 61. This means that most of stops in Shenyang can reach other 20 to 61 stops without transfer. A few stops with larger degrees are shown in Table
| Table 2. Top 5 stops with the larger degrees in Shenyang bus transfer network. . |
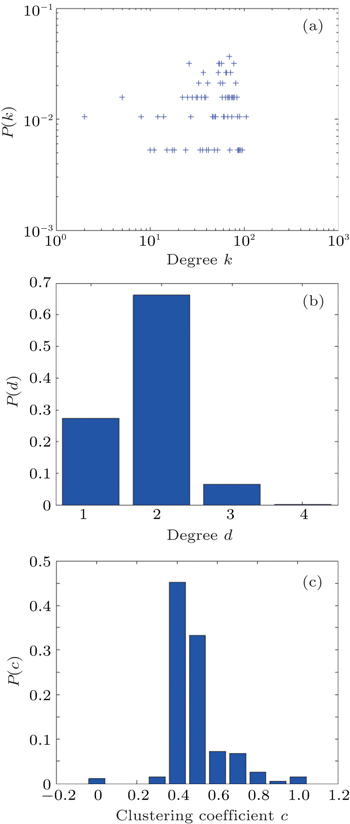
The distribution of degree, clustering coefficient and distance of bus transfer network are shown in Fig.
 | Fig. 2. Characteristics of Shenyang bus transfer network: (a) degree distribution of network, (b) distance distribution of network, and (c) clustering coefficient distribution of network. |
In addition, from Fig.
Usually, passengers may take more than one bus to their destinations, so it is necessary to find the relations between bus lines. For bus line network, we define bus lines as nodes, that is very different from the bus stop network and bus transfer network, and if two different bus lines (nodes) contain one or more the same bus stops, we define that there is an edge between the two lines (nodes), in fact, these bus stops are transfer stops. The node degree k in this topology is the number of the other bus lines to which passengers can transfer. And the distance d can be explained as the number of transfer times through one line to another. Therefore, bus line network can describe the bus transfer between different bus lines.
Also, we take the Shenyang bus network for example, and there are 192 nodes and 5049 edges in bus line network. The degree of this network is in a range of [1, 105], the average degree of the whole network is 52.594, which means that one bus line may intersect with other 52 lines on an average. The top five lines with larger degrees are shown in Table
| Table 3. Top 5 bus lines with the larger degrees in Shenyang bus line network. . |
The distribution of degree, clustering coefficient and distance of bus line network are shown in Fig.
 | Fig. 3. Characteristics of Shenyang bus line network: (a) degree distribution of network, (b) distance distribution of network, and (c) clustering coefficient distribution of network. |
Clustering coefficient in bus line network determines the density of the same bus stops shared by the neighbor bus lines. As shown in Fig.
In this section, the invulnerabilities of urban bus network are analysed for both static single layer model and layered model based on the real data of Shenyang bus network. We propose a new way to study the robustness of the urban bus network.
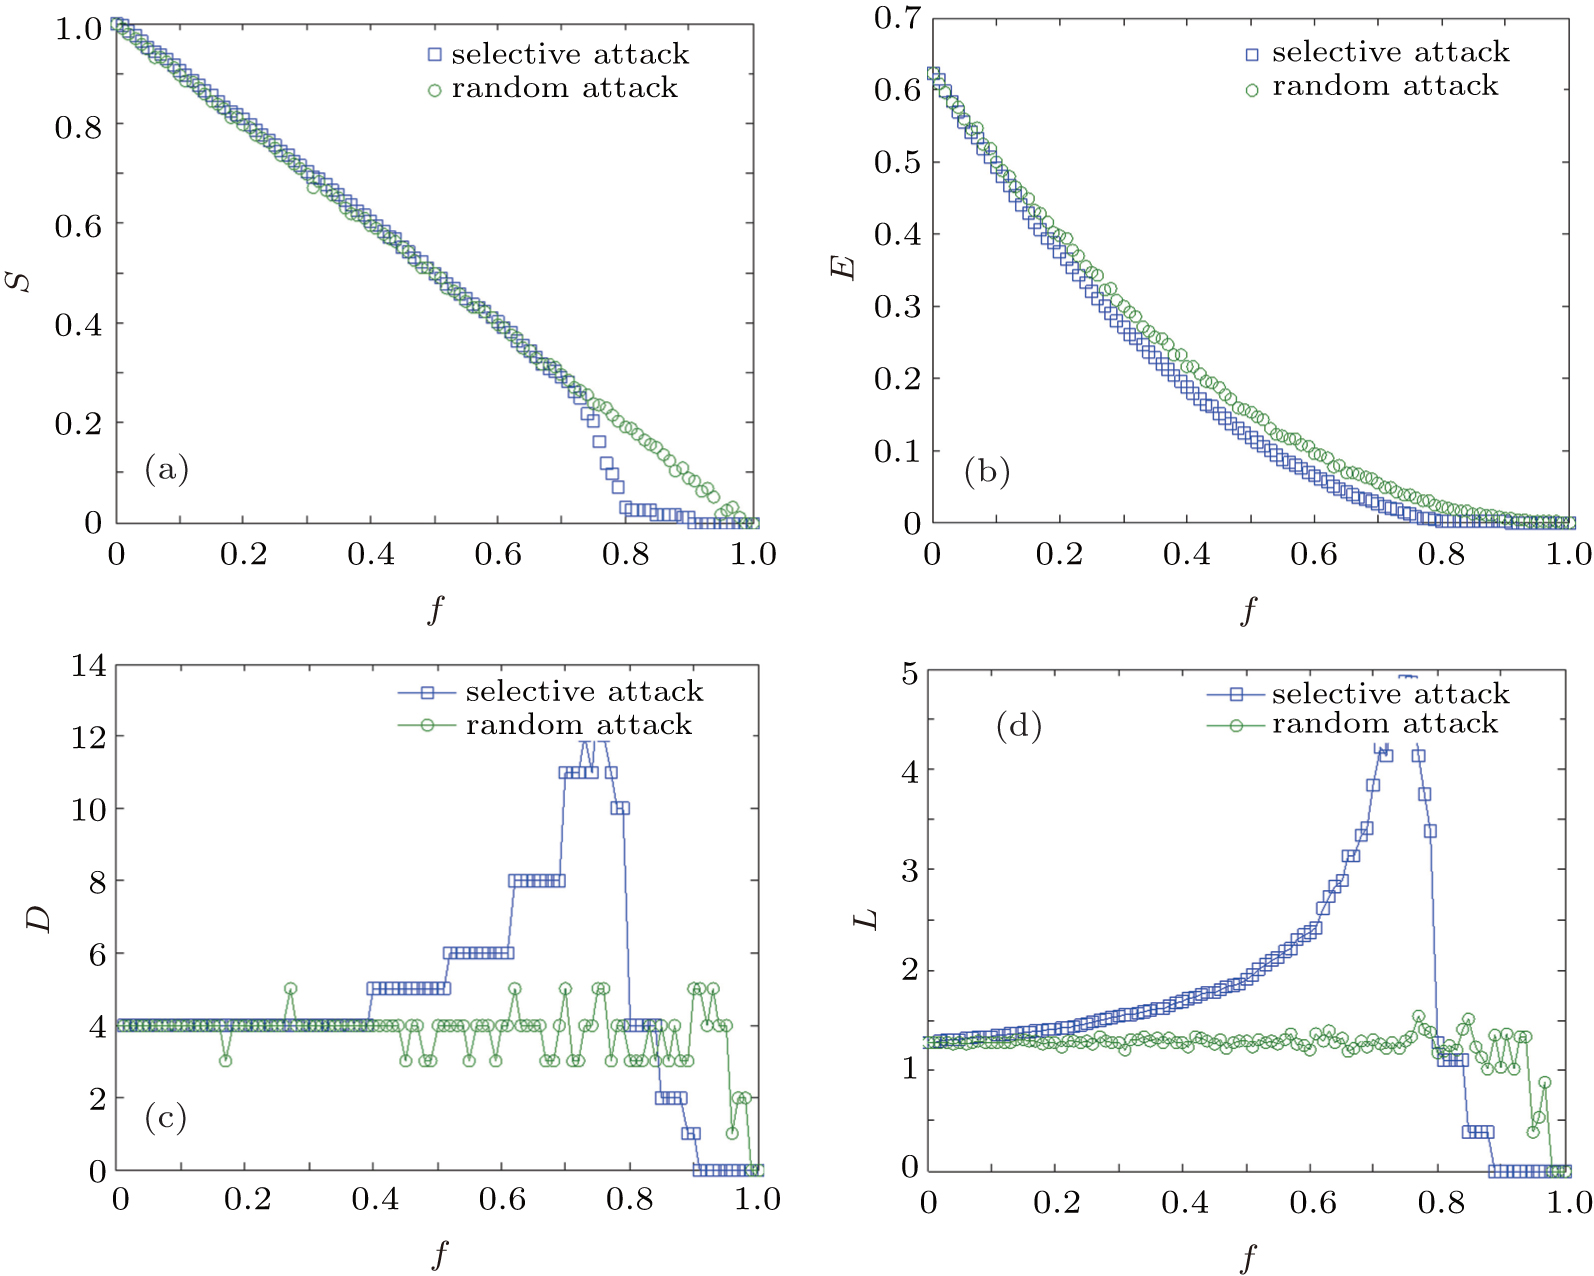
We choose selective attack and random attack for invulnerability analysis. For the selective attack strategy, we remove some nodes with higher degrees according to their degree order from high to low. For the random attack strategy, the nodes are removed randomly. The main evaluation indexes are defined as follows.[25,37,38]
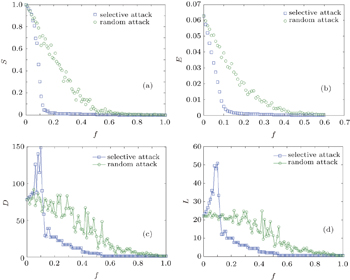
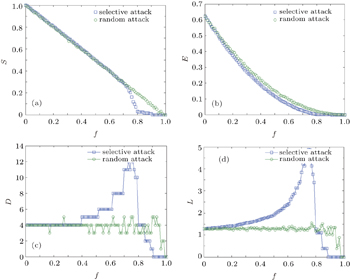
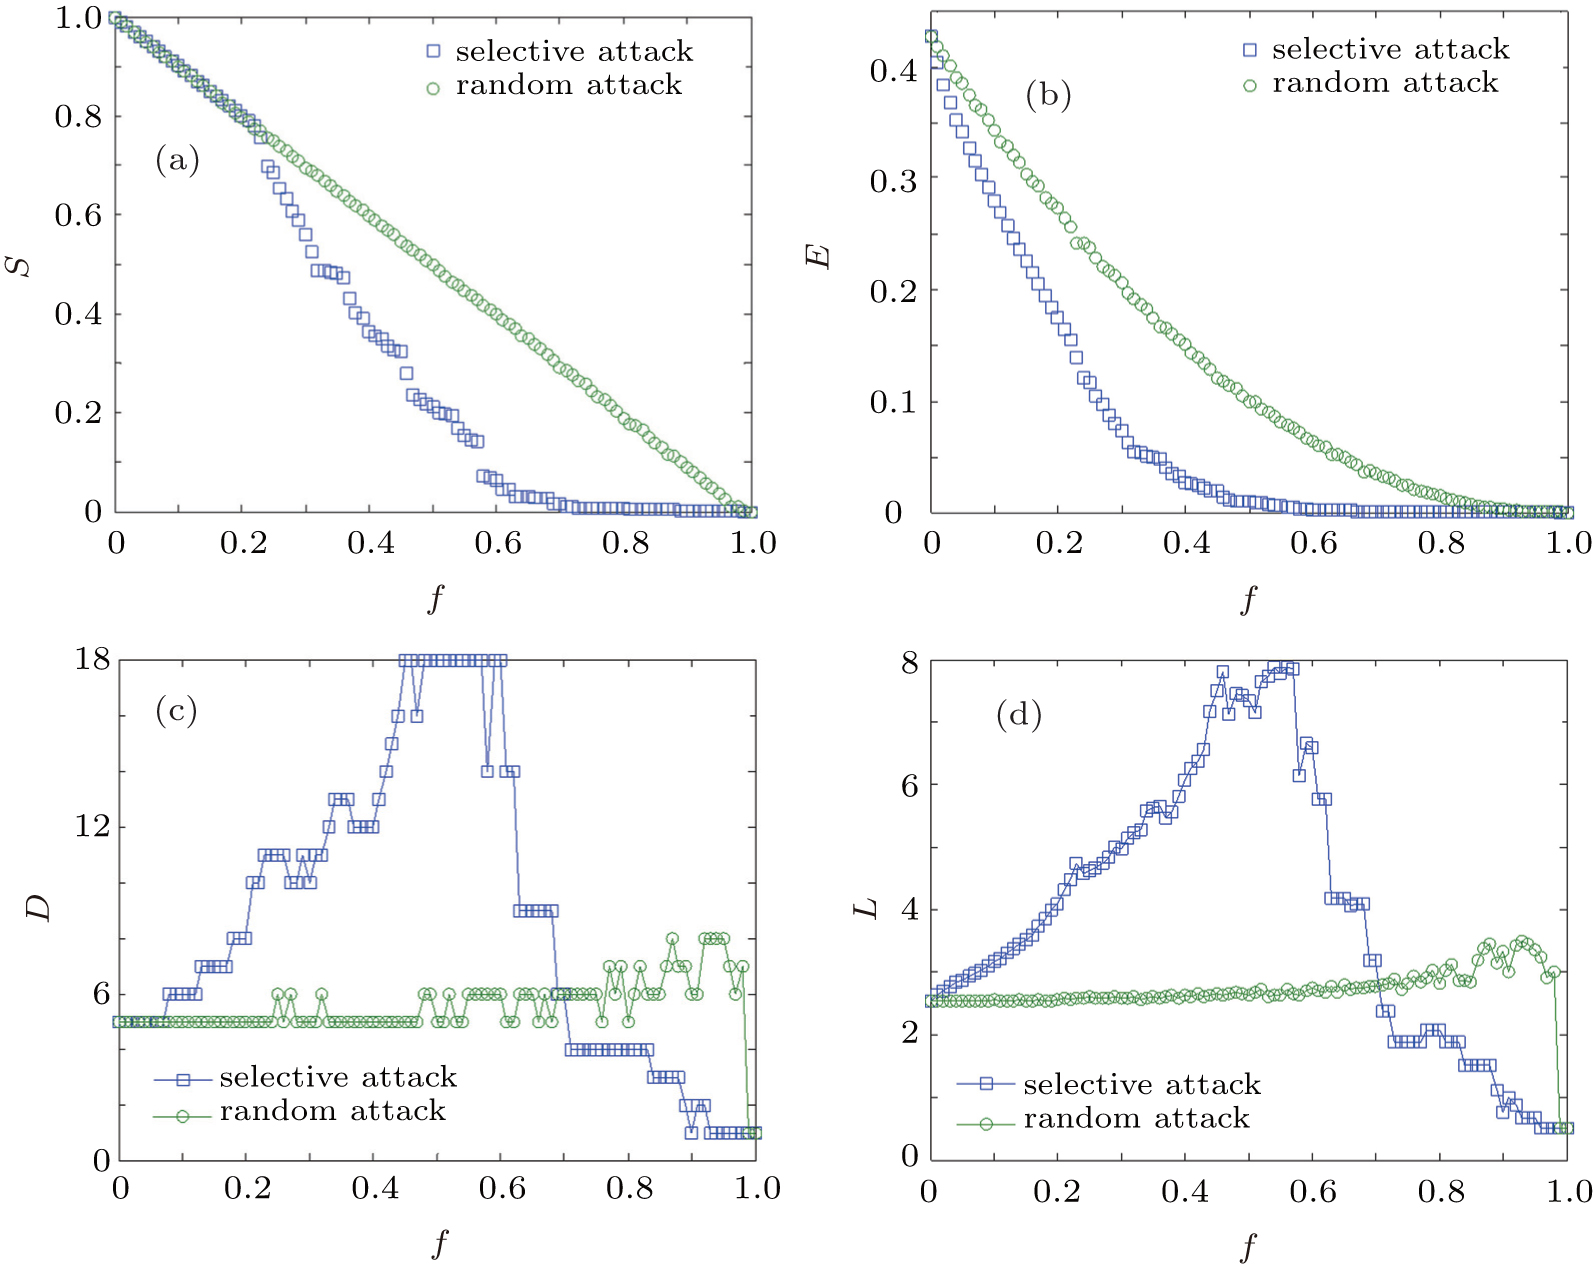
Based on the bus stop network we built, we take Shenyang bus network for example as shown in Figs.
 | Fig. 4. Attack results in Shenyang bus stop network: (a) relative size S, (b) network performance parameter E, (c) diameter D, and (d) mean path length L versus proportion of broken stops f. |
As shown in Fig.
As shown in Figs.
The invulnerability analysis about bus transfer network mainly focuses on the influence of transfer ability under attacks.
From Figs.
 | Fig. 5. Attack results in Shenyang bus transfer network, showing (a) relative size S, (b) network performance parameter E, (c) diameter D, and (d) mean path length L versus proportion of broken stops f. |
In addition, as shown in Figs.
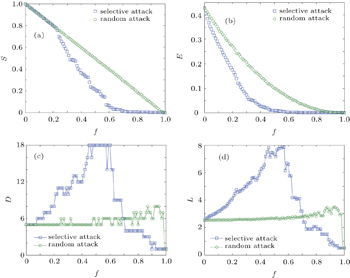
As shown in Figs.
 | Fig. 6. Attack results in Shenyang bus line network, showing (a) relative size S, (b) network performance parameter E, (c) diameter D, and (d) mean path length L versus proportion of broken stops f. |
As shown in Figs.
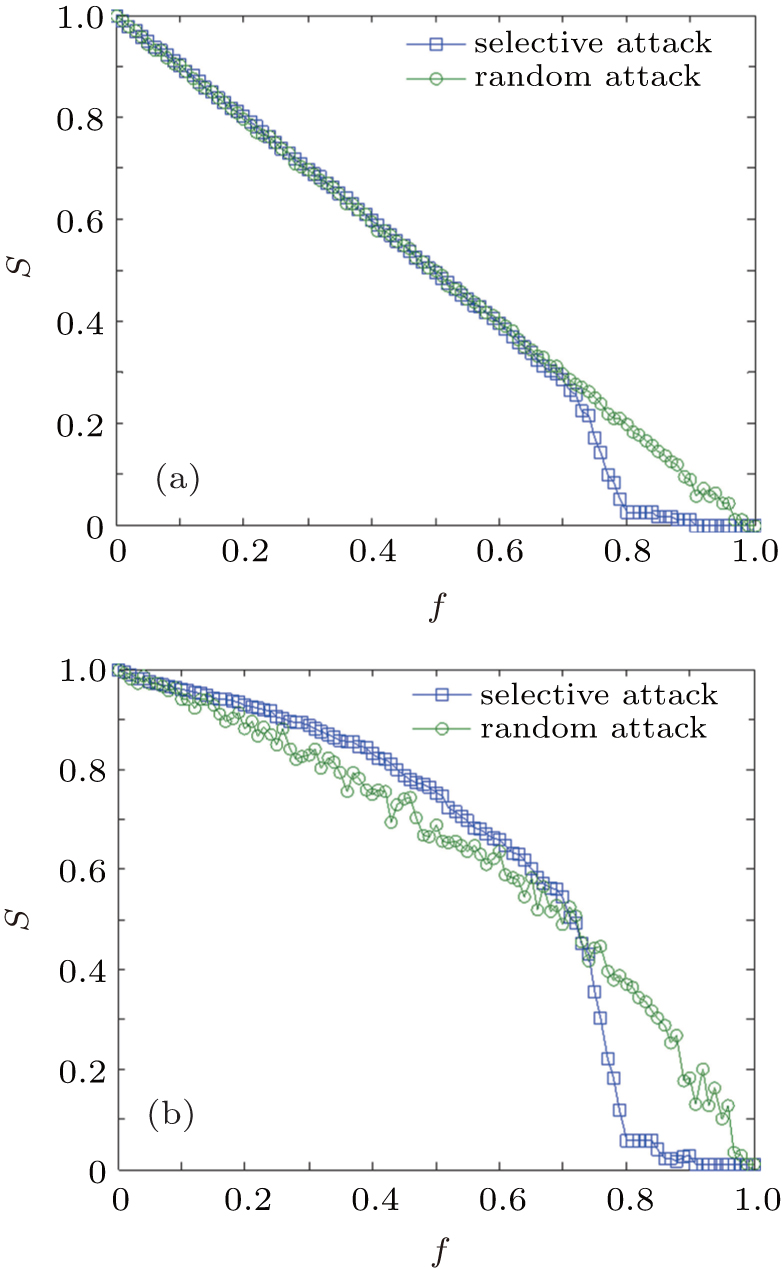
So far, we have studied the invulnerabilities of three single models respectively. But urban bus network is a complex system which cannot be revealed thoroughly by any network. In fact, the interactive correlation also exists between different models, and the bus stops, bus lines and the bus transfers will have effects on each other indirectly. So, we firstly will consider the interactive correlations between bus stop network and bus line network (named bus stop-line network) then find how the bus stops influence the bus lines; secondly, we will consider the interactive correlations between bus line network and bus transfer network (named bus line-transfer network), then find how the bus lines influence bus transfer. In this paper, both the bus transfer network and bus stop network choose bus stops as nodes, they cannot influence each other by removing the nodes, so it is unnecessary to consider the “bus stop-transfer network” here.
In the bus stop-line model, each bus line in the bus line network depends on several bus stops to transfer to other bus lines. So if these bus stops are broken down, the bus lines may disconnect with other lines in bus line network. In turn, if the bus line is broken down, transfer stops in this line cannot work and then the nodes in bus stop network will be destroyed. By taking Shenyang for example, the invulnerability of this layered model is analyzed.
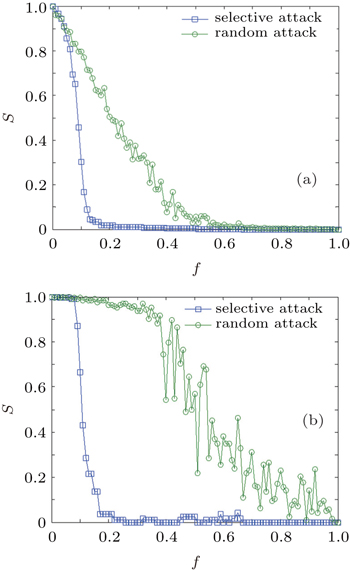
 | Fig. 7. Attack results in Shenyang stop-line network: (a) stop network, and (b) line network versus proportion of broken stops f in stop network. |
In Fig.
In addition, compared with the bus line network in the bus stop-line model, the bus stop network shown in Fig.
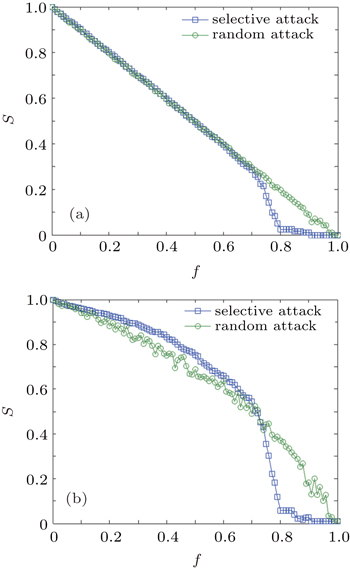
In the bus line-transfer model, each edge in the bus transfer network means that two bus stops are reachable without transfer. So if one node in the bus line network is broken down (one bus line is destroyed), some edges in the bus transfer network will be broken down too, then passengers cannot reach a stop directly due to the failure of this bus line. In turn, if transfer nodes in bus transfer network are broken down, edges which depend on transfer nodes between lines in bus line network will be broken down too. By removing lines in Shenyang bus line network, the invulnerability of this layered model is analysed in Fig.
 | Fig. 8. Attack results in Shenyang line-transfer network: (a) line network, and (b) transfer network versus proportion of broken stops f in line network. |
In Fig.
But in Fig.
From the above analyses based on both single layer and layered network, we find that for any model, the selective attack always causes more serious consequence than the random attack. Because the selective attack destroys the hub stops or lines, the hub stops or lines can affect the invulnerability of the bus network largely. So the managers should keep the hub bus stops or bus lines work unblocked and effective by reducing some project constructions there.
In addition, the comparison of the bus stop network with bus line network shows that the bus stop network is less robust and will affect the bus lines much more, that is to say, the break-down of bus stops may cause more serious result than that of the bus lines. So managers should pay more attention to the connectivity of bus stops than that of the bus lines
For the bus lines, some suburb area usually have only one bus line which may be isolated easily, therefore, for the bus network planning, bus lines in the suburb area need to be strengthened.
The static invulnerability analysis only considers the topological structure of the network, however, cascade failures will have more devastating results when the intrinsic dynamics of flows of physical quantities is taken into account.[30,39] And for better representing the characteristics of urban bus network, we construct the urban bus network with layered structure.
Multilayer structure network is well used in many fields. For instance, Each WWW or P2P link is mapped on the underlying IP network,[40] each complete logistic process is determined by the underlying delivery site. So, all the three models above are only a part of large urban bus systems.
In this paper, urban bus network will be viewed as a two-layer network, one layer represents the physical infrastructures while the other layer represents the logical layer, i.e., the passenger flows on the infrastructures. That is, the nodes in the physical layer are the bus stops and the edges are the bus lines connecting neighbor stops. The node in the logical layer is also the stop while the edge is the trip demand which connects the first and the last stop of a particular trip.
Considering the definitions of bus stop network, bus transfer network and bus line network above, the bus transfer network describes a kind of passenger flow while bus stop network represents the information about the bus lines, which is the physical infrastructure of the flow in fact.[41] So the layered bus network is composed of the bus stop network and the bus transfer network, which represents the physical layer Gφ = (Vφ, Eφ) and the logical layer Gλ = (Vλ, Eλ) respectively.
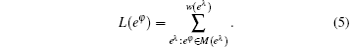
Because the logical layer represents the trip demand, we consider the logical layer as an undirected graph without the loads nor the capacity. And both layers have the same set of nodes (i.e. bus stops). Edge of logical layer is weighted by assigning it to physical layer, which is denoted by w(·) with w = 1. Each logical edge eλ = (uλ, vλ) is mapped on the physical graph as a physical path M(eλ) ⊂ Gϕ connecting the nodes uφ and vφ, correspondingly the uλ and vλ in the logical layer.[40] This path is based on the least transfer times and the least stops passing from start stop to end stop and if there are several equal choices, we randomly choose one of the paths. The set of paths corresponding to all logical edges is called mapping M(Eλ) from the logical topology to the physical topology. So now the load L(eφ) of the edges eφ in the physical layer is the sum of weights of all logical edges whose paths traverse this edge, and given as
Load on an edge in physical layer can be seen as the passenger flows traverse over it.[35] Considering economic limitation, capacities of routes are also considered. Following Motter–Lai model,[30] the capacities of an edge Cij in physical layer are defined as

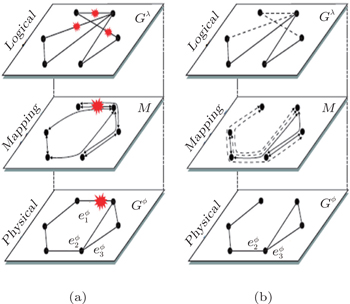
In the physical layer as shown in Fig.
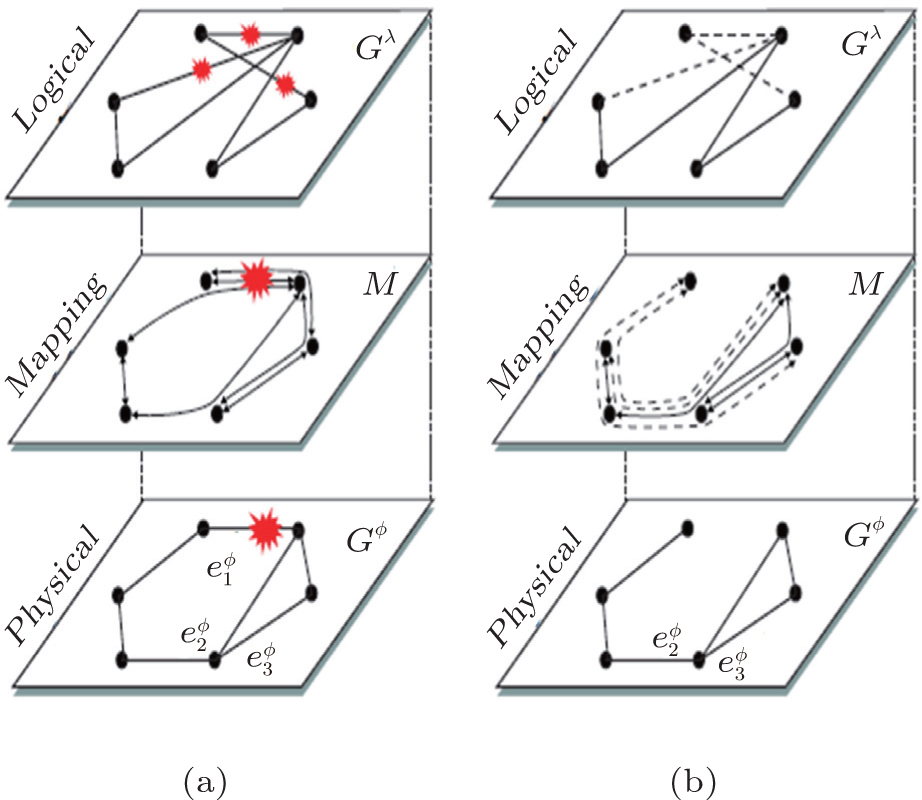 | Fig. 9. Illustrations of the method of redistribution, showing (a) effect propagation in two-layer system when eij is broken down, and (b) dashed lines are valid in logical layer under rerouting. |
Once an edge is broken in the physical layer, loads on this edge should be redistributed and some other edges will receive additional loads. If the total loads on other edges do not exceed their capacities, the cascading failures cannot be triggered. But if loads on the broken edge are high, after redistribution of the loads, some of the other edges are overloaded and then will be broken down. It will result in the further distribution of loads and may trigger cascading failures of the whole network finally. In the urban bus network, higer load means more passenger flows on infrastructures and edges with higher loads are the key routes in physical layer. The key edge is more representative and can influence the cascade failure progress largely.[35,38] So in this paper, we only remove several edges with higher loads in the physical layer.
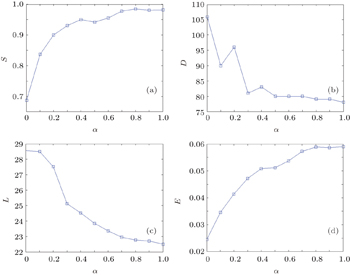
Here, we choose 4 parameters mentioned above, which are the relative size S, diameter D, mean path length L in the giant component, and network performance parameter E. At first, we remove top 10 edges with the highest loads. The results of the attack on the two-layer Shenyang bus network are shown in Fig.
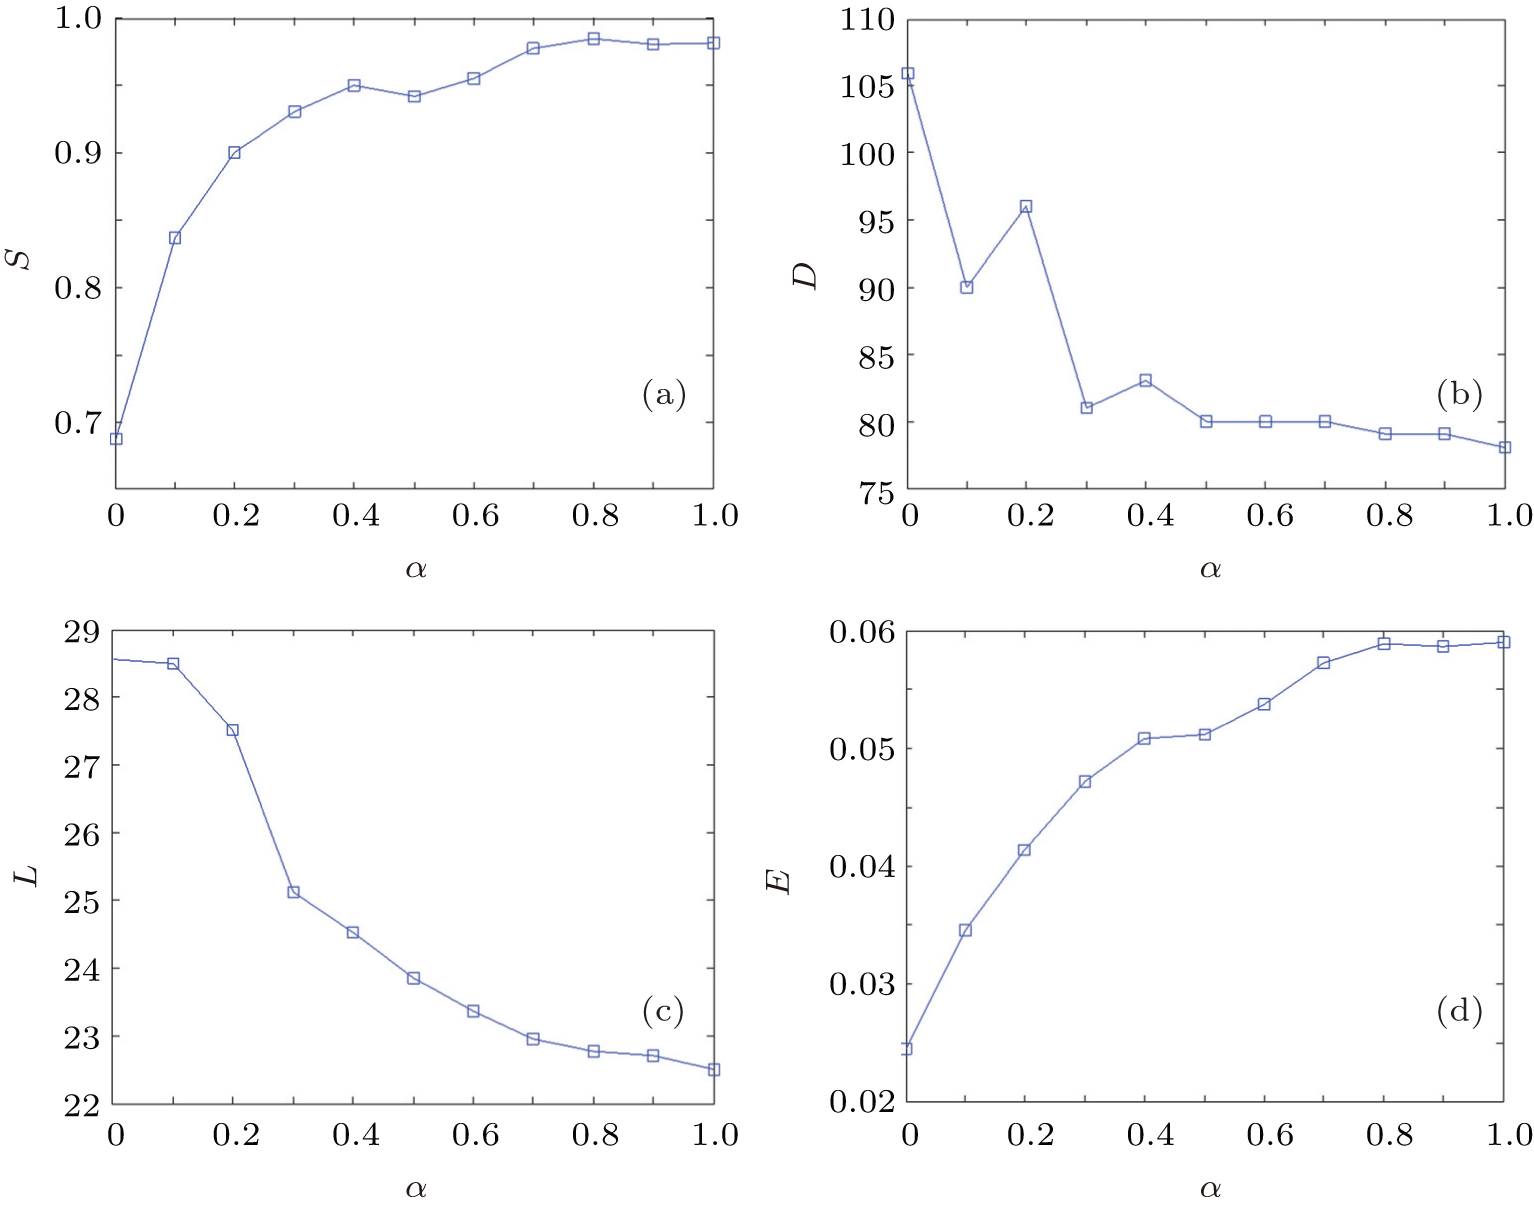 | Fig. 10. Attack results in physical layer (a) relative size S, (b) diameter D, (c) mean path length L, (d) network performance parameter E versus tolerance parameter α. |
In Fig.
But considering S, D, and E, the curves are more oscillatory than L. Furthermore, from Fig.
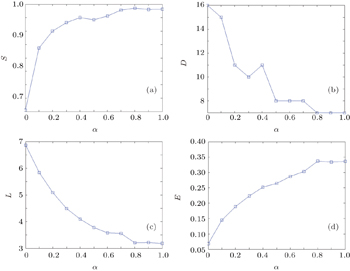
In Fig.
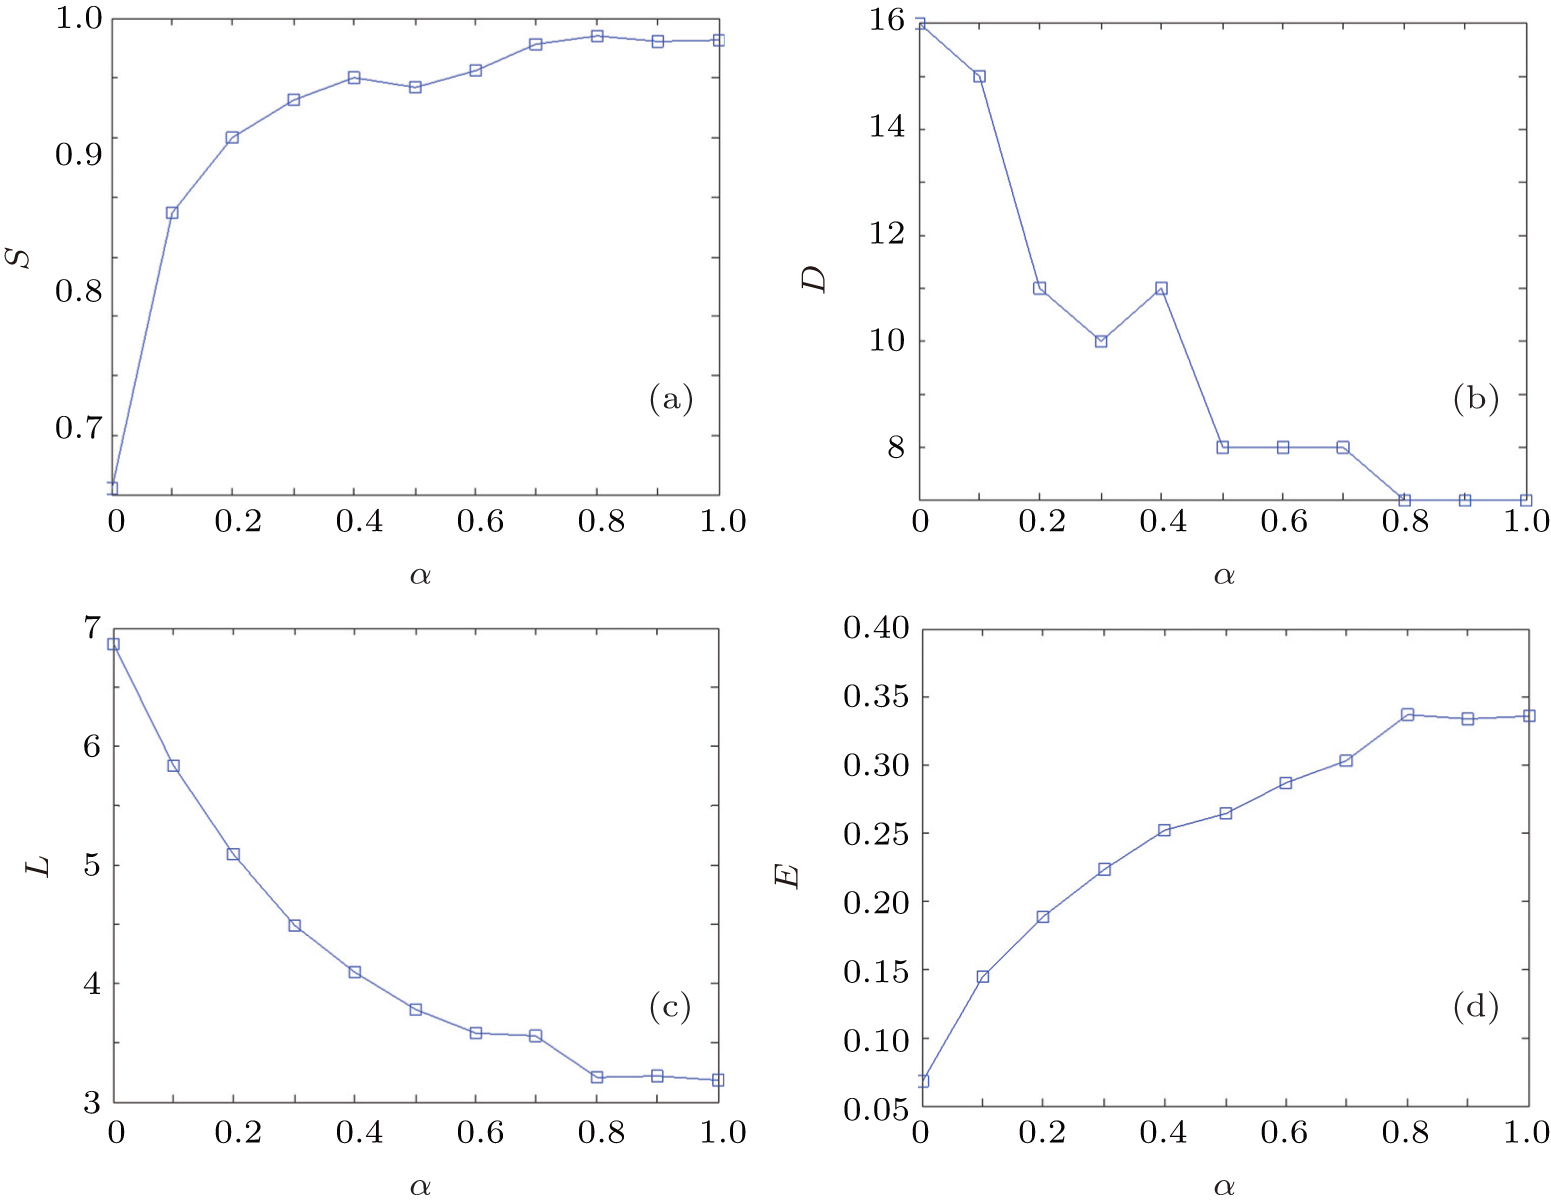 | Fig. 11. Attack results in logical layer, showing (a) relative size S, (b) diameter D, (c) mean path length L, and (d) network performance parameter E versus tolerance parameter α. |
In this subsection, we consider the passenger flows and analyse the dynamic cascade failures in the urban bus network. As a result, “load-reducing phenomenon” is found when some of the critical edges are broken down. According to this conclusion, when the congestion occurs, the managers may close some of the congested bus lines ephemerally between some bus stops (such as by changing the routes of the bus lines or taking no passengers at these bus stops), so the passengers will choose to go out later or change to other path which will reduce the loads in the congested lines. In fact, it is like the way of “odd-and-even license plate rule” in some big cities of China.
In this paper, we construct three static models (bus stop network, bus transfer network, and bus line network) to analyse the structures and the invulnerabilities of urban bus networks under two attack strategies. We find that bus stop network is robust under the random attack, but more fragile under the selective attack. In addition, attack on the bus transfer network shows less influence on transfer time under the random attack compared with on the bus stop network, but has huge impact under the selective attack. On the contrary, difference between two types of attacks in the bus line network is not obvious. Because bus lines, stops and transfers can influence each other. Furthermore, we analyze the invulnerabilities of the stop-line network and line-transfer network, and by using the proposed two layered networks, we study the interactions among three models. Then some suggestions for the urban bus network planning are made.
Finally, the cascades failures of urban bus network are analysed by constructing a two-layer bus network model. We find that properly increasing the capacity of the road will reduce the probability of cascading failure. Additionally, removing some of the critical edges between bus stops may reduce the loads of the bus network. We also give our suggestion for alleviating congestion.
| 1 | |
| 2 | |
| 3 | |
| 4 | |
| 5 | |
| 6 | |
| 7 | |
| 8 | |
| 9 | |
| 10 | |
| 11 | |
| 12 | |
| 13 | |
| 14 | |
| 15 | |
| 16 | |
| 17 | |
| 18 | |
| 19 | |
| 20 | |
| 21 | |
| 22 | |
| 23 | |
| 24 | |
| 25 | |
| 26 | |
| 27 | |
| 28 | |
| 29 | |
| 30 | |
| 31 | |
| 32 | |
| 33 | |
| 34 | |
| 35 | |
| 36 | |
| 37 | |
| 38 | |
| 39 | |
| 40 | |
| 41 |