


Li-ion batteries: Phase transition
[Hou Peiyu 1 , Chu Geng 2 , Gao Jian 2 , Zhang Yantao 1 , Zhang Lianqi 1, †,  ]
]
]
|
|


Project supported by the National High Technology Research and Development Program of China (Grant No. 2013AA050906) and the National Natural Science Foundation of China (Grant Nos. 51272175 and 21301127).
Progress in the research on phase transitions during Li + extraction/insertion processes in typical battery materials is summarized as examples to illustrate the significance of understanding phase transition phenomena in Li-ion batteries. Physical phenomena such as phase transitions (and resultant phase diagrams) are often observed in Li-ion battery research and already play an important role in promoting Li-ion battery technology. For example, the phase transitions during Li + insertion/extraction are highly relevant to the thermodynamics and kinetics of Li-ion batteries, and even physical characteristics such as specific energy, power density, volume variation, and safety-related properties.
The phenomenon of phase transitions and the resultant phase diagrams in Li-ion batteries (LIBs) are often observed in the synthesis of materials, electrochemical reaction processes, temperature changes of batteries, and so on. Understanding those phenomena is crucial to design more desirable materials and facilitate the overall development of LIBs. For instance, if the conditions of phase transition such as sintering temperature or composition are well known, more excellent materials for LIBs can be designed and prepared. [ 1 ] Such knowledge is also beneficial for choosing an electrolyte that is more stable during the electrochemical reaction process. [ 2 ] Thermodynamics and kinetics of phase transition have to be discussed first, as far as the study of phase transition is concerned. It should also be noted that the investigations and understanding of those phase transitions in LIBs now from macro to micro and from thermodynamics to kinetics are gradually being realized on the basis of newly developed advanced characterization techniques. Thus, advanced study tools play a significant role in understanding phase transition clearly and in depth.
The thermodynamics of phase transition may be used to estimate whether one kind of phase transition reaction can occur or not. Usually, transformations between different ordering structures or from ordered to disordered structure occur during the process of phase transition. Phase transitions were first classified by Paul Ehrenfest according to the continuity of thermodynamic potential as well as its derivative. Thermodynamic potential can be defined as Γ = F + PV , where F is free energy. The phase transitions during the electrochemical process in LIBs due to Li + extraction/intercalation have been investigated widely. For this kind of phase transition, Gibbs free energy is adopted. The most direct expression of thermodynamics can be described using the Nernst equation as follows:

One is first-order phase transition, which typically appears in such electrode materials as LiFePO 4 . Its charge– discharge curves can usually be presented as “L” shapes, indicating a clear potential plateau during Li + extraction/ intercalation due to formation of a distinct new structural phase. The voltage can be calculated as follows:
The second behaves as a second-order phase transition. A typical charge–discharge “S” shape curve is usually observed, meaning a continuous change in electrochemical potential due to continuous formation of solid solution phases. It can be seen in most of the range of Li + extraction/intercalation in LiCoO 2 . The voltage can be calculated as follows:
Phase transition can occur according to the thermodynamics, but this does not mean that the phase transition reaction can really be observed, due to the kinetics limitation. It is associated with the speed of the phase transition reaction. The speed of the electrochemical reaction during the process of Li + extraction/intercalation is not only related to intrinsic ionic and electronic transfer of materials, but is also related to the interface between electrode and electrolyte. It is a complex and continuous reaction process. The inferior kinetics during the process of Li + extraction/intercalation can cause huge polarization and thus an incomplete electrochemical reaction or even a disappearance of reaction. In order to improve the phase transition reaction speed of electrode materials, researchers have put forward many solutions, such as decreasing the size of the primary particle [ 3 ] and foreign element doping, [ 4 ] to improve the ionic and electronic conductivity of the electrode materials. However, the nanocrystallization method cannot solve all the polarization problems. [ 5 ] Until now, most of the research work on phase transition during the process of Li + extraction/intercalation has been performed from the aspect of thermodynamics. With the rapid development of modern advanced characterization tools, especially for micro-, nano- and in situ techniques, kinetic investigations of phase transition reactions are being realized gradually. Therefore, advanced characterization tools become more and more important for thoroughly understanding the nature of phase transition reactions.
Almost all the research methods used to study the material structure in other fields can also be applied to investigating the phase transitions of LIBs. Among them, x-ray diffraction (XRD) technology is the most direct method to distinguish the phase structure of LIBs materials. Thus, it has been widely used in researching phase analysis and studying phase transitions. [ 6 ] However, some special phase structures cannot be distinguished well by the diffraction method, so other local characterization methods such as Raman spectra have to be adopted. [ 7 ] Transmission electron microscopy (TEM) is also a powerful tool to get the microstructure information of materials, especially to obtain high spatial resolution. [ 8 ] Only recently could lithium ions be seen directly via electron microscope imagery, by using the spherical aberration correction electronic microscopy. [ 9 ] Some in situ experimental techniques are also being developed to understand in depth the structural changes of electrode materials during Li + extraction/ insertion. The characterization methods now available for LIBs, with different spatial resolution levels, have been summarized, [ 10 ] as shown in Fig.
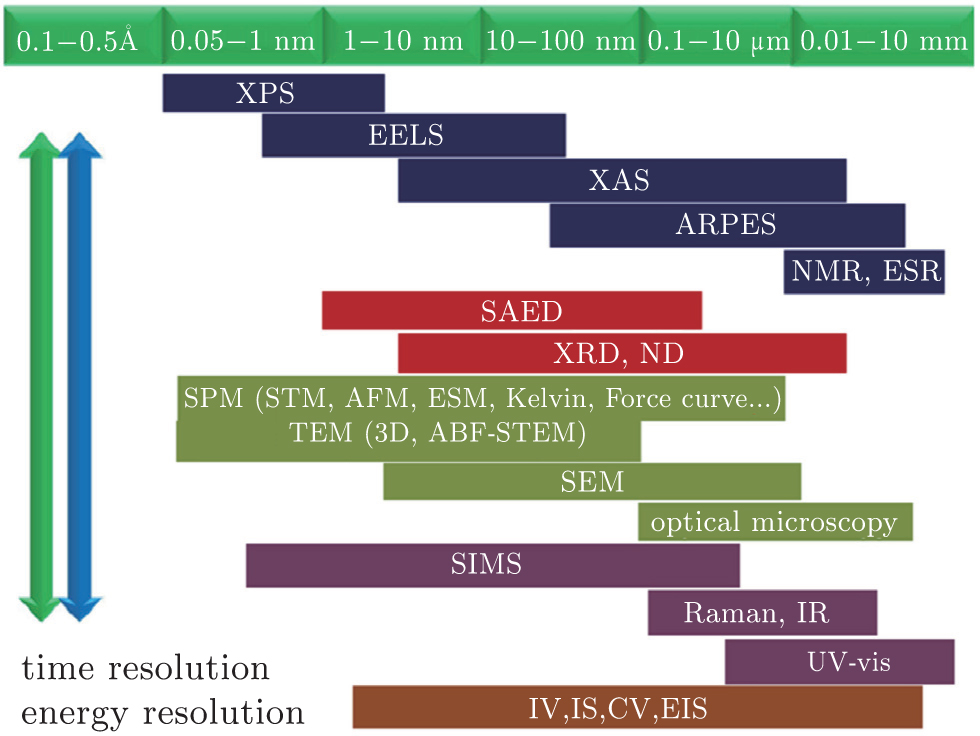 | Fig. 1. Characterization techniques with different spatial resolution. [ 10 ] |
Phase transitions can also be studied by such theoretical methods as first principles calculation. Theoretical calculations can guide us in developing new electrode materials, [ 11 – 13 ] optimizing structures of multiphase materials, [ 11 ] stabilizing the phase under different experimental conditions, [ 12 , 13 ] exploring the paths of reaction or decomposition, [ 14 ] etc. Some research results will be mentioned below. Ceder’s group at M.I.T., by combining first principles calculations with a crystal structure database, calculated properties of a large number of LIB electrode materials. This kind of research is named the “materials genome initiative (MGI)”.
Below, three typical electrode materials, LiCoO 2 , LiFePO 4 cathode and Si anode, are taken as examples to illuminate the study of phase transitions during the process of Li + extraction/intercalation in LIBs from the viewpoints of thermodynamics, kinetics, and characterization methods.
The first commercialized cathode material of LIBs is the layered LiCoO 2 , which still dominates the portable electric device market due to high volumetric density. [ 15 , 16 ] LiCoO 2 prepared by a conventional high-temperature solid state reaction method has an O3 structure in which the oxygen anion has a cubic close-packed arrangement in the form of ABCABC. During the electrochemical process, many complex phase transitions, especially in the lithium extraction stage are involved. In the past 30 years, plenty of investigations have focused on these phase transitions to understand the reactions and structural evolution mechanisms. The main investigations with respect to thermodynamics and dynamics are summarized here.
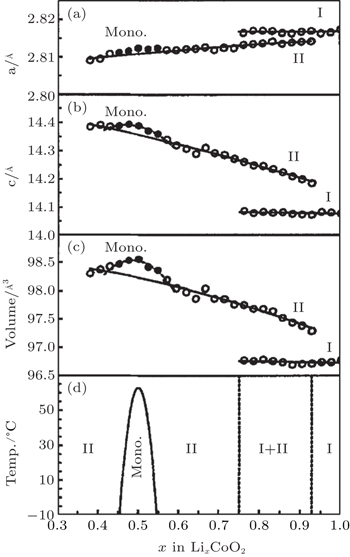
The pioneering work on identification of phase transitions during Li + insertion/extraction process was carried out by Dahn and Ohzuku et al. [ 17 – 19 ] As x varies from 1.0 to 0.3, Li x CoO 2 evolves mainly in successive solid solution forms, which are considered to be second-order phase transitions. However, during the course, three first-order phase transitions are also clearly observed, as shown in Fig.
 | Fig. 2. Unit cell constants (a), (b) and cell volume (c) as functions of lithium concentration x in Li x CoO 2 , as well as a global phase diagram (d) based on the results (a)–(c) for Li x CoO 2 . [ 17 ] |
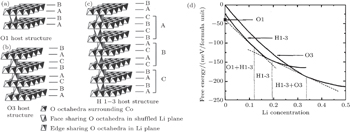
The phenomenon of phase transitions occurring in Li x CoO 2 in the low Li content range (0 ≤ x ≤ 0.5) are somewhat difficult to make clear according to the reports. [ 17 – 28 ] The earlier works by Ohzuku and Ueda [ 19 ] indicate that the reaction proceeds in a topotactic manner, i.e., two-phase reactions (0 < x < 1/4 and 3/4 < x < 1) and a single-phase reaction (1/4 < x < 3/4) in Li x CoO 2 . Another monoclinic phase ( a = 4.91 Å, b = 2.82 Å, c = 5.02 Å, and ß = 111.4°) was observed in 1/4 < x < 0 in addition to that at about x = 0.55 ( a = 4.90 Å, b = 2.81 Å, c = 5.05 Å, ß = 108.3°). Possible lithium ordering at x = 1/4 and 3/4 for this type of material was described in terms of a [2×2] superlattice in a triangular lattice of sites. In 1996, structural characterization of Li x CoO 2 with x values was studied for the first time via in situ x-ray diffraction. [ 23 ] The analysis reveals that as x approaches 0 an increase in crystallographic quality occurs, rather than the expected destruction of the core structure of Li x CoO 2 by a drastic increase in structural disorder. For the first time, the end member CoO 2 phase was isolated and detected. This CoO 2 phase was certified to be a hexagonal single-layered phase (O1 stacking, Fig.
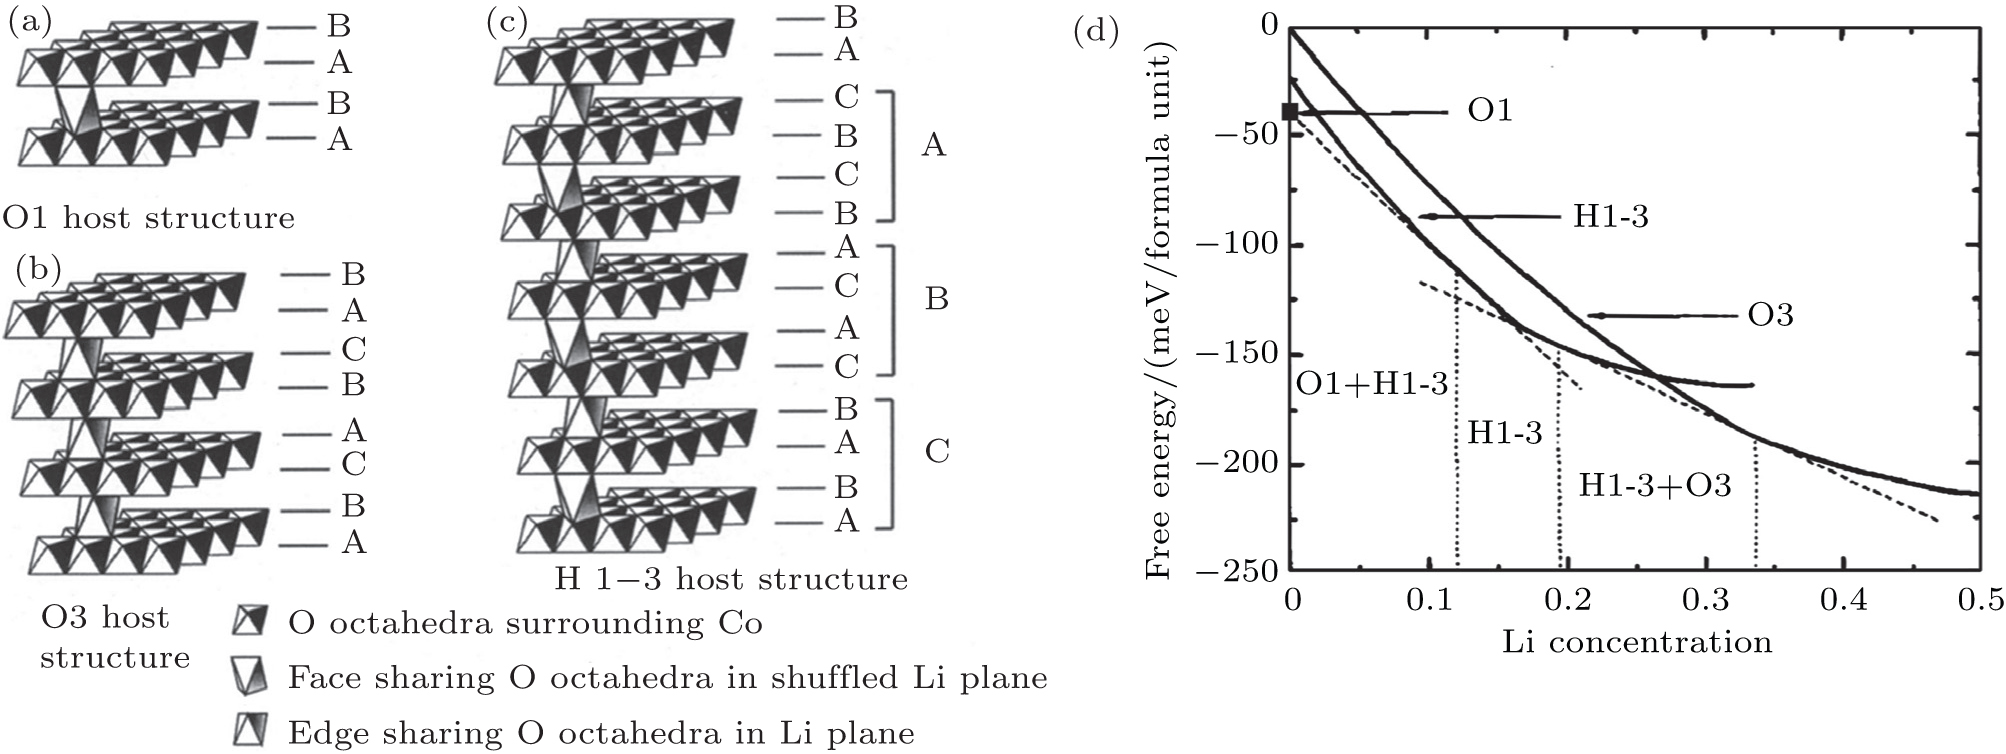 | Fig. 3. Schematic illustration of the three host structures of Li x CoO 2 : O1 (a), O3 (b), and H1-3 (c). The vertices of the octahedra correspond to oxygen ions. Upper case letters describe the stacking of the close-packed oxygen layers. (d) Free energy curves as a function of Li concentration at T = 30°; regions separated by vertical dashed lines indicate the concentration intervals in which different host structures are stable. [ 24 ] |
In addition to thermodynamically stable O3 host structures for LiCoO 2 , a thermodynamically metastable O2- structured LiCoO 2 was also demonstrated to exist by experimental and theoretical studies. [ 25 – 27 ] Unlike the O3 structure, the O2 structure must be prepared by the ion-exchange route. In the O2 structure, such new phases as T#2, T#2’ and O6 have been proposed. Usually, a phase transition between O3 and O2 structures is believed to be impossible. Nevertheless, Lu et al. [ 28 ] first observed O2-Li x CoO 2 in the phase diagram of O3-LiCoO 2 using spherical aberration-corrected scanning transmission electron microscopy (STEM) with high-angle annular-dark-field (HAADF) and annular-bright-field (ABF) techniques. Furthermore, in Lu’s work, O1, O2, and O3 structures were all detected clearly on the basis of HAADF micrographs, as indicated in Fig.
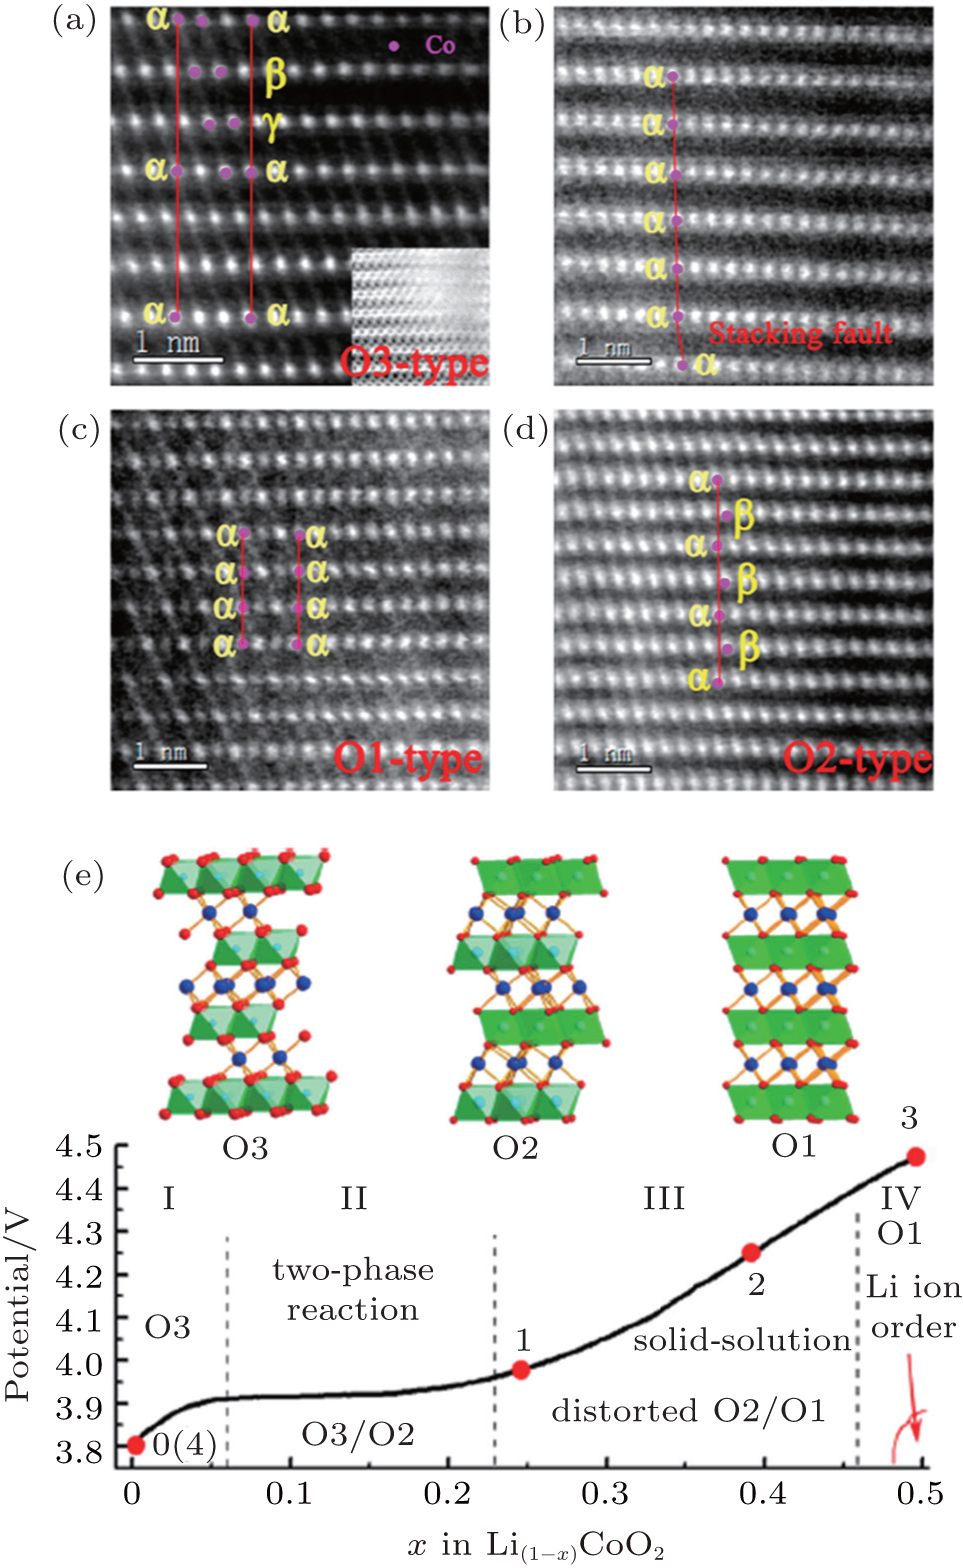 | Fig. 4. STEM-HAADF images of surface structure: (a) pristine LiCoO 2 , (b) LiCoO 2 charged to 4.2 V, (c) charged to 4.5 V, and (d) discharged to 3.0 V at the [010] zone axis. (e) Phase diagram of Li x CoO 2 (1 ≤ x ≤ 0.50) nanoparticle. Numerical symbols 0-4 represent the sample points for STEM observation: (0) pristine LiCoO 2 , (1) charged to 3.9 V, (2) charged to 4.2 V, (3) charged to 4.5 V, and (4) back to 3.0 V. [ 28 ] |
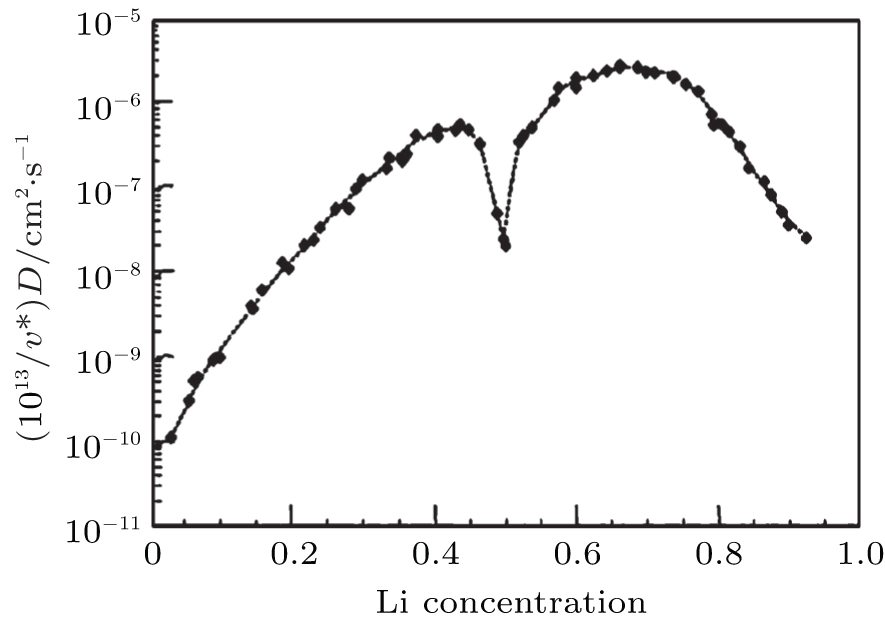
We have mainly discussed the phase transitions from the thermodynamics view. However, whether the phase transition can be observed clearly or even occur at all sometimes depends strongly on kinetic factors such as electric conductivity and Li + chemical diffusion coefficient versus Li + concentration in Li x CoO 2 . Some research activities in those aspects have been performed. Brake et al. [ 29 ] studied the variation of the Li + diffusion coefficients for Li x CoO 2 as a function of the lithium concentration during the lithium insertion reaction. Kinetics investigation reveals that the average diffusion coefficient for the composite Li x CoO 2 is in the range of 10 −9 cm 2 ·S −1 , indicating relatively uncomplicated reaction kinetics for the lithium insertion reaction. The variation of the diffusion coefficient in the insertion range 0.3 < x < 0.85 is consistent with filling/removal of Li + from a single site within the host lattice over this particular composition range. At a composition of around x = 0.65, the diffusion coefficient reaches a local minimum. Within the compositional range described, there exists a two-phase system with the phase transition. [ 17 ] The structural rearrangement therefore takes place as lithium is inserted or extracted from lattice sites. Subsequently, Ven et al. [ 30 ] investigated the mechanisms of Li + diffusion in Li x CoO 2 via first principles and found that Li + diffusion occurs predominantly by a divacancy mechanism. The calculation of the diffusion coefficient at 400 K with kinetic Monte Carlo simulations shows that diffusion efficiency initially increased by several orders of magnitude with x as a result of the decrease in activation barrier with x , as indicated in Fig.
 | Fig. 5. Calculated diffusion coefficient (D) with lithium concentration, x in Li x CoO 2 . [ 30 ] |
Olivine-type LiFePO 4 , proposed by Goodenough et al. [ 31 , 32 ] in 1997, has achieved considerable attention due to the chemical stability, safety characteristics, environmentfriendliness and low cost. The crystal structure of LiFePO 4 can be viewed as an ABAB oxygen sublattice with Li, Fe, and P occupying a subset of octahedral and tetrahedral interstitial sites respectively, having the space group of Pmnb with the following unit-cell parameters: a = 6.011(1) Å, b = 10.338(1) Å, c = 4.695(1) Å. [ 33 – 36 ] Improving the rate capability of LiFePO 4 is scientifically interesting and practically significant because of its electronic insulator and mediocre ionic transport property. [ 37 – 42 ] Next, recent achievements with regard to phase separation and structural evolution mechanisms of LiFePO 4 involving thermodynamics and kinetics during the Li + extraction/intercalation process are summarized.
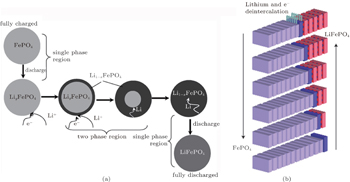
To our knowledge, in terms of the electrode materials, the large variations of Li + concentration always lead to phase transformations during the charge and discharge processes, such as order–disorder transitions, crystallographic changes and two-phase reactions. [ 43 ] When cycling at room temperature for LiFePO 4 , the Li + extraction from a lithiated triphylite phase, LiFePO 4 , occurs through a first-order phase transformation to a delithiated heterosite phase, FePO 4 . [ 44 ] Phase transformation research has focused on the LiFePO 4 /FePO 4 two-phase transition and the existence of Li α FePO 4 and Li 1− β PO 4 solid solutions. [ 45 ] In order to understand the twophase reaction in LiFePO 4 , Andersson et al. [ 46 ] introduced two models: “radial model” and “mosaic model”. Both models pinpoint the inactive LiFePO 4 unconverted in the charge process as the essence of lost capacity in the system. Srinivasan et al. [ 47 ] developed a “shrinking core” mathematical model to study the cause of low power capacity as shown in Fig.
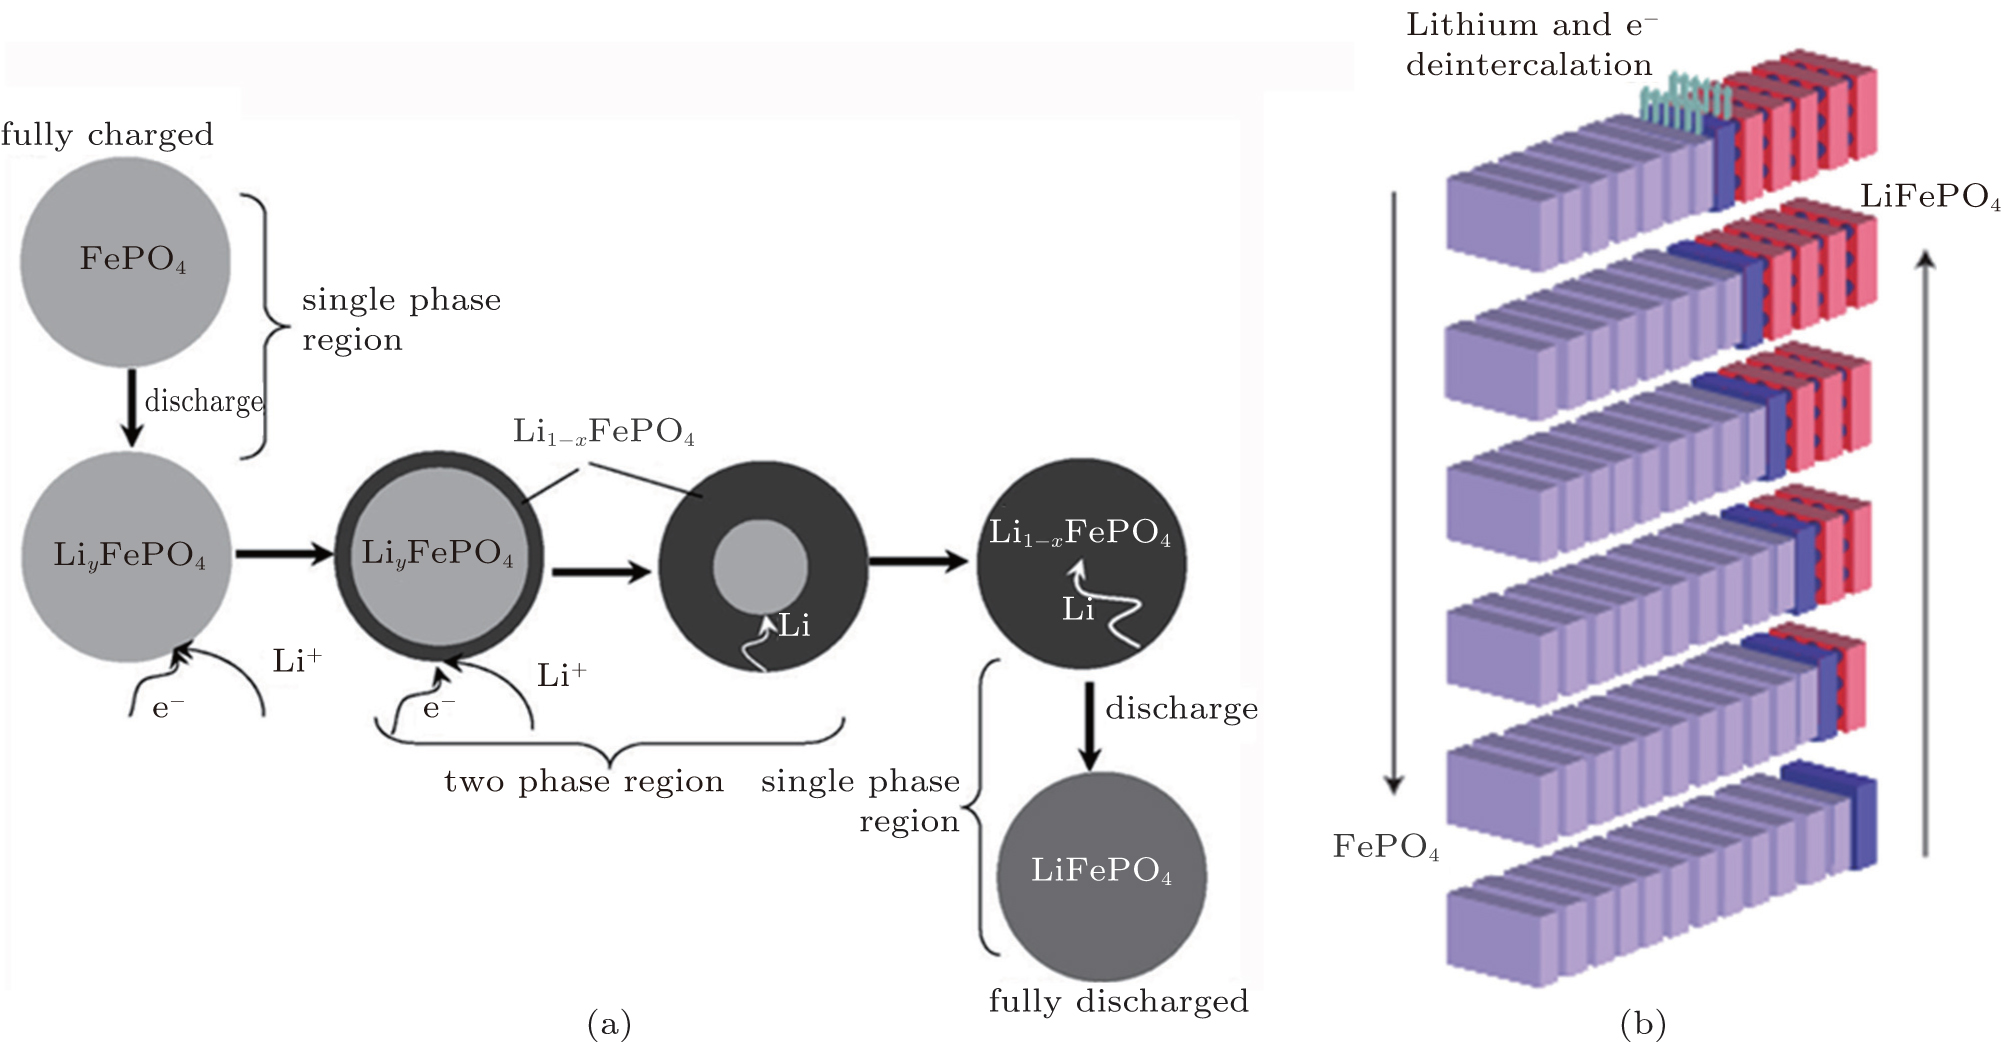 | Fig. 6. Illustration of (a) shrinking-core model with the two phases and the movement of the phase boundary. [ 47 ] (b) Layered view of the ‘domino-cascade’ mechanism of the lithium deintercalation/intercalation mechanism in a LiFePO 4 crystallite. [ 48 ] |
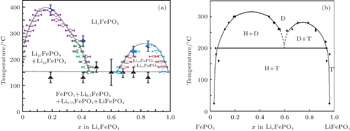
In contrast to the well-documented two-phase nature of Li x FePO 4 at room temperature, Delacourt et al. [ 50 ] and Dodd et al. [ 51 ] summarized the phase diagrams shown in Fig.
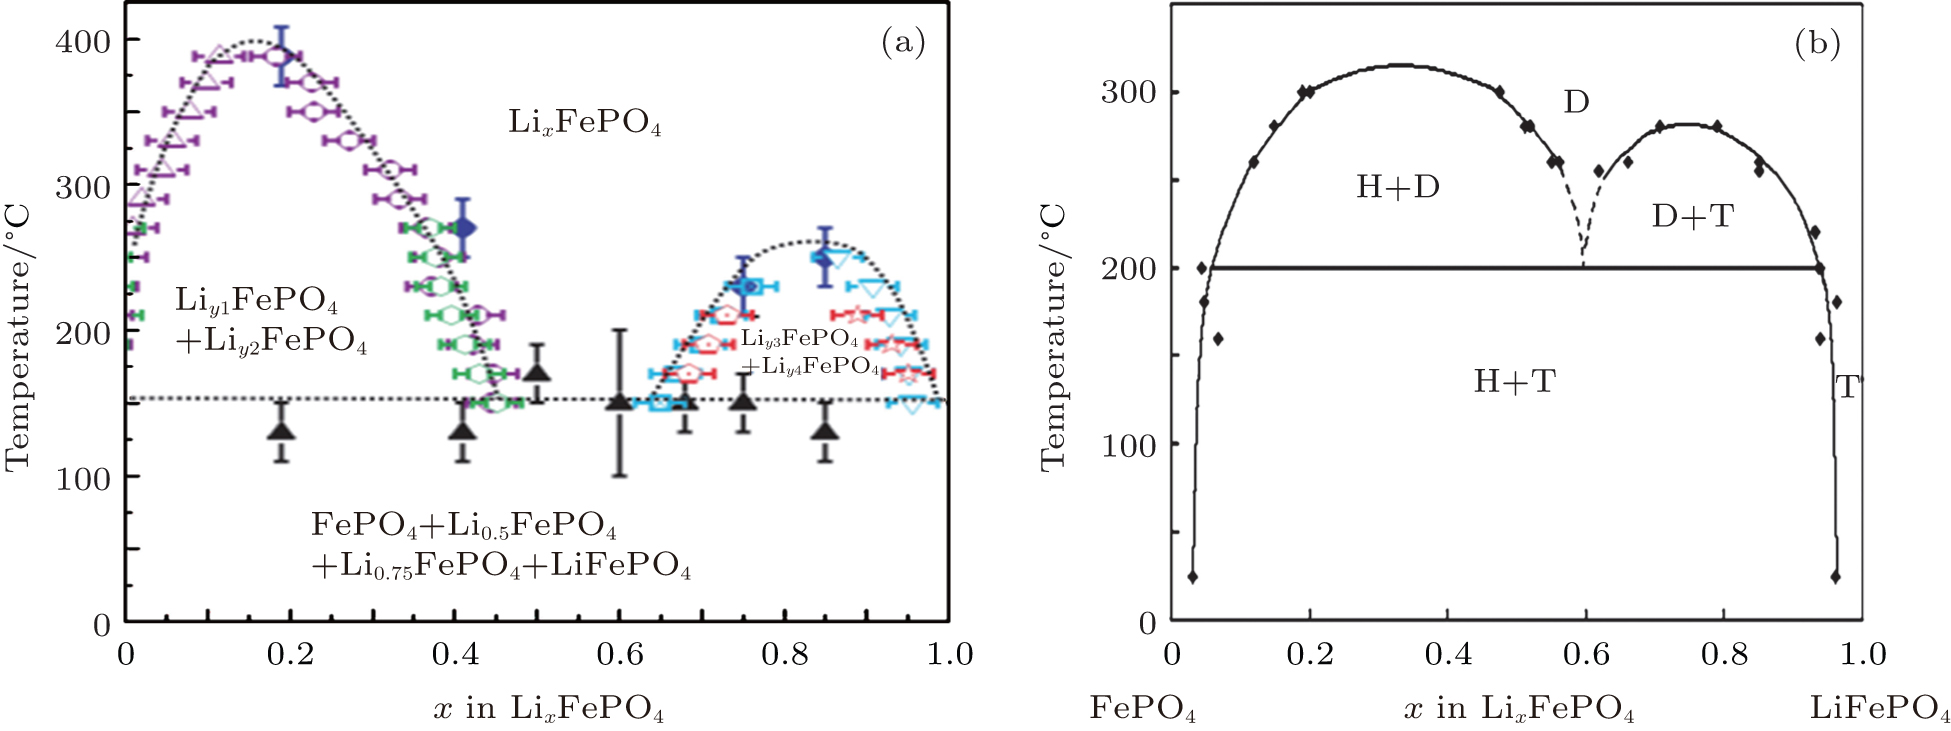 | Fig. 7. (a) Phase distribution diagrams of Li x FePO 4 (0 ≤ x ≤ 1) established from temperature-controlled XRD data. [ 50 ] (b) Phase diagram of LiFePO 4 (T, for triphylite), FePO 4 (H, for heterosite), and the merging new solid solution (D, for disordered). [ 51 ] |
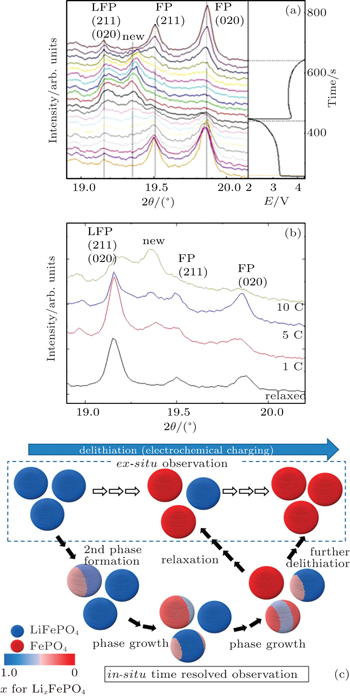
Chen et al. [ 53 ] developed a phase evolution mechanism in which LiFePO 4 is transformed into isostructural FePO 4 , using electron microscopic methods on chemically delithiated LiFePO 4 . The results show that the lithium is extracted at narrow, disordered transition zones on the ac crystal surface and a substantial lattice mismatch caused cracks to form in the bc plane, leading to a newly created FePO 4 phase, as shown in Fig.
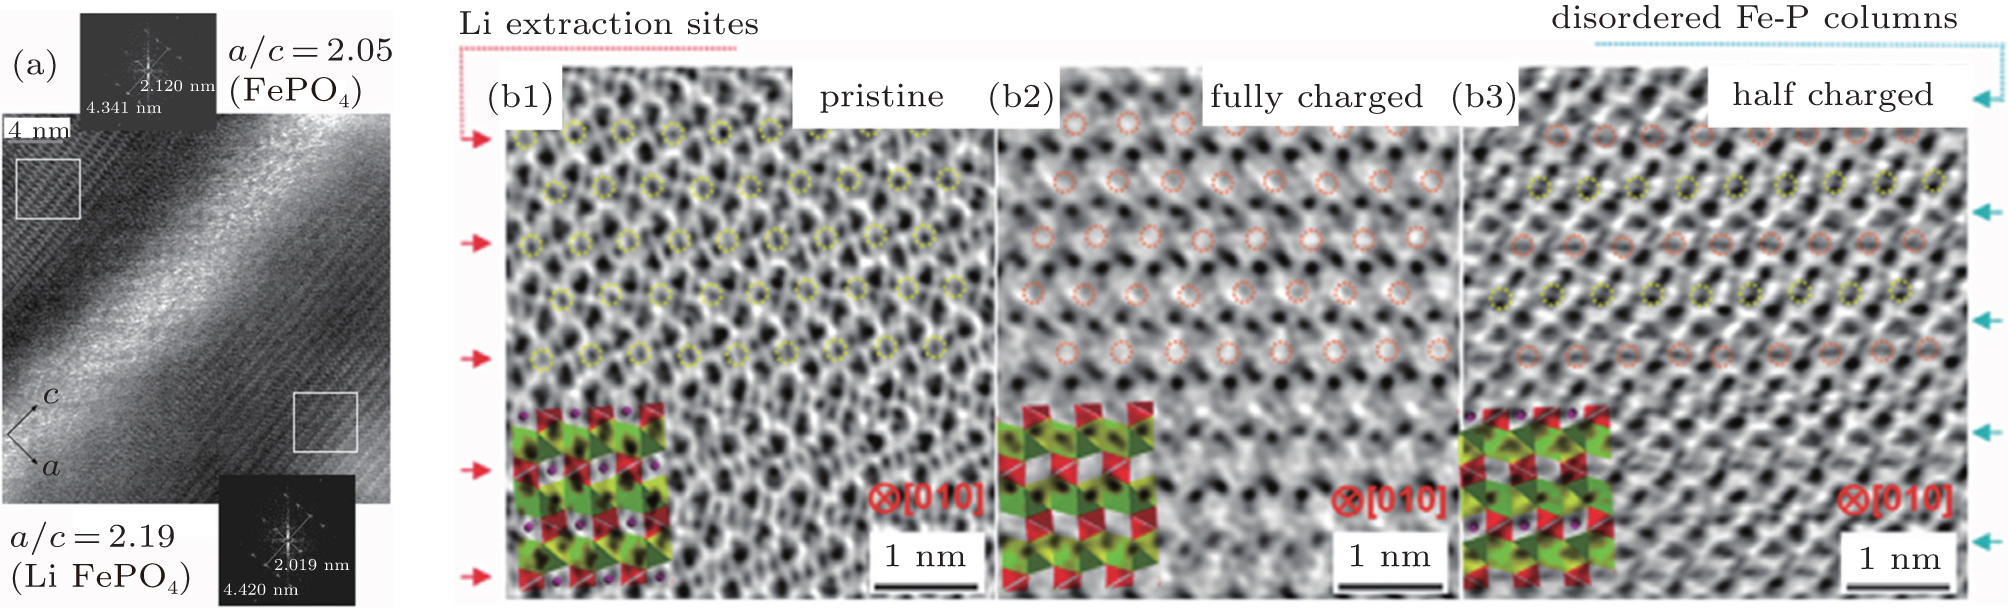 | Fig. 8. (a) HRTEM image of the disordered region between two phases in Li 0 .5FePO 4 crystal with Fourier transforms of the indicated areas. [ 53 ] ABF micrographs of (b1) pristine (LiFePO 4 ), (b2) fully charged (FePO 4 ) and (b3) half charged (Li 1− x FePO 4 , x = 0.5) materials with the corresponding atomic structure shown in inset. Li sites are marked by yellow circles, and the delithiated sites are marked by orange circles. [ 54 ] |
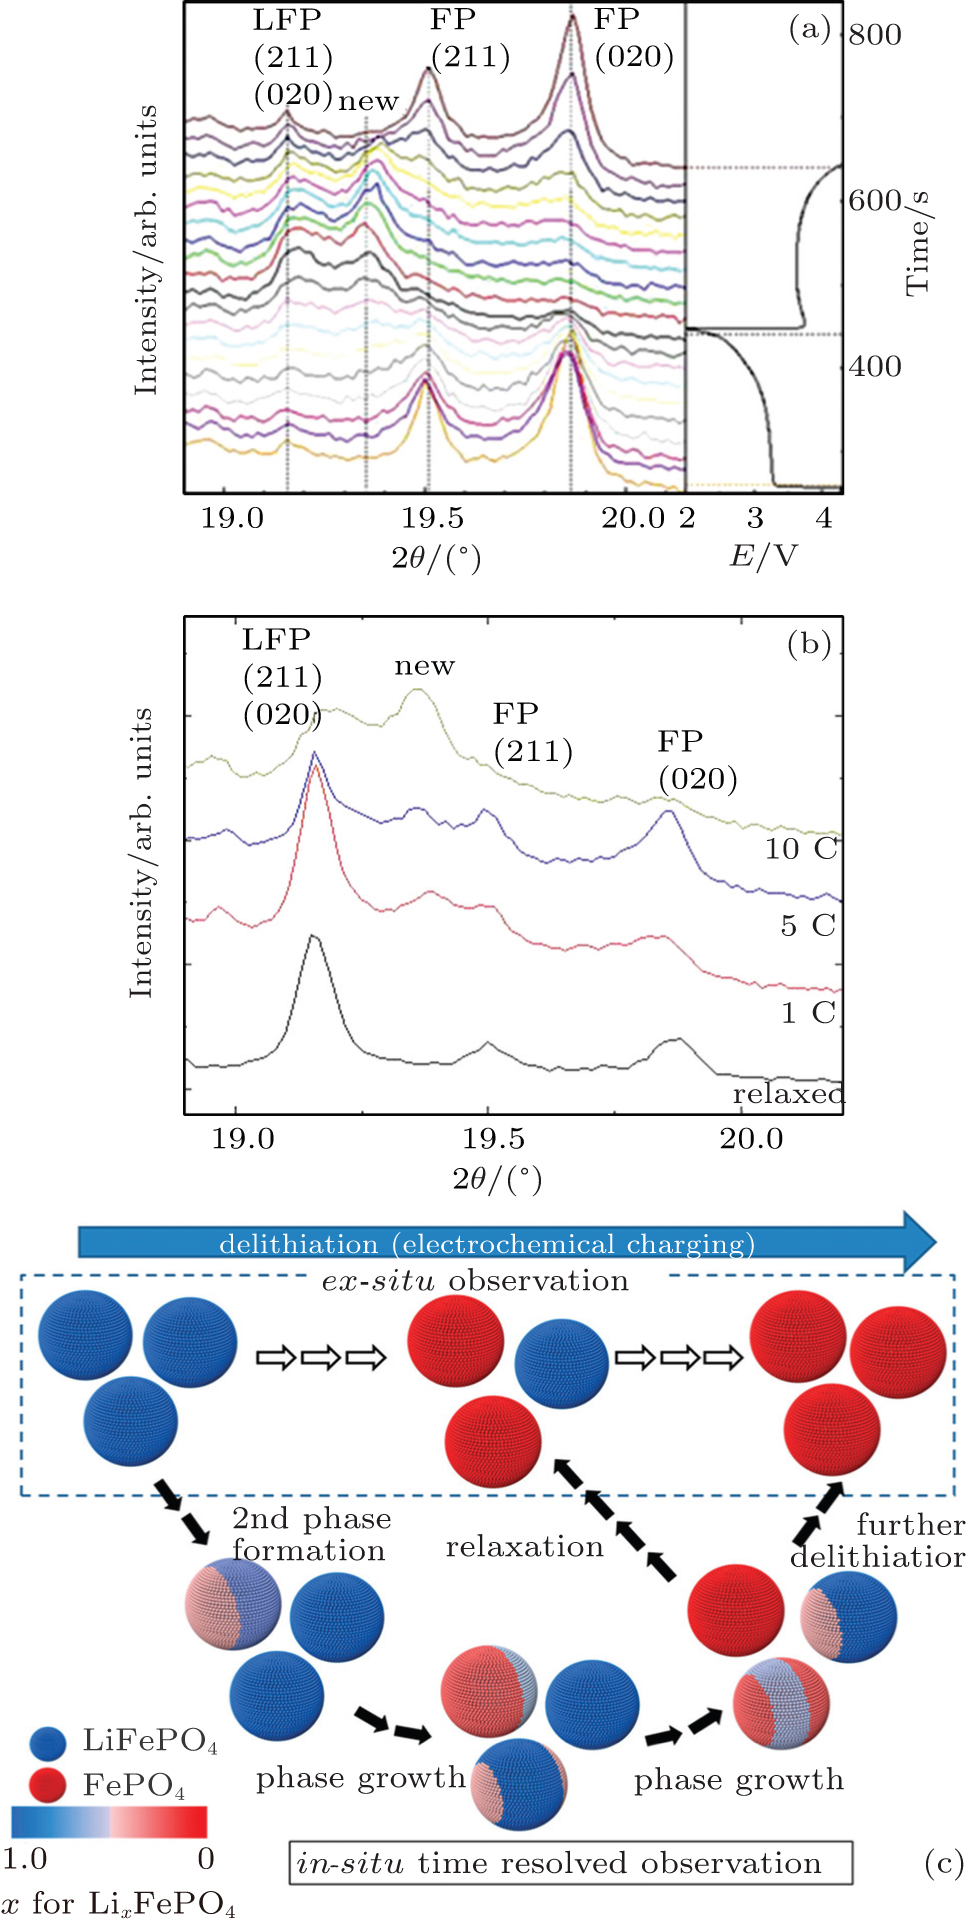 | Fig. 9. (a) Detailed XRD patterns and the first discharge and second charge curves (right). (b) Time-resolved XRD patterns at the end of the first discharge state at different current densities. “Relaxed” represents the pattern of the sample relaxed for 1 day after 10 C charge and discharge cycles. [ 55 ] (c) Phase transition model of Li x FePO 4 . [ 56 ] |
We have reviewed some phase transition mechanisms in LiFePO 4 . However, the occurrence of the phase-transition mechanisms also strongly depends on the limitation of the diffusion of Li + between the two-phase interfaces. This is related to electrochemical kinetics. Thus, the crystal structure of the compound often plays an essential role in determining the shape of the voltage profile as a function of Li concentration, which is related to the kinetic behavior of the material. Firstprinciples statistical mechanical approaches can be applied to study the chemistry and crystal structures that give rise to kinetic properties. [ 57 ] A flat voltage plateau (LiFePO 4 , at 3.45 V versus Li/Li + ) caused by two-phase electrochemical reaction can be verified from the Gibbs free energy according to the suggestions of Van der Ven et al. [ 58 ]
Sun et al. [ 59 ] employed DFT calculations to demonstrate that the stage-II configuration in delithiated LiFePO 4 is a thermodynamically metastable but kinetically controlled state. A dual-interface model was introduced to describe the delithiation mechanism of LiFePO 4 upon charging (Fig.
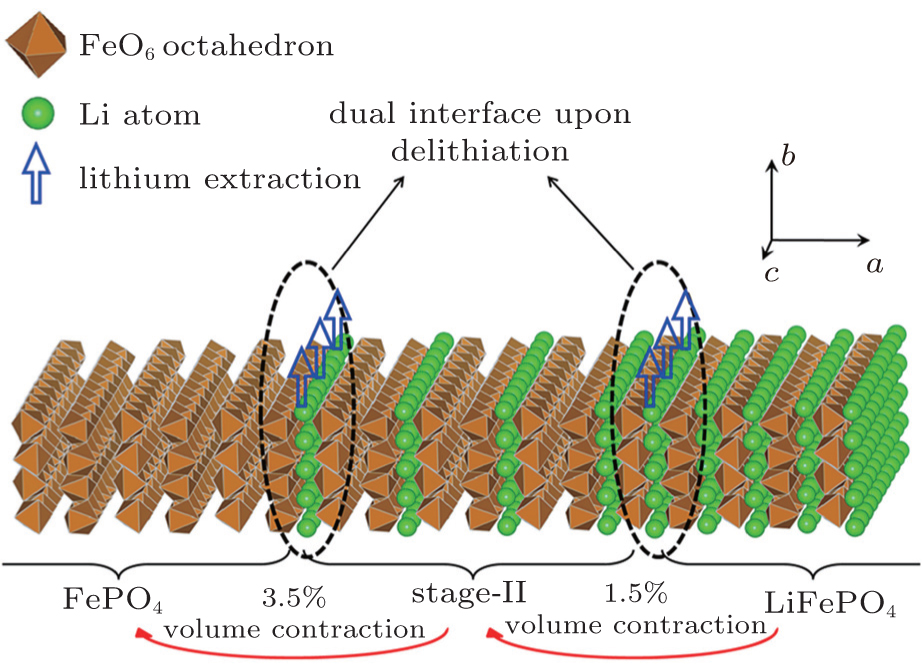 | Fig. 10. Schematic view of possible models for the electrochemical delithiation process of LiFePO 4 . [ 59 ] |
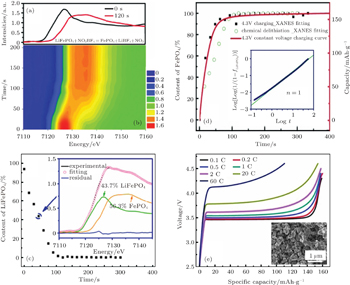
Yu et al . [ 60 ] investigated the rapid delithiation behavior of LiFePO 4 by quick x-ray absorption spectroscopy and dynamically monitored the two-phase transition behavior. As depicted in Fig.
The two-phase transformation from LiFePO 4 to FePO 4 can be studied in samples with different morphology, particle size and surface coatings, and compared in either chemical or electrochemical delithiation reaction time, and so on. [ 61 ]
 | Fig. 11. (a) Fe K-edge XANES spectra of pristine LiFePO 4 and after 120 seconds of chemical delithiation; (b) the evolution and (c) linear combination fitting of Fe K-edge XANES spectra. (d) Comparison of fast delithiation of LiFePO 4 between in situ chemical delithiation and 4.3 V constant voltage charging; solid square symbols represent the FePO 4 content, the red solid line is the charge capacity of 4.3 V constant voltage charging. Inset: determination of the Avrami exponent with the Johnson–Mehl–Avrami–Kolmogorov equation; (e) charge curve of LiFePO 4 at different C rates. [ 60 ] |
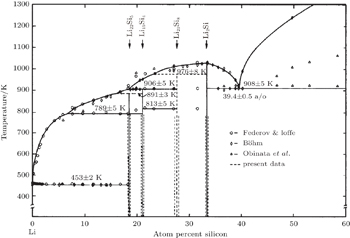
 | Fig. 12. Phase diagram of lithium–silicon system. [ 63 ] |
Due to their high specific capacity, some anode materials such as Si, Ge, and Sn (as well as alloys containing these elements) attract much attention. Silicon is considered to be the next-generation anode material because of having the highest theoretical capacity (4200 mAh/g) as well as being environmentally benign, naturally abundant, and so on.
A series of alloys of Si and Li were developed, [ 62 – 66 ] which often resulted in a typical Li–Si diagram as shown in Fig.


Carbon coating has been investigated to improve the electrochemical performance of silicon anodes. Generally, it is believed that a carbon coating layer can restrain the merging or agglomeration of silicon nanoparticles and accelerate the lithiation rate, due to improving electron and ion transport. [ 74 – 76 ] Additionally, it is well known that upon lithiation, both crystalline and amorphous silicon transform to an amorphous Li x Si phase, which subsequently crystallizes to (Li, Si) crystalline compounds, either Li 15 Si 4 or Li 22 Si 5 . [ 76 ] The latter phase transition from amorphous Li x Si to crystalline phase results in the huge volume expansion, which is responsible for the electrochemical degradation of silicon anodes. As to the carboncoated silicon, the carbon layer is likely to partly restrain the formation of a crystalline compound, either Li 15 Si 4 or Li 22 Si 5 , in that the toughness of carbon can prevent extreme volume change in a Si anode. In other words, the carbon coating layer helps suppress the phase transition from amorphous Li x Si to a crystalline compound.
Most references report such strategies as carbon-coating or forming composite materials to be effective in improving the electrochemical performance of Si anodes. In our opinion, a double structured silicon anode, core-shell or yolk-shell structured, in which the interior section is porous coated silicon nanoparticles or a Si/C composite and the shell is a superior layer of Li + and an electron conductor with a stable structure, may be proposed to better enhance the electrochemical properties of silicon anodes.
Another interesting phase transition occurs during the electrochemical lithium extraction/insertion of the anode material β -SnSb alloy. [ 77 , 78 ] Li et al. synthesized nanosized β -SnSb and found that the lithium first reacted with Sb atoms to form Li 2 Sb and Li 3 Sb, and then the remaining Sn atoms were aggregated. After all the Sb changed into Li 3 Sb, the Li–Sn alloy appeared. In the delithiation process, the reverse steps occur. This special mechanism was clarified by ex situ XRD.
Phase transition reactions are often observed in LIBs. No matter whether they occur in the synthesis of materials or in the process of electrochemical Li + extraction/intercalation, comprehensive and in depth understanding of the phenomena will significantly promote the technology of LIBs. Currently, most research in this field is carried out from macro-scale and thermodynamic viewpoints. In the near future, investigations from micro- or nano-scale and dynamics viewpoints should be empowered by the rapid development of modern advanced characterization methods. At present, high-throughput calculation is utilized to explore potential LIB materials, which will accelerate the research course of new phase materials. High spatial resolution, temporal resolution and energy-resolution technologies are also widely used to study the structure, composition and evolution of the bulk phase, surface phase and interface phase of materials. Some in situ tools are also being made better and better.
| 1 | |
| 2 | |
| 3 | |
| 4 | |
| 5 | |
| 6 | |
| 7 | |
| 8 | |
| 9 | |
| 10 | |
| 11 | |
| 12 | |
| 13 | |
| 14 | |
| 15 | |
| 16 | |
| 17 | |
| 18 | |
| 19 | |
| 20 | |
| 21 | |
| 22 | |
| 23 | |
| 24 | |
| 25 | |
| 26 | |
| 27 | |
| 28 | |
| 29 | |
| 30 | |
| 31 | |
| 32 | |
| 33 | |
| 34 | |
| 35 | |
| 36 | |
| 37 | |
| 38 | |
| 39 | |
| 40 | |
| 41 | |
| 42 | |
| 43 | |
| 44 | |
| 45 | |
| 46 | |
| 47 | |
| 48 | |
| 49 | |
| 50 | |
| 51 | |
| 52 | |
| 53 | |
| 54 | |
| 55 | |
| 56 | |
| 57 | |
| 58 | |
| 59 | |
| 60 | |
| 61 | |
| 62 | |
| 63 | |
| 64 | |
| 65 | |
| 66 | |
| 67 | |
| 68 | |
| 69 | |
| 70 | |
| 71 | |
| 72 | |
| 73 | |
| 74 | |
| 75 | |
| 76 | |
| 77 | |
| 78 |