† Corresponding author. E-mail:
Project supported by the National Basic Research Program of China (Grant No. 2014CB932300), the National Natural Science Foundation of China (Grant Nos. 51222210, 51472268, and 11234013), and the Strategic Priority Research Program of the Chinese Academy of Sciences (Grant No. XDA09010300).
Cation–anion interaction with different ratios of salt to solvent is investigated by FT-Raman spectroscopy. The fitting result of the C–N–C bending vibration manifests that the cation–anion coordination structure changes tremendously with the variation of salt concentration. It is well known that lithium-ion transport in ultrahigh salt concentration electrolyte is dramatically different from that in dilute electrolyte, due to high viscosity and strong cation–anion interaction. In ultrahigh salt concentrated “solvent-in-salt” electrolyte (SIS-7#), we found, on one hand, that the cation and anion in the solution mainly formed cation–anion pairs with a high Li + coordination number (≥ 1), including intimate ion pairs (20.1%) and aggregated ion pairs (79.9%), which not only cause low total ionic conductivity but also cause a high lithium transference number (0.73). A possible lithium transport mechanism is proposed: in solvent-in-salt electrolytes, lithium ions’ direct movement presumably depends on Li-ion exchange between aggregated ion pairs and solvent molecules, which repeats a dissolving and re-complexing process between different oxygen groups of solvent molecules.
Metallic lithium based batteries are considered to be desirable high energy-density batteries due to both high volume energy density and high weight energy density. [ 1 – 7 ] However, compared with alkali metal-ion batteries, [ 8 , 9 ] safety and short cycling life are still major technological shortcomings, due to lithium dendrite formation and partly irreversible deposition and dissolution. [ 1 , 3 ] As a matter of fact, those issues could be solved by optimizing organic electrolyte compositions and components, since organic electrolyte is the sole intermediary in direct contact with the lithium anode, and its physicochemical properties have a big effect on a lithium metal anode. [ 10 ] For example, solvent-in-salt (SIS) electrolytes, an ultrahigh concentration system, can significantly improve the electrochemical performance of lithium-sulfur batteries, due to the system’s dual effects on the sulfur electrode and the metallic lithium anode. [ 11 ] Compared with traditional dilute electrolytes (salt concentration < 1.5 mol/L), the conductivity of SIS truly decreases to some degree, influenced by high viscosity; however, the decline is not greater than expected, due to compensation by a higher lithium transference number (0.73). Thus, it is presumed that SIS should have a different lithium-ion transport mechanism, possibly reduced by complicated and multivariate ion-ion/ion-solvent interactions, which remain unclear so far. Among all measurements and methods for characterizing ion–ion or ion–salt interactions, Raman spectroscopy is considered to be one of the most effective ways to detect changes of ion–ion or ion–solvent interactions in electrolytes. [ 12 – 14 ] Thus, in this work, Fourier transform Raman (FT-Raman) spectroscopy is used to investigate Li + -ion transport in SIS electrolytes. The spectra produced at different ratios of salt to solvent are compared, fitted and analyzed to understand the relationship between salt concentration and lithium-ion transport properties, such as the Li + -ion transference number and its ionic conductivity.
In the present study, 1,2-dimethoxyethane (DME) and 1,3-dioxolane (DOL) (Ferro, China) and lithium bis(trifluoromethanesulphonyl)imide (LiN(SO 2 CF3) 2 , LiTFSI) (TCI, Japan) were used to prepare electrolytes. The preparation process is as follows: LiTFSI and DME:DOL = 1 : 1 by volume were mixed by a ratio of mole number to volume, which are 1#: 1 mol per l, 2#: 2 mol per l, 3#: 3 mol per l, 4#: 4 mol per l, SIS-5#: 5 mol per l, SIS-6#: 6 mol per l and SIS-7#: 7 mol per l, respectively. The mixtures were stirred for 24 h at room temperature. All the experiments were performed in an argon-filled glove box.
FT-Raman spectra were acquired using a Bruker RFS100/S Raman spectrometer at 1064 nm with an InGaAs laser. The electrolytes’ spectra were recorded from 3600 to 60 cm −1 , and all samples were sealed in glass tubes. Laser power was set at 150–450 mV, and 400 scans were accumulated with a resolution of 2 cm −1 (LiTFSI, DOL, DME, and DOL–DME) and 4 cm −1 (LiTFSI in DME–DOL).
Figure
 | Fig. 1. (a) FT-Raman spectra of DME, DOL, and the mixture of DOL: DME = 1:1 by volume; (b) FT-Raman spectra of LiTFSI. |
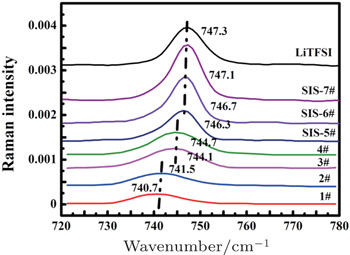
 | Fig. 2. Raman spectra of C–N–C bending vibration with different ratios of LiTFSI to DOL–DME (1:1 by volume). |
Generally speaking, according to the lithium coordination number, the cation–anion coordination structure in solution could be described by free ions without Li + coordination, loose ion pairs coordinated with less than one Li + , intimate ion pairs coordinated with one Li + and aggregated ion pairs coordinated with more than one Li + , the latter three of which are actually a combination of two ions of opposite charge by electrostatic columbic attraction. Here, an intimate pair and aggregated ion pair are formed when ions are in direct contact. In contrast, if there are one or more solvent molecules between the cation and anion, the pair is defined as a loose pair, and the intensity of interaction between the two ions with opposite charge depends on the number of solvent molecules. To better evaluate the interaction between cation and anion, four types of ion pairs were arbitrarily defined by different C–N–C bending vibration positions: “free ion” (FI) (736–738 cm −1 ) < “loose ion pair” (LIP) (740–742 cm −1 ) < “intimate ion pair” (IIP) (744–746 cm −1 ) < “aggregated ion pair” (AIP) (746.5–747.3 cm −1 ) (Table
 | Fig. 3. Fitting curves of C–N–C bending band by different interaction models shown in Table |
| Table 2. Interaction model between cation and anion, and corresponding C–N–C binding vibration wavenumber. . |
| Table 3. Fitting results of C–N–C bending band. . |
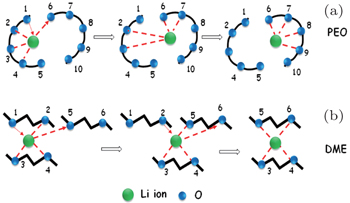
In dilute electrolyte, cation–anion interaction is almost negligible, because Li + ions are fully solvated with organic solvent molecules, thus ionic transport depends on the direct mobility of solvated Li ions in the electric field. However, in high viscosity SIS electrolyte, the degree of Li + -ion solvation reduces drastically and cations and anions are apt to form both intimate ion pairs and aggregated ion pairs, for which mobility is much slower than solvated Li + in dilute solution, so the ionic conductivity of SIS electrolyte decreases. However, it is interesting that the lithium-ion transference number unexpectedly rises up to 0.73 in SIS-7# electrolyte, which indicates that mobility of Li + is easier than that of anions in an ultrahigh salt concentrated electrolyte. Considering the low mobility of both intimate ion pairs and aggregated ion pairs, we think that another lithium-ion transport mechanism, yet to be discovered, may support the ionic conductivity. Combining our results with previous investigations on the Poly(ethylene oxide) (PEO) polymer Li + -ion transport, we assumed a Li-ion transport mechanism in SIS similar to the Li-ion transport in PEO. In a PEO-based electrolyte, Li + ions usually form a complex with four ether oxygen groups of PEO, and Li + -ion transport occurs mainly in the amorphous phase with segmental motions. Lithium-cation movement along one direction generally depends on the dissolution and re-complexing processes during the formation of different PEO chains (Scheme I, see Fig.
In summary, the Raman results manifest that the cation–anion coordination structure changes tremendously with increasing salt concentration. In dilute electrolyte, the structure is composed of low Li + -coordination number cation–anion pairs (<1) including free ions and loose ion pairs, and contains solvated Li ions as the ionic transport carrier to support ionic conductivity. However, in ultrahigh salt concentrated “solvent-in-salt” electrolyte (SIS-7#), the cations and anions in solution form mainly a high Li + -coordination number (≥ 1) cation–anion pairs, including intimate ion pairs (20.1%) and aggregated ion pairs (79.9%). Compared with solvated Li ions in dilute electrolyte, the sizes of the IIPs and AIPs are larger, and migration resistance is higher in high viscosity, which makes the ionic conductivity decrease.
However, the decline is not greater than expected, due to compensation by a higher lithium transference number (0.73). Thus, it is presumed that Li + -ion transport possibly depends on Li-ion exchange between aggregated ion pairs and solvent molecules by repeated dissolution and re-complexing between different oxygen groups of solvent molecules.
| 1 | |
| 2 | |
| 3 | |
| 4 | |
| 5 | |
| 6 | |
| 7 | |
| 8 | |
| 9 | |
| 10 | |
| 11 | |
| 12 | |
| 13 | |
| 14 | |
| 15 | |
| 16 | |
| 17 | |
| 18 | |
| 19 | |
| 20 | |
| 21 |


