† Corresponding author. E-mail:
Project supported by the Ministry of Education, Science and Technological Development of the Republic of Serbia (Grant No. ON171025).
The dominant process in relaxation of DC glow discharge between two plane parallel electrodes in argon at pressure 200 Pa is analyzed by measuring the breakdown time delay and by analytical and numerical models. By using the approximate analytical model it is found that the relaxation in a range from 20 to 60 ms in afterglow is dominated by 
Argon is an interesting inert gas for numerous applications in different areas of science and technology: for surface sputtering and plasma processing, [ 1 ] it is used in a mixture for filling light bulbs and fluorescent tubes, [ 2 ] and it is used in gas filled switches for pulsed power technology, [ 3 ] as a working gas for plasma jets, [ 4 ] dielectric barrier discharges, [ 5 ] welding and thermal processing, [ 6 ] etc. The relaxation kinetics in argon was studied by a microwave and optical technique following microwave discharge in order to determine the electron–ion recombination coefficient and its electron temperature dependence. [ 7 – 9 ] By applying the microwave technique in conjunction with a quadrupole mass spectrometer, the time evolutions of electron and ion number densities were determined to take place about ten milliseconds after the afterglow. [ 10 – 12 ] Recently, by applying pulsed voltages with different repetition frequencies and rise times, the different breakdown characteristics were established, depending on residual charged and neutral active particles. [ 13 ]
During the study of gas-filled surge arresters by Bošan, [ 14 – 16 ] it was established that the mean value of the electrical breakdown time delay t̄ d depends on the relaxation time (afterglow period) τ from the cessation of the previous discharge to the next application of the working voltage U w to the gas tube. The t̄ d ( τ ) dependence (“memory curve”) has been used for tracing the active particle decay in afterglow of AC and DC discharges in inert and molecular gases and was explained by the action of metastable states remaining from the preceding glow. [ 14 – 16 ] Recently, the metastable hypothesis was repeated by specifying Ar ( 3 P 0 ) and Ar ( 3 P 2 ) metastable states as the explanation of the memory curve in argon. [ 17 , 18 ]
Elementary considerations show that metastable states are efficiently quenched by collisions between ground-state atoms and molecules of parent gases, as well as by collision with impurities and collision between themselves, their effective lifetimes in afterglow are reduced down to the order of milli- and microseconds and cannot explain the long-term memory. [ 19 – 21 ] Consequently, a new model was proposed to explain the memory effect in nitrogen based on the surface recombination of nitrogen atoms [ 21 – 23 ] and in hydrogen by surface recombination of hydrogen atoms. [ 23 – 25 ] The memory curve in argon was measured from very short relaxation times in afterglow up to the saturation region (determined by cosmic rays and natural radioactivity level) and was explained by the charged particle decay and after that, by surface recombination of nitrogen atoms present as impurities. [ 26 ] This was recently confirmed by introducing a controlled quantity of nitrogen impurities into argon in a pulsed radio frequency atmospheric pressure glow discharge. [ 27 ]
The relaxation behavior in argon is considered in a gas tube with plane parallel electrode geometry, by using a 1D numerical model of the stationary DC glow discharge for calculating the charged particle number densities, and the approximate analytical and 2D numerical model of the afterglow relaxation. The rest of this paper is organized as follows. The short description of the experiment is given in Section 2, by describing the experimental procedure and gas tube preparation. In Section 3, the description of the analytical model is used to determine the dominant process and corresponding coefficients, a 1D numerical model is used to calculate the number densities of dominant particles during the stationary state of DC glow discharge, and a 2D numerical model for afterglow relaxation is presented. Finally, in Section 4, the short conclusion is given.
The time delay measurements are carried out in a gas tube filled with argon. The tube is made of borosilicate glass 8245 (Schott technical glass). The electrodes are made of oxygen free high conductivity (OFHC) copper, each with diameters D = 2.2 cm with mildly rounded edges to avoid the edge effect. In comparison with the arrangement in Ref. [ 26 ], the plane parallel electrodes with much greater diameter have a good particle collection efficiency, enabling the measurements of formative time delay distributions. The electrodes are tightly fitted into the tube in order to prevent the long-path breakdown (Fig.
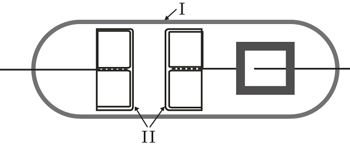 | Fig. 1. Schematic diagram of gas discharge tube for the present measurements, made of borosilicate glass (I) with plane parallel copper electrodes (II). |
In the tube, the inter-electrode distance can be changed by using a magnet outside. The gas tube was pumped down to a pressure of 10 −5 Pa, degassed at 650 K and then filled with argon at a pressure of 200 Pa with less than 1 ppm of impurities.
The time delay measurements were carried out at inter-electrode distances d = 1, 1.5, and 2 cm with corresponding breakdown voltages U s = 210, 230, and 250 V, respectively. The memory curves were measured at different working voltages and inter-electrode distances. The relaxation time was varied from 1 ms to the saturation region of the memory curve determined by cosmic rays and natural radioactivity, while the glow time was constant t g = 1 s, long enough to reach stationary conditions. The time delay measurements were carried out with 100 data in the series and the tube was protected from the external light during the measurements. More details about the experimental procedure and tube preparation can be found in Refs. [ 21 ]–[ 26 ].
The charged particle decay during the relaxation of the DC discharge in argon at low pressure is governed by atomic Ar + and molecular 

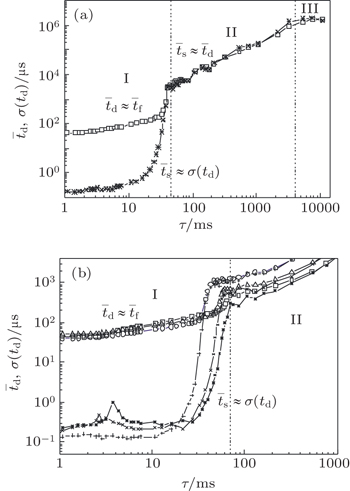
The memory curves measured at different inter-electrode distances (volumes) are shown in Fig.
Region I is dominated by charged particle decay, region II by the neutral active particle decay (surface recombination of nitrogen atoms present as impurities), [ 26 , 27 ] and finally, region III by the saturation of memory curve (due to cosmic rays and natural radioactivity). [ 26 , 27 , 30 ] By analyzing the memory curves measured at different inter-electrode distances the same regions can be observed. The significant differences are the occurrences of maxima of mean values and standard deviations of time delay at the relaxation time of about several milliseconds (Fig.
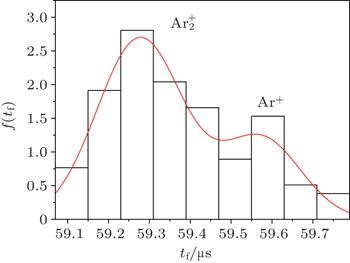
The double-Gaussian distribution of breakdown time delay (Fig.
This distribution (Fig.


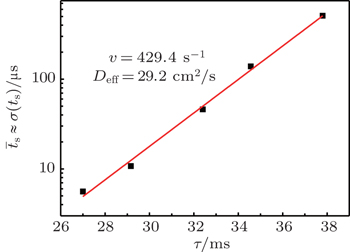
The statistical time delay of breakdown becomes greater with the increase of relaxation time and at about 20 ms the statistical time delay becomes dominant. By analyzing the memory curve from Fig.
According to the approximate analytical model, [ 35 ] the exponential rise of statistical time delay implies the exponential fall of the number density of the dominant ion. At the low pressure, the diffusion of ionic species to the tube walls is the most dominant loss. In the previous analysis, we assume the conversion of Ar + into 


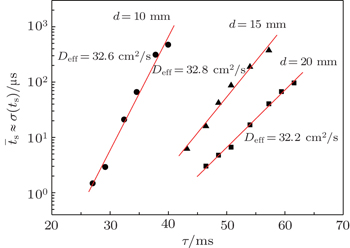
From the slopes of linear fit of experimental data, approximately the same value of diffusion coefficient is determined from Eqs. (
In order to confirm the previous assumptions, to determine the dominant processes and particles and to discuss their influences on the relaxation, the numerical models for the stationary glow discharge and the relaxation are used. For the modeling of relaxation, the initial number densities must be calculated first, so we use the fluid model with nonlocal ionization. [ 36 , 37 ] In the following, we will give a brief description of these models and discuss the obtained results.
The stationary number density profiles are required in order to use them as initial particle number densities in a relaxation model. The most common numerical models which are used for the modeling of different types of gas discharge are fluid models. [ 36 – 39 ] The nonlocal fluid model for argon discharge presented in Ref. [ 36 ] is used to calculate stationary profiles in DC discharge in argon under working conditions. The results from this model show that they are in very good agreement with the experimental data. [ 36 , 37 ] The main idea of the fluid model with nonlocal ionization is to incorporate the ionization by fast electrons into the fluid model. The fluid model consists of the continuity equation for particle number density and the energy balance equation. In addition, Poisson’s equation is coupled with these equations. Hence, the complete system of equations for a fluid model with nonlocal ionization is as follows:


The source term for fast electrons has the following form: [ 36 ]

In order to determine the most dominant particles in the argon DC discharge and relaxation, the following analysis is conducted. Since the work function of copper is ϕ i = 4.42 eV, [ 42 ] electrons are mostly emitted from the surface due to the potential emission by ions, i.e., Ar + and 

| Table 1. Reactions included in 1D fluid model and 2D model for relaxation. . |
The complete form of particle source terms for stationary state of discharge is


For modeling the stationary state of glow discharge, the values of mobility and diffusion coefficient for the electron each are taken as a function of the mean energy. [ 44 ] The mobility for Ar + depends on the reduced electric field, [ 48 ] while the mobility for 

The equation for the external circuit given by Ohm’s law is also included and used to calculate the voltage on the discharge tube from


This system of Eqs. (
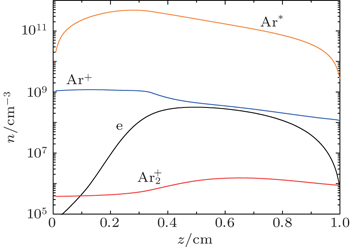
The number density profiles in the stationary state of DC discharge at working voltage U w = 250 V and current I g = 130 μA at the pressure p = 200 Pa and inter-electrode distance d = 1 cm calculated from the fluid model with non local ionization are given in Fig.
From Fig. 
The two-dimensional model for relaxation of DC discharge [ 53 ] is used to model the relaxation of argon discharge at low pressure. This model consists of a diffusion equation for dominant particles with the source term, which includes all dominant processes of productions and losses of corresponding particles, and is described as follows:


The system of partial differential equation (
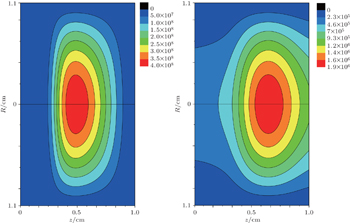
As mentioned previously, the dominant particles that could lead to the secondary electron emission and affect the initiation of breakdown are Ar + , 


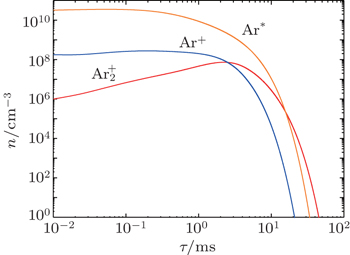
Besides the diffusion loss, the conversion plays an important role in the relaxation. Namely, the choice of conversion coefficient in the numerical model ((0.69 − 4.7) × 10 −31 cm 3 /s at the room temperature [ 11 , 28 ] ) plays an important role in modeling the relaxation. For instance, the choice of the smallest value of the conversion coefficient that can be found in the literature (0.69 × 10 −31 cm 3 /s) leads to the conversion maximum at approximately 6 ms. Opposed to that choice of conversion the coefficient 4.7 × 10 −31 cm 3 /s shifts the conversion maximum to approximately 1.5 ms. With the conversion coefficient 2.26 × 10 −31 cm 3 /s the time of change of dominant particle (Fig.
It can be seen that the Ar + number density falls quite rapidly after several milliseconds due to diffusion and conversion, while the 


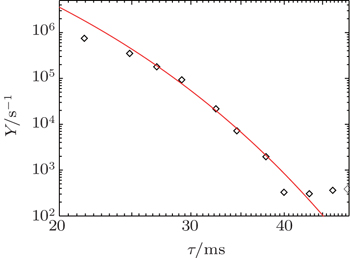
Finally, the effective electron yield, i.e., the number of electrons generated in the inter-electrode space per second, [ 22 ] is calculated from the numerical model and used to fit the experimental data (Fig.


The dominant process in the relaxation of DC glow discharge between plane parallel electrodes in argon at a pressure of 200 Pa are analyzed by measuring the breakdown time delay. The memory curves measured at different inter-electrode distances (volumes) are analyzed and the existence of three main regions is confirmed. In this study, we focus on the early relaxation period and charged particle decay with simultaneous conversion of Ar + to 


Further in the analysis, the numerical models are used in order to confirm the assumptions. First, the number densities of dominant particles in the stationary state of glow discharge at working conditions are calculated by applying the 1D fluid model, improving the estimations from the earlier paper. [ 26 ] Corresponding number densities are used as the initial ones for the relaxation modeling. The evolutions of number densities are calculated from the 2D numerical model. By varying the conversion coefficients found in the literature (the minimal, medium and high value), a great influence on the moment when the change of dominant initiating particle occurs, is observed. By using the value 2.26 × 10 −31 cm 3 /s good agreement between simulation values and experimental data is obtained. Finally, the experimental data are fitted by the variation of effective diffusion coefficient, caused by the change of diffusion regime. In the time interval from 20–40 ms the value of effective diffusion coefficient is approximately equal to that determined by the approximate analytical model. These results from the numerical models are in good agreement with the results from the analytical model and measurements, thus confirming the basic conclusions about ion conversion and afterglow relaxation in argon at low pressure.
| 1 | |
| 2 | |
| 3 | |
| 4 | |
| 5 | |
| 6 | |
| 7 | |
| 8 | |
| 9 | |
| 10 | |
| 11 | |
| 12 | |
| 13 | |
| 14 | |
| 15 | |
| 16 | |
| 17 | |
| 18 | |
| 19 | |
| 20 | |
| 21 | |
| 22 | |
| 23 | |
| 24 | |
| 25 | |
| 26 | |
| 27 | |
| 28 | |
| 29 | |
| 30 | |
| 31 | |
| 32 | |
| 33 | |
| 34 | |
| 35 | |
| 36 | |
| 37 | |
| 38 | |
| 39 | |
| 40 | |
| 41 | |
| 42 | |
| 43 | |
| 44 | |
| 45 | |
| 46 | |
| 47 | |
| 48 | |
| 49 | |
| 50 | |
| 51 | |
| 52 | |
| 53 | |
| 54 | |
| 55 |


