Joint transfer of time and frequency signals and multi-point synchronization via fiber network
Cheng Nan 1 , Chen Wei 1 , Liu Qin 2 , Xu Dan 1 , Yang Fei 1 , Gui You-Zhen 2, †, , Cai Hai-Wen 1, ‡,
Shanghai Key Laboratory of All Solid-State Laser and Applied Techniques, Shanghai Institute of Optics and Fine Mechanics, Chinese Academy of Sciences, Shanghai 201800, China
Key Laboratory for Quantum Optics, CAS, Shanghai Institute of Optics and Fine Mechanics, Chinese Academy of Sciences, Shanghai 201800, China


† Corresponding author. E-mail: yzgui@siom.ac.cn

‡ Corresponding author. E-mail: hwcai@siom.ac.cn

Project supported by the National Natural Science Foundation of China (Grant No. 61405227).

Abstract
Abstract

A system of jointly transferring time signals with a rate of 1 pulse per second (PPS) and frequency signals of 10 MHz via a dense wavelength division multiplex-based (DWDM) fiber is demonstrated in this paper. The noises of the fiber links are suppressed and compensated for by a controlled fiber delay line. A method of calibrating and characterizing time is described. The 1PPS is synchronized by feed-forward calibrating the fiber delays precisely. The system is experimentally examined via a 110 km spooled fiber in laboratory. The frequency stabilities of the user end with compensation are 1.8×10 −14 at 1 s and 2.0×10 −17 at 10 4  s average time. The calculated uncertainty of time synchronization is 13.1 ps, whereas the direct measurement of the uncertainty is 12 ps. Next, the frequency and 1PPS are transferred via a metropolitan area optical fiber network from one central site to two remote sites with distances of 14 km and 110 km. The frequency stabilities of 14 km link reach 3.0×10 −14 averaged in 1 s and 1.4×10 −17 in 10 4  s respectively; and the stabilities of 110 km link are 8.3×10 −14 and 1.7×10 −17 , respectively. The accuracies of synchronization are estimated to be 12.3 ps for the 14 km link and 13.1 ps for the 110 km link, respectively.

1. Introduction

Precise time and frequency signal dissemination have significant applications in scientific research such as very long baseline interferometry (VLBI), deep space network (DSN) and metrology. Aside from the satellite-based systems, [ 1 ] optical fiber has become an attractive alternative medium for transferring time and frequency signals, offering much improved accuracy. [ 2 11 ] In many applications, such as VLBI, DSN and navigation, the synchronization of clocks at different locations is a basic requirement. Joint dissemination of the time and frequency signals and synchronization via fiber networks have been widely proposed and demonstrated in recent years. [ 3 8 ] In the fiber system, the signals often suffer time delay noises caused by temperature fluctuations and vibrations. It is necessary to acquire the delay fluctuation and to compensate for it actively. One method is to incorporate the 1 PPS signal into the square wave frequency signal; and the delay fluctuations of the two signals are simultaneously compensated for by an application-specific integrated circuit. [ 4 , 5 ] The other method is to use two lasers with different wavelengths to transmit the two signals and combine them with DWDM. The fluctuations of the two signals are independently compensated for in two electrical compensation systems. [ 6 ] It was found that the accuracies of the time delay measurement and control are mainly limited by the jitter of the equipment, so that the averaging of multiple measurements is used to reduce the error of time delay for their time signal with 500 Hz repetition rate. In our previous work, the joint dissemination of 1PPS time signal and 100 MHz sinusoidal frequency signal by using two lasers with different wavelengths was achieved based on DWDM via an 80 km spooled fiber in the laboratory, [ 9 ] and the joint time and frequency dissemination network was tested in the laboratory, which transferred time and frequency to multiple users through a tree-like fiber network with a noise compensation system at each remote site via 50 km fiber link. [ 10 ]

In this paper, we demonstrate a time (1PPS) and frequency signal dissemination and time synchronization system based on the metropolitan fiber network. Since the repetition rate is only one pulse per second, the averaging method is not suitable. Instead an optical compensation setup is used, in which the phase fluctuation of frequency signal (1GHz) is detected and used to feedback control the compensation setup, and to stabilize the delay of fiber link by compensating for the delay fluctuations. In addition, by precisely calibrating the instrumental delay of the system and measuring the propagation delay of 1PPS transit from the local to remote site, the timescales of the two sites can be synchronized by feedforward compensating for the time delay of 1PPS. Furthermore, the special bi-directional erbium-doped fiber amplifier (Bi-EDFA) is used to regenerate optical signals to achieve the long distance transmission. In order to verify our system, the frequency transfer and time synchronization via 110 km spooled fiber are achieved in the laboratory. The frequency stabilities of the remote site reach 1.8×10 −14 averaged in 1 s and 2.0×10 −17 in 10 4 respectively. The time signals at the remote site are synchronized with the local site, the accuracy of synchronization is 12 ps. Finally, we disseminate two 1PPS signals and one frequency signal (10 MHz) of hydrogen maser from the central location to two remote locations, as far away as 14 km and 110 km, via a metropolitan fiber network. The frequency stabilities of 14 km link reach 3.0×10 −14 averaged in 1 s and 1.4×10 −17 in 10 4  s, respectively; and the stabilities of 110 km link are 8.3×10 −14 and 1.7×10 −17 , respectively. The time signals at the three locations are synchronized with each other. The accuracies of synchronization are estimated to be 12.3 ps for the 14 km link and 13.1 ps for the 110 km link, respectively.

The rest of this paper is organized as follows. In Section 2, the experiment setup, the principle of time synchronization and the experimental results in the laboratory are described. In Section 3, the experimental setup via the metropolitan fiber network and the experiment results are presented. There is only one single fiber that is allowed to be used for the field experiment in each link, therefore the uncertainty of synchronization cannot be directly measured and it is discussed in the final part of this section. Finally, in Section 4, we briefly draw some conclusions from our results.

2. Experimental setup and concept of time synchronization
2.1. Experimental setup

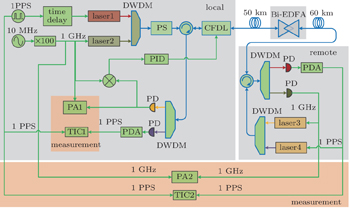
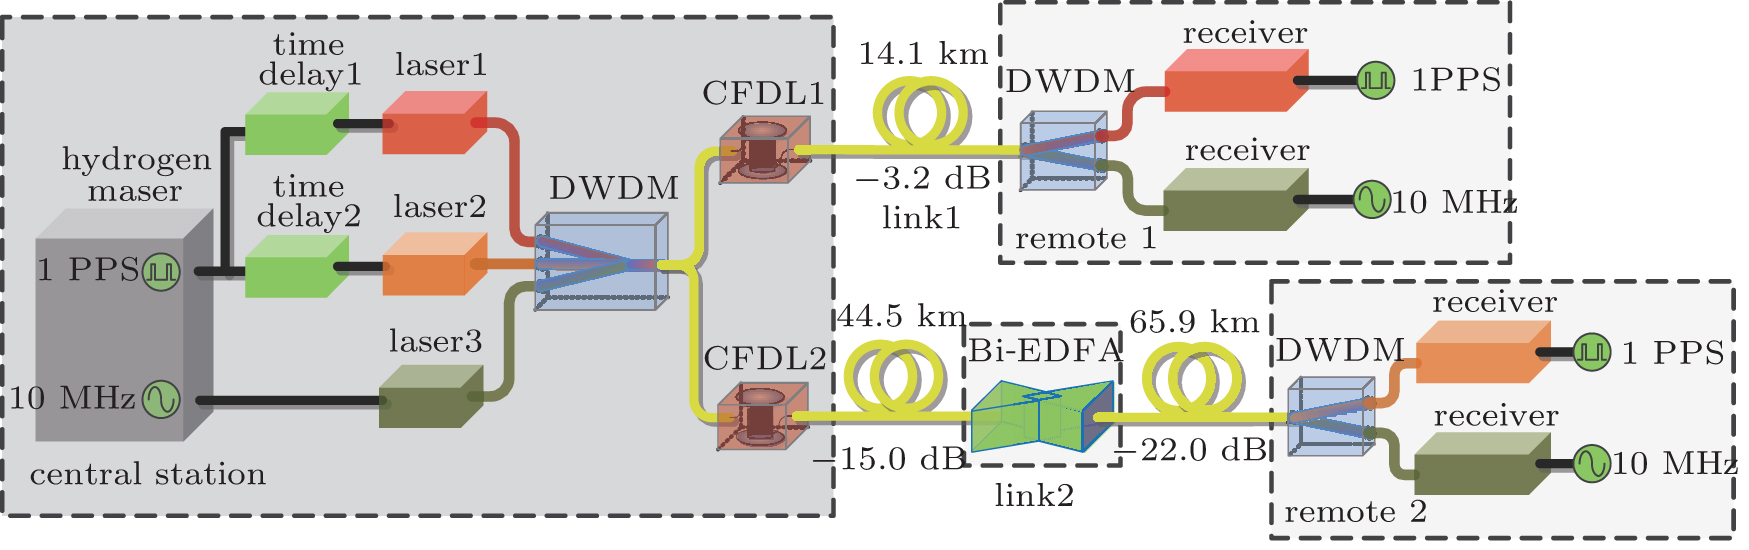
The principle of the frequency dissemination and time synchronization system via 110 km fiber link is described in Fig.  1 . At the local site, the 1 PPS signal goes through the controllable time delay generator and modulates the laser 1. The 10 MHz sinusoidal frequency signal is enhanced to 1 GHz and modulates the laser 2. The two light beams with different wavelengths combined by a DWDM are transferred from the local site to a remote site via a 110-km fiber link. The light is separated by a DWDM and detected by two photodetectors (PDs) at the remote site. After detection, the 1 PPS is shaped and regenerates more output pulses by the pulse distribution amplifier (PDA), and the 1 GHz frequency signal is split into two parts. Part of it is down-converted to 10 MHz by a phaselocking system. The 10 MHz frequency signal and the 1 PPS are sent to the users at the remote site. Part of the 1 GHz frequency signal and 1 PPS modulate the laser 3 and laser 4 at the remote site. Light beams from two lasers with different wavelengths carry the 1 PPS and the 1 GHz frequency signal and are sent back via the same fiber and detected by two PDs. The other two DWDMs are used to combine and separate the laser light at the remote site and the local site.

Fig. 1. Schematic diagram of the frequency transfer and time synchronization system via 110 km fiber link. PS: polarization scrambler; CFDL: controlled fiber delay line; Bi-EDFA: bi-directional erbium-doped fiber amplifier; PA: phase analysis system; PID: proportional-integral-differential system; PDA: pulse distribution amplifier; DWDM: dense wavelength division multiplex; TIC: time interval counter.

At the local site, the phase noise of the 1 GHz induced by the fiber transmission is detected and compensated for by a controlled fiber delay line (CFDL) which is controlled by a proportional-integral-differential (PID) system. The CFDL includes two parts, which are designed as the fast and the slow delay line, respectively. The fast delay line is a cylindrical piezoelectric ceramic transducer (PZT) where a 12mlength optical fiber is wrapped. The dynamical range is about 15 ps and the bandwidth is 1 kHz. The slow one is a temperature-controlled fiber, which is composed of an optical fiber wrapped around an aluminum wheel. The slow delay line used in 110 km fiber link is approximately 10 km long with a sensitivity of 350 ps/°C and a total dynamic range of 16 ns. A Bi-EDFA located 50 km away is used to amplify the laser light beams in both directions in order to ensure adequate optical power for entering PDs. At the local site, a phase analysis system (PA1) and time interval counter (TIC1) are used to measure the stability for the 1 GHz frequency signal and the propagation delay of 1PPS coming back from the remote site, respectively. Meanwhile, the PA2 and TIC2 are used to measure the stability for the 1 GHz frequency signal and the propagation delay of 1PPS outputting from the remote site, respectively.

2.2. Time transfer calibration and time synchronization

In this section, we describe the procedure of the propagation delay calibration and the time synchronization. To synchronize time at the remote site, the precise time delay of the transmission needs to be measured. At the local site, one TIC is used to measure the round-trip propagation delay of the 1PPS signals, which is close to twice the single-trip delay. In this section, we first measure the instrumental delay of our system and calibrate the propagation delay. Then we discuss the difference between the forward and backward propagation delays of the fiber links. Finally, the uncertainty of the synchronization is calculated.

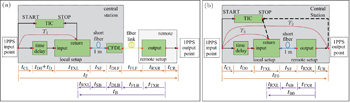
The timing model of the time synchronization system is shown in Fig.  2(a) . The local and the remote setup are connected by the CFDL and the fiber link. One TIC is used to measure the 1PPS input-to-output delay and the 1PPS inputto- return delay. Figure  3(a) illustrates the 1PPS input-tooutput delay, t F

The 1PPS input-to-return delay which is the measure of TIC, T 1 , is described as

Here, t CL is the cable delay from the time reference output point to the input point of the time delay; t CR is the cable delay from the output point of the remote setup to the user end; t D0 is the instrumental delay of the delay generator; t D is the time delay generated by the delay generator, which is set to be zero initially; t TXL and t RXR represent the time delays of the transmitting setup at the local site and the receiving setup at the remote site, respectively; t SF is the forward propagation delay of the short fiber (1 m long); t TXR , t RXL , and t SB are the propagation delays of the signal with the same setups and the short fiber in the opposite direction; t DLF and t FLF are the forward delays of the CFDL and fiber link; t DLB and t FLB are the delays of the CFDL and fiber link in the opposite direction; t B is the 1PPS output-to-return delay, which is described as

In Eq. ( 1 ), the sum of t DLF and t FLF is the single-trip delay of the fiber link, which is close to half the round-trip delay. The delay generator is used to set a value of delay, t D , to make the t F equal one second, which can synchronize the clock of the user end with the local one. The t CL , t D0 , t TXL , t RXR , and t CR are the instrumental delays, which can be nearly treated as constant terms and can be calibrated initially. Figure  2(b) describes the calibration procedures of the instrumental delays. Both the local and the remote setups are located together at the central site, which are connected by the same short fiber. The input optical power and the output power of the setups both remain constant, which can make the instrumental delay stay constant. The trigger level of the TIC is also kept constant. The 1PPS input-to-output delay, t F0 , measured by TIC is described as

The 1PPS input-to-return delay, T 3 , is described as

The t B0 is the 1PPS output-to-return delay. According to Eqs. ( 2 ), ( 4 ), and ( 5 ), t F in Eq. ( 1 ) can be defined as

where Δ t FL is the difference between the forward and backward propagation delays of the CFDL and the fiber link respectively, and can be described as

Because the delay generator cannot give a negative delay value, it would generate a time delay t D which produces the single-trip delay t F equal to one second. Therefore, the set value of time delay t D can be described as

The 1PPS input-to-return delay now, which is the fourth measurement of TIC, T 4 , is described as

In the experiment, the inequality of the Bi-EDFA can be calibrated. The Δ t FL results mainly from the difference in wavelength between the forward and backward laser light, which relates to the fiber chromatic dispersion (CD). [ 11 ] Additionally, the polarization-mode dispersion (PMD) which fluctuates fiber birefringence randomly will influence the signal propagation delay, too. Finally, the Sagnac effect influences the propagation of signal between points of different longitudes because of the Earth’s rotation. The Δ t FL in Eq. ( 7 ) can be described as

where λ F and λ B are the wavelengths of forward and backward light, D is the cumulated chromatic dispersion of the fiber link, t PMD is the PMD term, and t SA describes the Sagnac effect. The Sagnac effect can be described as

where ω is the angular speed of the Earth’s rotation, A E is the area projecting on the equatorial plane of the surface and is swept out by a vector extending from the center of the Earth to the fiber, which is positive when the signal propagates toward the east, and c is the speed of light in a vacuum. [ 12 ]

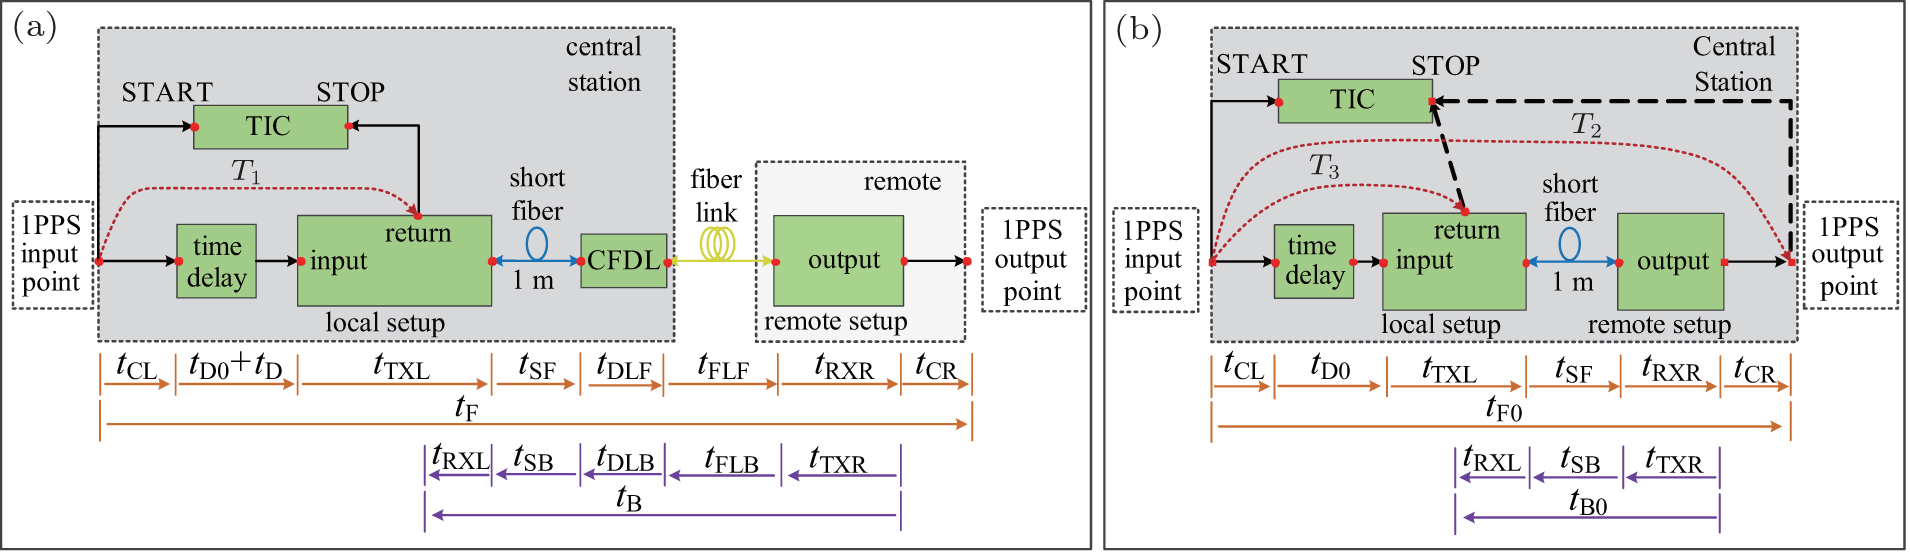
Fig. 2. Schematic diagrams of the time synchronization system for (a) time synchronization via fiber link, and (b) the calibration of the system at the local site.
2.3. Measurement results in the laboratory

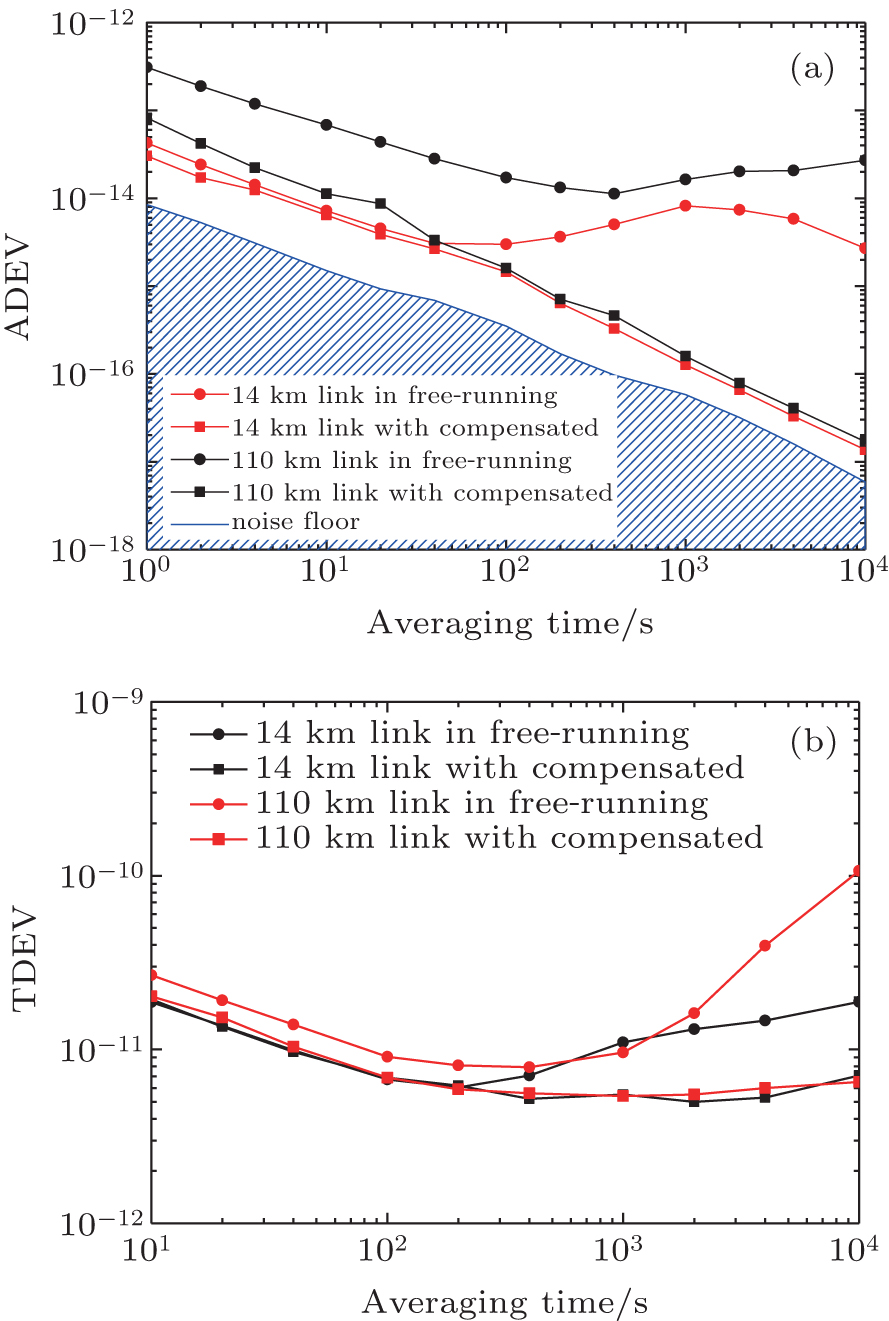
In this section, we demonstrate the measurement result of the system in the laboratory. Figure  3 describes the Allan deviation (ADEV) of the frequency signal measured by the PA at a bandwidth of 5 Hz and the time deviation (TDEV) of 1PPS measured by the TIC (Agilent DSO91304) in the link with and without active stabilization of the propagation delay. Figure  2(a) illustrates that the frequency stabilities of the remote site with compensation (red squares) are improved to 1.8×10 −14 at 1 s and 2.0×10 −17 at 10 4  s average time, whereas the frequency stabilities of the local site (black squares) are 1.7×10 −14 at 1 s and 7.1×10 −18 at 10 4  s average time, respectively. The blue trace in Fig.  3(a) is the noise floor of the PA system. Figure  3(b) illustrates that the TDEV at the remote site (red squares) for an average time of 400 s decreases to 1.3 ps, whereas the TDEV of 1PPS coming back from the remote site (black squares) for the average time of 400 s decreases to 2.6 ps. As shown in Fig.  3 , when the propagation delay fluctuation of the fiber link is stabilized by the optical compensation, both the local and the remote user end can acquire the stable time and frequency signals.

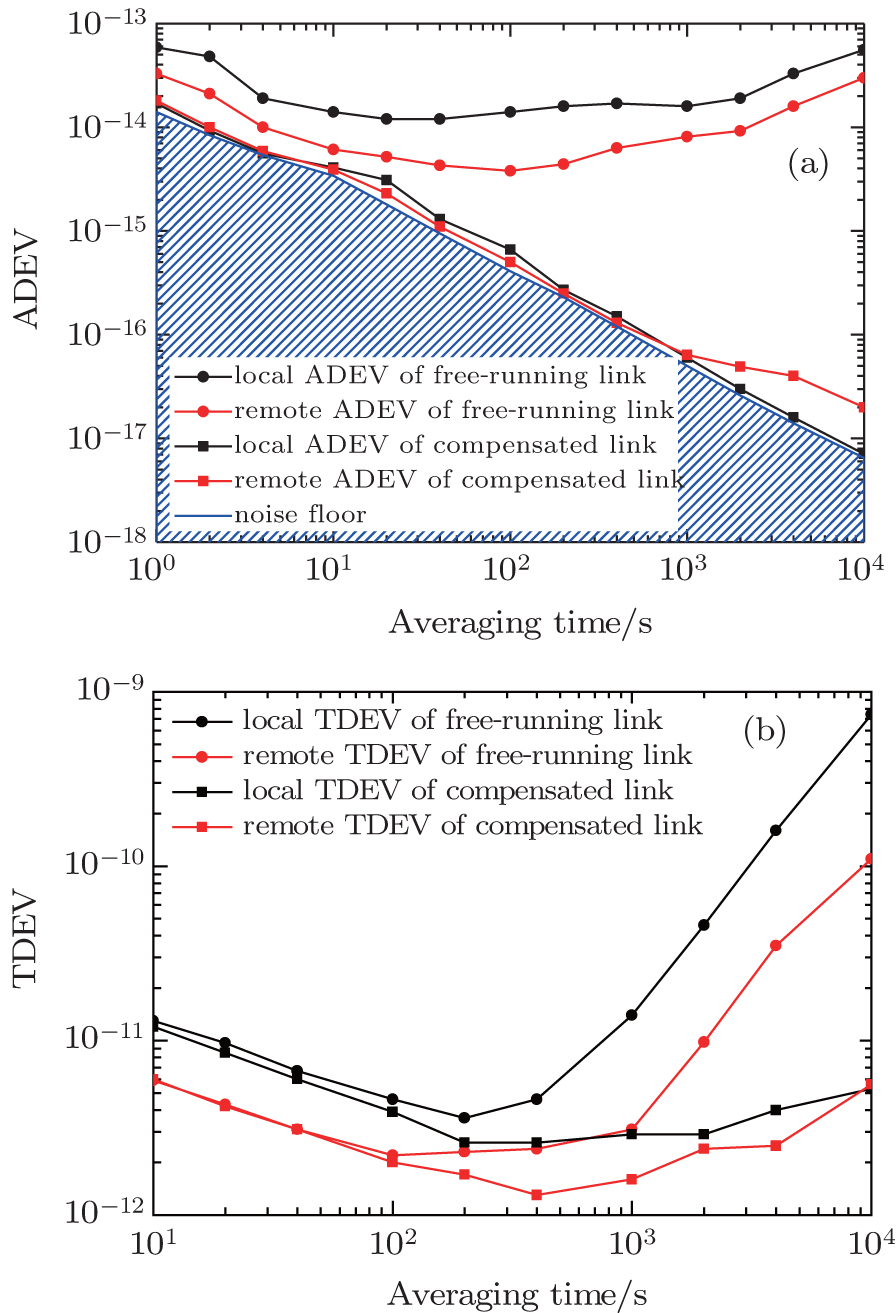
Fig. 3. (a) ADEV and (b) TDEV of the local and the remote site with and without active stabilization.

We synchronize the remote 1PPS with the local 1PPS according to Eqs. ( 5 ) and ( 6 ) when the fiber link is stabilized. In this experiment, T 1 = 1258569975 ps, T 2 = 29757590 ps, and T 3 = 59412567 ps, which are measured by DSO91304. The fiber CD can be measured through optical dispersion measurement using JDSU MTS-6000A. The difference between the forward and backward propagation delays of the 110 km fiber link resulting from CD is 1618 ps (the difference in wavelength between the forward and backward light is 0.8 nm, and the fiber is about 120 km long). The PMD coefficient of the fiber is usually less than 0.05 ps· km −1/2 . Moreover, we use the polarization scrambler to change the state of polarization at the output of the laser, so we consider t PMD as negligibly small. [ 4 ] Because the entire fiber link is located in one laboratory, the time difference resulting from the Sagnac effect also vanishes. Therefore, according to Eqs. ( 8 ) and ( 10 ), the value of the delay generator, t D , is set to be t D = 999370662895 ps.

According to Eqs. ( 5 ) and ( 6 ), the single-trip delay, T F , can be described as

The total uncertainty of time synchronization is the complex uncertainty of t F which is analyzed by calculating the individual contributions provided by all the summation terms of Eq. ( 12 ). The uncertainty of time interval measurement of DSO91304 is 1 ps. [ 13 ] The uncertainty provided by the delay generator is 5 ps. The dispersion uncertainty of the measurement is 0.05 ps/(nm·km). [ 14 ] Therefore, the uncertainty of the CD measurement of the link is 4.8 ps. The wavelengths of the lasers, λ F and λ B , are measured by optical spectrum analyzer, and the accuracy of the measurement is 3 pm. The wavelength drifts of the lasers are both less than 1 pm. Therefore, the total uncertainty of the wavelength measurement in the experiment is estimated at 4 pm. Moreover, although the instrumental delays are nearly constant terms, they may fluctuate with the ambient temperature and input optical power. In our experiment, the input optical power of the laser carrying 1PPS signal is at a level of 10 μW. The uncertainty provided by input power sensitivity is estimated at 15 ps when the accuracy of optical power measurement is 0.5 μW at the level of 10 μW. Finally, all of the modules are located in the airconditioned laboratory undergoing temperature fluctuations of ± 2 °C. Through a long duration of testing, the instrumental delay fluctuating with environmental temperature is observed to be 6.5 ps, which is characterized by the standard deviation. Table  1 shows the individual contributions provided by all the factors and the complex uncertainty of the time synchronization according to Eq. ( 12 ).

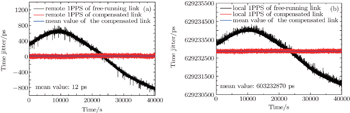
The time delay of the 1PPS between the user end and the reference generator is demonstrated in Fig.  4(a) . Figure  4(a) shows that the short-term jitter of 1PPS with stabilization is 24 ps RMS. The average value of the 1PPS with synchronization is 12 ps. The time delay between the 1PPS reference generator and the 1PPS coming back from the remote site is shown in Fig.  4(b) . The short-term jitter of 1PPS with stabilization is 59 ps RMS. The average value with synchronization is 629232870 ps.

Table 1.

Uncertainty of the time synchronization of the 110 km link.

.
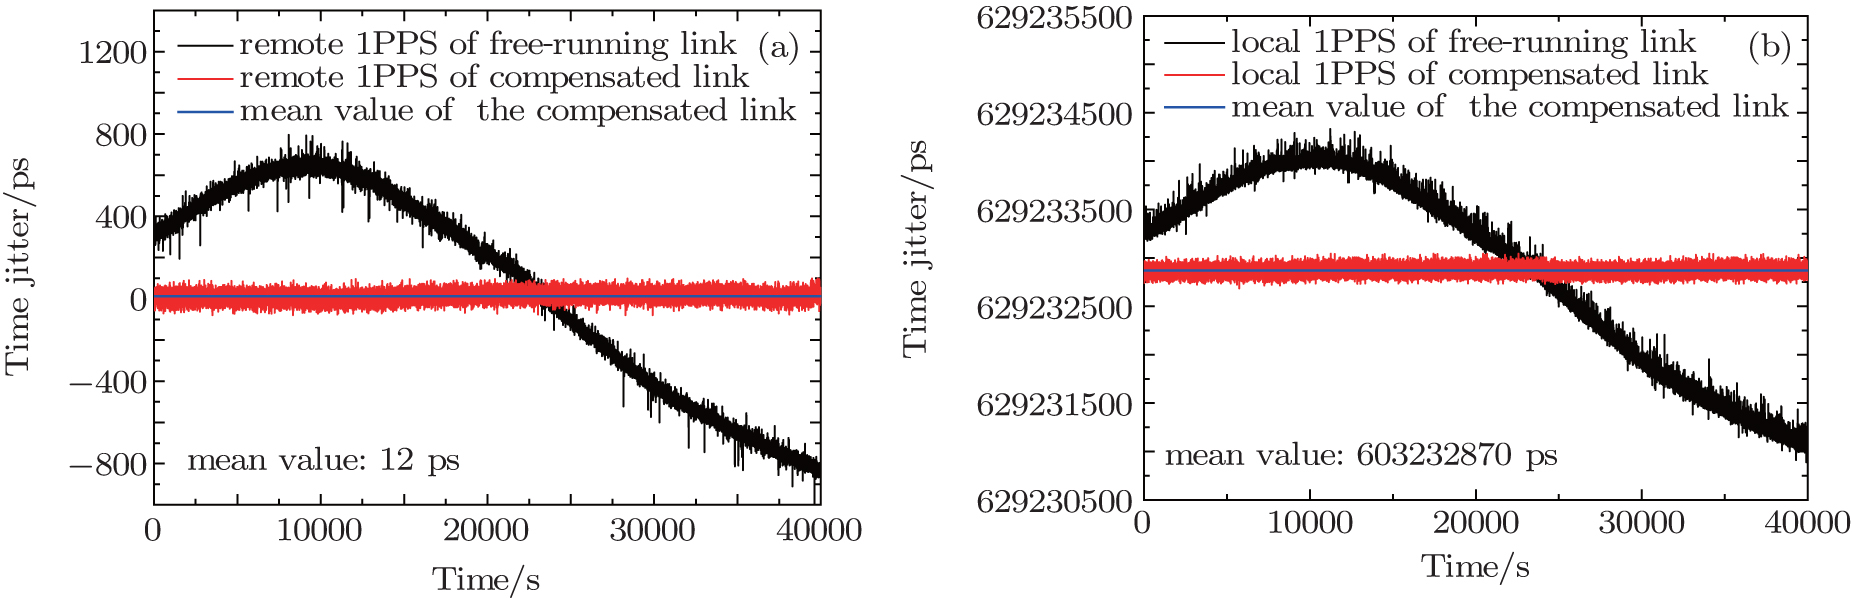
Fig. 4. (a) Time delay between the remote output and the local reference, and (b) time delay between the local output and the local reference.
3. Experiment via metropolitan fiber network and measurement result
3.1. Experimental setup

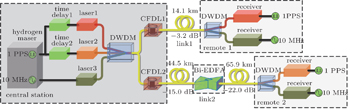
In this section, we describe our system which disseminates two 1PPS signals and one frequency signal (10 MHz) of hydrogen maser from the central site to two remote sites, as far away as 14 km and 110 km, via a metropolitan fiber network. The principle of the frequency dissemination and time synchronization system is described in Fig.  5 . At the central station, the light beams of three lasers with different wavelengths carrying time and frequency signals of the hydrogenmaser (two 1PPS and one 10 MHz) are transferred from the central station to two remote sites (remote 1 and remote 2) via two single telecommunication fibers (link 1 and link 2). The two fiber links are 14 km and 110 km long, and the Bi- EDFA is located in the 110 km link. The light beams of three lasers are split into two parts, and the light beams carrying the frequency signal and one of the two 1PPS are separated by the DWDM in each remote site. Two independently controlled fiber delay line CFDLs are used to compensate for the fluctuation of each link. The phase fluctuation of frequency signal (1 GHz) coming back from each remote site is used to feedback-control each CFDL. The fast delay lines of the two CFDLs are identical. The slow delay line used in the 14 km link is approximately 1 km long with a sensitivity of 35 ps/°C and a total dynamic range of 1.6 ns.

Fig. 5. Principle of the frequency transfer and time synchronization system via urban fiber network.

We use an optical time-domain reflectometer (JDSU MTS-6000) to test the status of the two fiber links. Link 1 is approximately 14 km long, with a total attenuation of 2.8 dB. Link 2 is approximately 110 km long and composed of nine fiber spans, with a total attenuation of 37 dB. The fiber span of the two fiber links is connected with subscription channel/ physical contact (SC/PC) connectors. We use Bi-EDFA to regenerate optical signals attenuated in the fiber to ensure that enough optical power input PDs exists. Furthermore, the optical power fed in the fiber must be below the threshold of stimulated Brillouin radiation. [ 15 ] Finally, the gain of Bi-EDFA is 24 dB.

3.2. Experimental results

In the field experiment, only one fiber is allowed to be used in each link, and the time and frequency stability of the user end cannot be measured directly. The frequency signal (1 GHz) coming back from the remote site is down-converted to 10 MHz and compared with the 10 MHz of the H-maser. Figure  6(a) outlines the ADEVs of two fiber links at 10 MHz measured by TSC5125A (Symmetricom) at the bandwidth of 5 Hz. The ADEVs of the 14 km link with compensation are improved to 3.0×10 −14 at 1 s and 1.4×10 −17 at 10 4  s averaging time, respectively, whereas the ADEVs of the 110 km link are 8.3×10 −14 at 1 s and 1.7×10 −17 at 10 4  s averaging time. The blue trace is the noise floor of 10 MHz. Figure  6(b) illustrates the TDEVs of 1PPS coming back from the two remote stations. As shown in Fig.  6(b) , the TDEV between two links for the averaging time of 1000 s decreases to 6.9 ps.

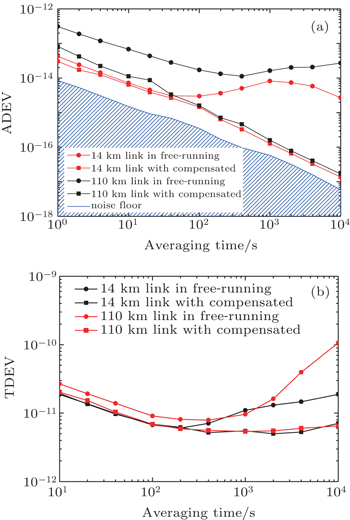
Fig. 6. (a) ADEVs of the frequency signals coming back from remote 1 and remote 2, and (b) TDEVs of 1PPS coming back from remote 1 and remote 2.

We use the same way to synchronize the remote 1PPS with the local 1PPS, which is described in Section 3. The measured time delays and the two links are shown in Table 1. The time delays described in Eqs. ( 1 )–( 3 ) are T 11 = 210526575 ps, T 21 = 29757812 ps, and T 31 = 59412133 ps, respectively. The difference between the forward and backward propagation delays resulting from CD is 194 ps. When we calculate the time difference resulting from the Sagnac effect, we can only estimate the value of the Sagnac effect by averaging the maximum and minimal values. Because the fiber link is usually irregularly laid, the projection onto the equatorial plane is irregular. The difference between the forward and backward propagation delays resulting from the Sagnac effect is 4 ps. Therefore, the value of the time delay 1 is set to be t D 1 = 999894684870 ps. In the 110 km link, the time delays described in Eqs. ( 1 )–( 3 ) are T 12 = 1263567863 ps, T 22 = 29757576 ps, and T 32 = 59412547 ps, respectively. The propagation delay difference resulting from CD is 1626 ps. The propagation delay difference resulting from the Sagnac effect is 133 ps. Therefore, the value of the time delay 2 is set to be t D2 = 999368163885 ps. Figure  7 illustrates the time delays of 1PPS coming back from remote 1 and remote 2 with and without stabilization. As shown in Fig.  7 , with active stabilization, the short-term jitter of 1PPS coming back from remote 1 is 68 ps RMS. The short-term jitter of 1PPS coming back from remote 2 is 79 ps RMS. The average value of the 1PPS propagation delay coming back from remote 1 is 105211445 ps. The average value of the 1PPS propagation delay coming back from remote 1 is 631731748 ps.

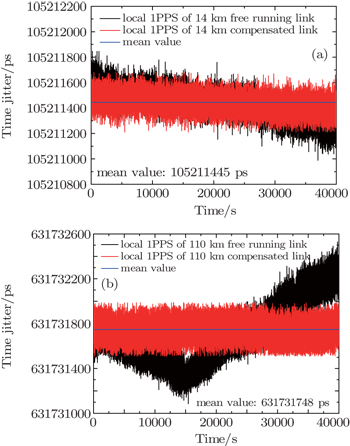
Fig. 7. Time delays of 1PPS coming back from (a) remote 1 and (b) remote 2.

Finally, we calculate the uncertainties of time synchronization of the two links according to Eq. ( 12 ). The calculated uncertainties of two links are shown in Table  2 . In the field experiment, the uncertainty resulting from the Sagnac effect should be considered. Because the fiber link is usually irregularly laid, the projection onto the equatorial plane is irregular. We can only estimate the value of the Sagnac effect by averaging the maximum and minimal values. The calculated difference between the forward and backward propagation delays of the 14 km fiber link resulting from the Sagnac effect is 4 ps; and that of the 110 km fiber link is 133 ps. The uncertainties obtained by calculating the two links are 20 fs (link 1) and 2 ps (link 2). The uncertainty of time synchronization of the 14 km link is 12.3 ps, whereas the uncertainty of the 110 km link is 13.1 ps.

Table 2.

Uncertainties of the time synchronization of the two links.

.
4. Conclusions

In this study, we demonstrate a system that transfers the time and frequency signals jointly via fiber link. A method of calibrating propagation delay and synchronizing the 1PPS is demonstrated. The system is experimentally examined via a 110 km spooled fiber in the laboratory. The experimental results show that the frequency stabilities of the user end with compensation are 1.8×10 −14 at 1 s and 2.0×10 −17 at 10 4  s average time, respectively, whereas the frequency stabilities of the local site are 1.7×10 −14 at 1 s and 7.1×10 −18 at 10 4 s average time, respectively. The calculated uncertainty of time synchronization is 13.1 ps, whereas the direct measurement of the uncertainty is 12 ps. Next, we use the systems to disseminate the time and frequency signals jointly from one central site to two remote sites via two single metropolitan fiber links. The synchronization of the time signals at the three stations is demonstrated. The frequency stabilities of the 14 km fiber link are achieved to be 3.0×10 −14 averaged in 1 s and 1.4×10 −17 in 10 4  s, respectively, and the fractional frequency stabilities of the 110 km fiber link are 8.3×10 −14 and 1.7×10 −17 , respectively. The synchronization uncertainty of the 14 km link is 12.3 ps, whereas the uncertainty of the 110 km link is 13.1 ps. It is believed that our system is promising for use in practical applications, such as the short baseline interferometers, VLBI, and others.

Reference
1 Lewandowski W Azoubib J Klepczynski W J 1999 Proc. IEEE 87 163
2 Droste S Ozimek F Udem T Predehl K Hänsch T Schnatz H Grosche G Holzwarth R 2013 Phys. Rev. Lett. 111 110801
3 Lopez O Kanj A Pottie P Rovera D Achkar J Chardonnet C Amy-Klein A Santarelli G 2013 Appl. Phys. B 110 3
4 śliwczyński L Krehlik P Buczek L Lipiński M 2011 IEEE Trans. Instrum. Meas. 60 1480
5 Krehlik P śliwczyński L Buczek L Lipiński M 2012 IEEE Trans. Instrum. Meas. 61 2844
6 Wang B Gao C Chen W L Miao J Zhu X Bai Y Zhang J W Feng Y Y Li T C Wang L J 2012 Sci. Rep. 2 556
7 Rost M Fujieda M Piester D 2010 EFTF- 2010 24th European Frequency and Time Forum April 13–16, Noordwijk, Netherlands, p. 1
8 Ma C Q Wu L F Jiang Y Y Yu H F Bi Z Y Ma L S 2015 Chin. Phys. B 24 084209
9 Yang F Xu D Liu Q Cheng N Gui Y Z Cai H W 2013 CLEO: Lasers and Electro-Optics June 9–14 San Jose, CA, USA 1
10 Chen W Liu Q Cheng N Xu D Yang F Gui Y Z Cai H W 2015 IEEE Photonics J. 7 7901609
11 śliwczyński L Krehlik P Lipiński M 2010 Meas. Sci. Technol. 21 075302
12 Narbonneau F Lours M Bize S Clairon A Santarelli G Lopez O Daussy Ch. Amy-Klein A Chardonnet Ch 2006 Rev. Sci. Inst. 77 064701
13 Keysight Technologies “DSO91304A Infiniium High Performance Oscilloscope”
14 JDSU “T-BERD ® /MTS Platforms Optical Dispersion Measurement Module”
15 Narbonneau F Lours M Bize S Clairon A Santarelli G Lopez O Daussy Ch. Amy-Klein A Chardonnet Ch 2006 Rev. Sci. Inst. 77 064701