Brief overview of electrochemical potential in lithium ion batteries
Gao Jian1, 2, Shi Si-Qi3, 2, Li Hong1, †, 
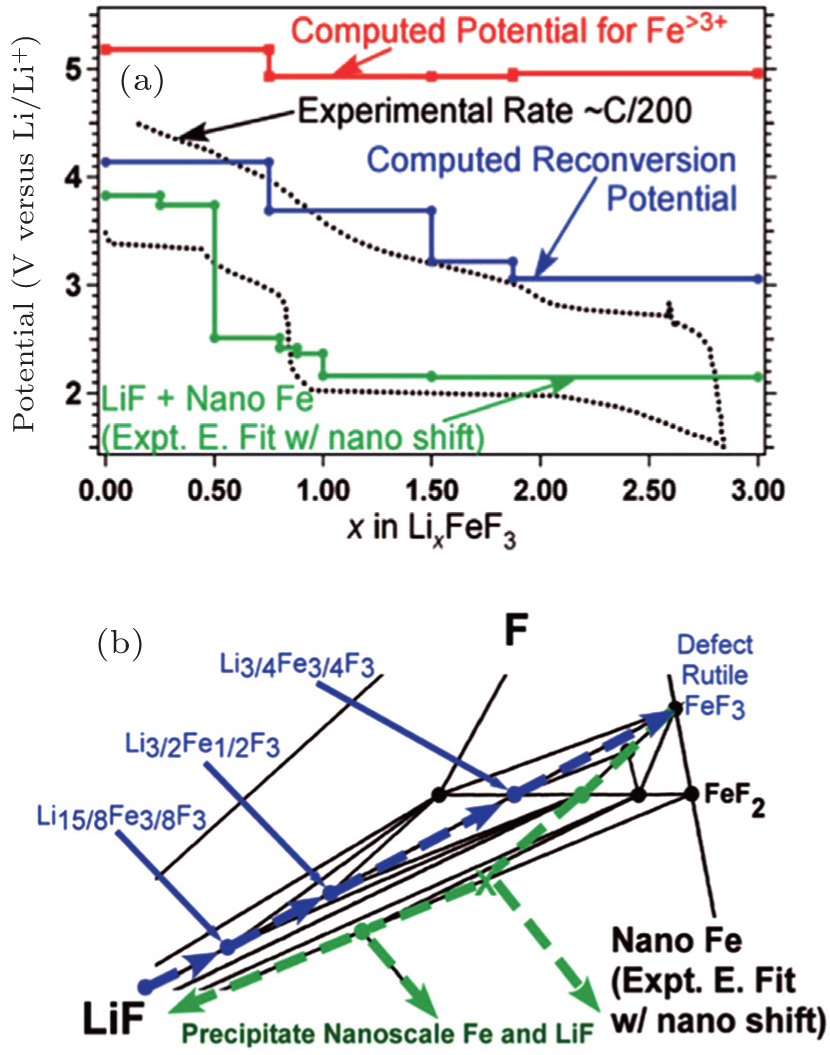
(a) The voltage profile for iron fluoride reconversion during charging (blue, solid line) as compared with the voltage profile for iron fluoride conversion when accounting for the energy of GGA computed nanoscale Fe (green, solid line) and the experimental profile (black, dotted line). The potentials required to form phases with Fe > 3+during reconversion (red, solid line) are also presented. (b) The corresponding reaction path is highlighted for discharge (green, dashed arrows) and charge (blue, dashed arrows).[