Understanding oxygen reactions in aprotic Li-O2batteries
Ma Shunchao1, 2, †,  , Zhang Yelong1, 2, †, , Cui Qinghua1, 2, Zhao Jing1, 2, Peng Zhangquan1, ‡,
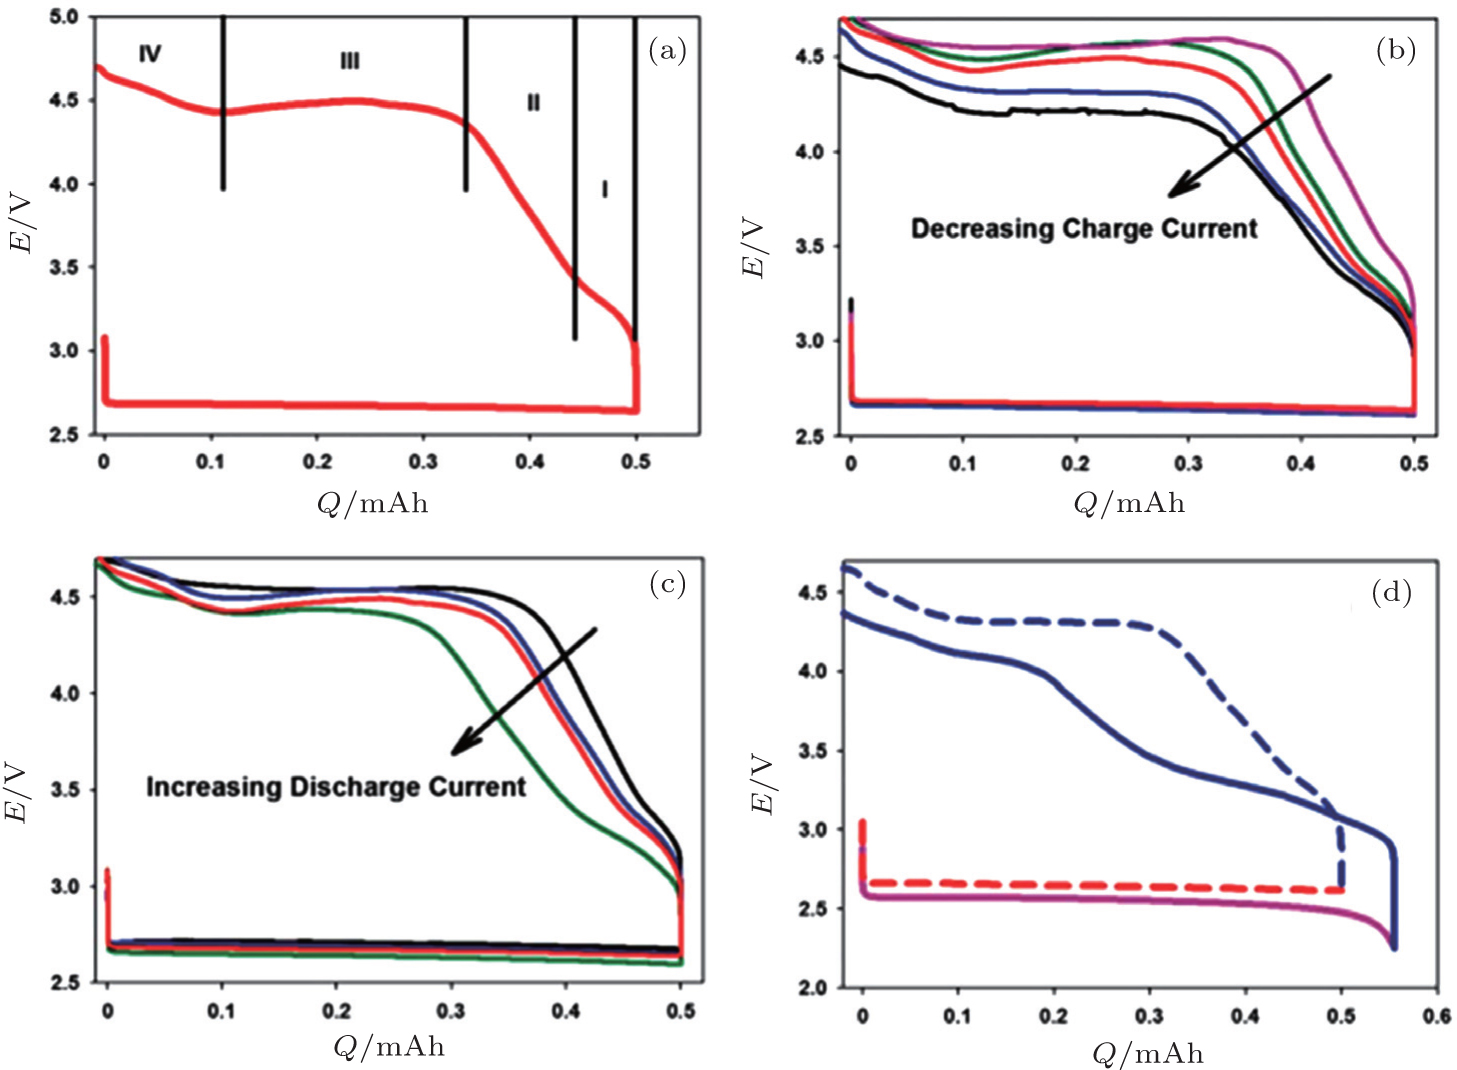
, Zhang Yelong1, 2, †, , Cui Qinghua1, 2, Zhao Jing1, 2, Peng Zhangquan1, ‡, (a) A discharge–charge curve showing the regions of the charge portion; (b) cells discharged at 25 mA/cm2and then charged at different rates from 5–100 mA/cm2(colors of curves listed below); (c) cells discharged at different rates from 5–50 mA/cm2(colors of curves listed below) and then charged at 25 mA/cm2; and (d) comparison of a cell fully discharged at 100 mA/cm2(pink curve) and then charged at 10 mA/cm2with a cell discharged at 25 mA/cm2to a similar capacity (red dotted curve) and then charged at 10 mA/cm2. In panels (b) and (c), black = 5 mA/cm2, blue = 10 mA/cm2, red = 25 mA/cm2, green = 50 mA/cm2, and pink = 100 mA/cm2.[