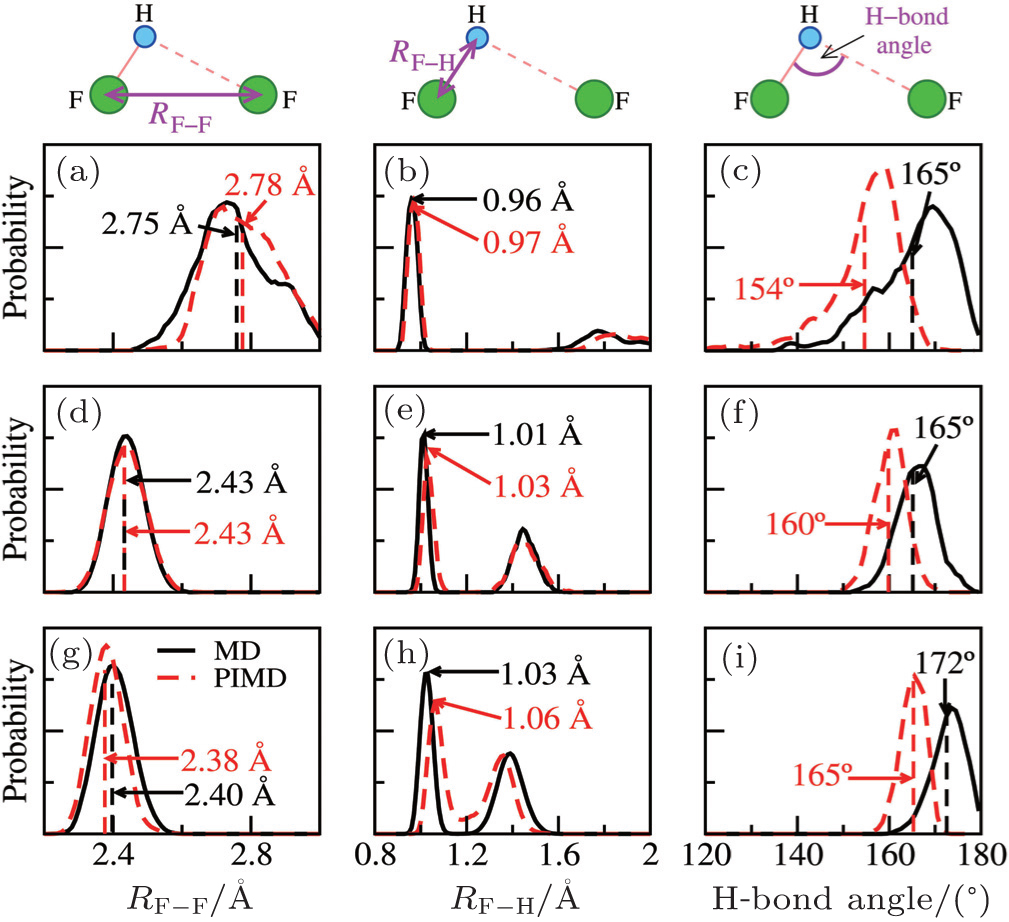
HF clusters as examples for detailed analysis of the QNEs. Distributions of the F–F distances (left), the F–H bond lengths (center), and the intermolecular bending (F–H···F angle, right) from MD (solid black lines) and PIMD (dashed red lines) for a selection of systems: the HF dimer (top), the HF tetramer (middle), and the HF pentamer (bottom). The MD and PIMD averages are shown in black and red vertical dashes, respectively.[

