
Improved thermoelectric property of cation-substituted CaMnO3
[Kumar Pradeep†a)  , Kashyap Subhash C.
b) , Sharma Vijay Kumara) , Gupta H. C.b) ]
, Kashyap Subhash C.|
|


†Corresponding author. E-mail: sharmapradeep014@gmail.com
Single-phase pristine and cation-substituted calcium manganite (Ca1− xBi xMn1− yV yO3− δ) polycrystalline samples were synthesized by the solid state reaction technique. Their thermoelectric properties were measured by a set up that was designed and assembled in the laboratory. The Ca1− xBi xMn1− yV yO3− δ sample with x = y = 0.04 has shown a power factor ( S2 σ) of 176 μW/m/K2 at 423 K, which is nearly two orders of magnitude higher than that of the pristine sample (2.1 μW/m/K2). The power factor of the substituted oxide remains almost temperature independent as the Seebeck coefficient increases monotonically with temperature, along with the simultaneous decrease in electrical resistivity which is attributed to enhanced electron density due to co-doping of bismuth and vanadium and grain boundary scattering. These cation-substituted calcium manganites can be used as a potential candidate for an n-type leg in a thermoelectric generator (module).
High-temperature thermoelectric (TE) power generation has attracted great interest because it is an environmentfriendly technique. It has been used in the automobile sector where generated waste heat is utilized by converting it to electric energy, [1– 3] and it has also been used in solar thermoelectric generators.[4] However, the materials and devices that have been developed so far are too inefficient to be cost effective.[5] The development of new thermoelectric materials/ modules (comprising of alternate layers of n- and p-type semiconductors) and the improvement of existing materials to enhance thermoelectric efficiency are essential for their largescale application in power generation. The thermoelectric conversion efficiency of a thermoelectric material is governed by its dimensionless figure of merit (ZT) which depends on three physical parameters, namely: electrical conductivity (σ ), Seebeck coefficient (S), and thermal conductivity (κ ). Figure of merit (ZT) is defined as

In metallic materials, the three parameters (S, σ , and κ ) are primarily controlled by carrier concentration. Therefore, a very high value of carrier concentration (nearly 1028 m− 3) causes a serious limitation in the development of an efficient metallic material for practical applications because it simultaneously affects both σ and κ . The value of a dimensionless parameter ZT, called figure of merit, has very small values for metals.
Several non-oxide thermoelectric materials, such as skutterudites, clathrates, and some chalcogenide alloys possess a value of ZT exceeding 1; for example, Ba0.08La0.05Yb0.04Co4Sb12, a skutterudite compound, has a ZT of 1.7 at 850 K.[6] Substituted PbTe alloys, clathrates (e.g., Ba8Ga16Ge30) and chalcogenide-based alloys (i.e., In4Se3− δ ) are reported to have a ZT of nearly 1.5/1.48 at 773/705 K[7, 8] and 1.3 at 900 K, [9] respectively. However, these materials have some serious limitations at high temperatures, including instability (melting), surface oxidation, phase transitions, and the toxic nature of certain constituents (e.g., Pb). Furthermore, the high cost of fabricating and depositing a preventive surface coating poses a limitation to the use of these materials at high temperatures.
The oxide materials (manganates and titanates) are promising for high-temperature thermoelectric applications due to their inherent favorable characteristics. The raw materials used for the preparation of these composite oxides are generally non-toxic in nature and are highly abundant. These oxides possess high chemical and thermal stability, and hence a large thermal gradient can be applied across them, which enables their efficient use at higher temperature. Finally, the structure of oxides allows large-scale, structural, and compositional tailoring.
The oxide materials, which can be either p type or n type, are employed to form a thermoelectric module (comprising of alternate layers of both n type and p type), which finds application in waste heat recovery from automobiles, boilers, and furnaces. From the application point of view, the efficiency of a thermoelectric module will be governed by the power factor (S2σ ) of both n- and p-type materials. The substituted n-type oxides (e.g., SrTiO3 and CaMnO3) possess a smaller value of ZT = 0.36 at 1076 and 1045 K[10, 11] and 0.21 at 1000 K, [12] respectively, compared to the p-type counterparts.[13] The efficient use of CaMnO3 in a thermoelectric module calls for an enhancement in its figure of merit. The thermoelectric properties of CaMnO3(ABO3-based perovskite) can be improved by substitution at either the A or B site in the lattice.[14]
It is expected that the dual doping in CaMnO3 at the A and B sites can be utilized to improve the TE performance by suitably modifying electrical and thermal conductivity. Optimization of carrier concentration is one of the ways to obtain improved thermoelectric performance; as evidenced by co-doping in CaMnO3 with Bi and Nb, which has also increased the carrier concentration, leading to an increase in the power factor, and hence the figure of merit rises to 0.1 at 873 K.[15] In another case, the substitution of the A site with strontium and the B site with ytterbium enhances the thermoelectric performance.[16]
In the present case, an attempt has been made to further improve the TE performance of polycrystalline bulk CaMnO3 by a single substituent (Bi) and dual substituents (Bi, V), and to understand their role. The substitutions of Ca2+ with Bi3+ and Mn4+ /Mn3+ with V5+ are expected to enhance the carrier concentration and oxygen vacancies. In turn, they are expected to improve ZT via appropriate changes in the electrical and thermal conductivity of the substituted oxides.
Pristine as well as singly and doubly substituted polycrystalline samples of Ca1− xBixMnO3-δ with x = 0.0, 0.02, 0.04, and 0.1, and of Ca1− xBixMn1− yVyO3 with x = y = 0, 0.04, 0.06 were synthesized using the conventional solid state reaction technique. Stoichiometric ratios of the carbonates (CaCO3 and MnCO3) and metal oxides (Bi2O3 and V2O5) were thoroughly mixed using a mortar and pestle, and calcined at 1123 K for 10 hours. The resulting lumps were powdered and pressed in the form of rectangular bar shaped pellets with a size of 15 × 5 × 3 mm3. The bars of different compositions were sintered in air at 1573 K and 1423 K, respectively, for 10 hours each.
The XRD measurement of both sets of samples were performed by employing a diffractometer (Philips Xpert Pro) using Cu-Kα radiation (λ = 1.5402 Å ) in θ – 2θ mode with a step size of 0.02° for phase analysis of the samples. Compositional analysis, i.e., energy dispersive analysis of x-ray (EDAX), was performed by scanning electron microscope (Zeiss EVO 50). The electrical resistivity measurement was made by a dc fourprobe technique. Thermopower measurement was carried out on a self-designed system that was developed in the laboratory. Both electrical and thermal measurements were carried out in a rotary vacuum.
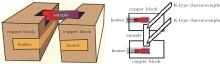
The thermopower measurement set up consists of two identical copper blocks (dimension: 40 × 18 × 15 mm3, separated by 9 mm, see Fig. 1), which are used as a heat source and a sink. Rectangular grooves of dimension 38 × 14 × 7 mm3 are carved out of the copper blocks to house the heaters to ensure efficient and fairly uniform heating of the blocks. A smaller groove of dimension 7 × 3 × 5 mm3 is made at the top of each of the Cu blocks, so that a sample of dimension 7 × 15 × 5 mm3 can tightly fit in the grooves for effective heating from the three sides of the sample. Each end attains the temperature of the block in which it fits. Both of the copper blocks are thermally insulated from each other with the help of a 9-mm-thick insulator. A schematic of the Seebeck coefficient measurement set up is shown in Figs. 1(a) and 1(b). The sample assembly was placed inside a vacuum chamber at a pressure of 10− 3 Torr. Thermocouples (K-type) were placed in direct contact at both the ends of the sample, and the thermoemf (and hence temperature) was measured with a Keithley source meter (Model 2420).
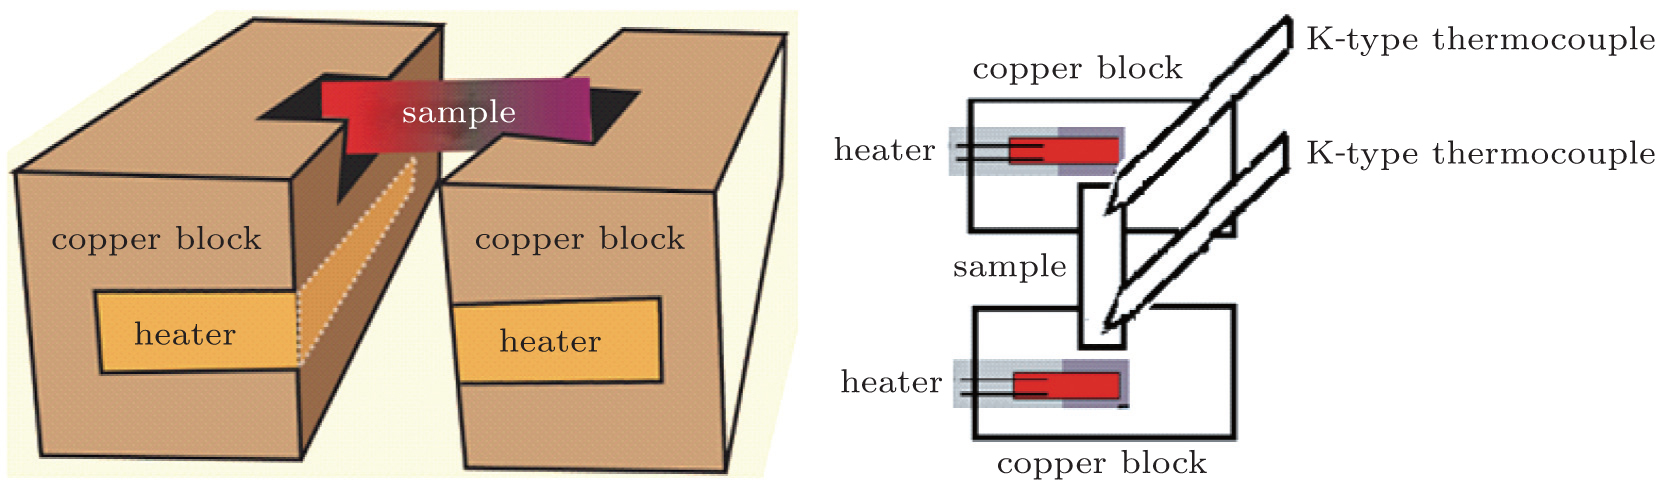 | Fig. 1. Schematic of thermopower measurement set up. (a) Location of sample holder and heater; (b) location of thermocouple on the sample. |
The composition of polycrystalline samples of Ca1− xBixMnO3-δ with x = 0.0, 0.02, 0.04, and 0.1 is analyzed using energy dispersive x-ray analysis. The compositions of various samples are obtained by normalizing the peak intensity corresponding to different elements after ignoring the peaks of carbon. The results are summarized in Table 1.
| Table 1. Composition of polycrystalline Ca1− xBixMnO3-δ samples. (a) Desired composition, (b) obtained from EDAX analysis. |
It may be noted from Table 1 that the concentration of cations in the samples agrees by and large with that of the starting mixtures (the desired composition values are given in the table). A small deviation in the estimated concentration of O2− from the corresponding stoichiometric composition can be attributed to surface adsorbed oxygen.
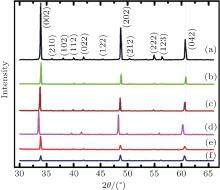
Figure 2 shows the x-ray diffractograms (XRD) of Ca1− xBixMnO3− δ and Ca1− xBixMn1− yVyO3− δ samples. The diffraction analysis confirmed the formation of single phase with orthorhombic structure (JSPDS File No. 761132) in both sets of samples. There is no other impurity phase or unreacted metal constituents in these samples. The lattice parameters of the samples of different compositions are estimated from the XRD data.
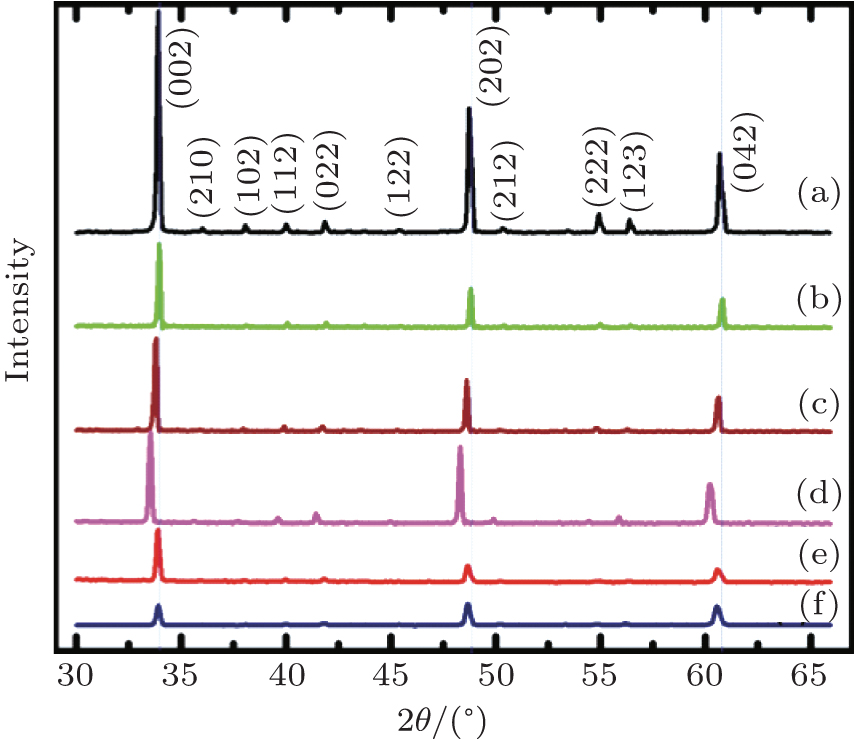 | Fig. 2. X-ray diffractograms of polycrystalline Ca1− xBixMn1− yVyO3− δ samples: (a) x = y = 0.0, (b) x = 0.02, y = 0.0, (c) x = 0.04, y = 0.0, (d) x = 0.10, y = 0.0, (e) x = y = 0.04, and (f) x = y = 0.06. |
| Table 2. Variation of lattice parameters and activation energy for the charge transport (Ea) in pristine and substituted polycrystalline samples (a– f) of Ca1− xBixMn1− yVyO3− δ . |
It is observed that with the increase in the amount of substituents (bismuth and vanadium), the lattice parameters a, b, and c all understandably increase monotonically. The cell volume increases from 206.81 Å 3 for un-substituted CaMnO3 to 212.99 Å 3 for the substituted samples with x = 0.1, y = 0.0, and 209.69 Å 3 with x = y = 0.06. The increase in cell size confirms the substitution of cations because the ionic radii of Bi3+ in 8-fold co-ordination (1.17 Å ) is larger than that of Ca2+ in 8-fold co-ordination (1.12 Å ) while that of V5+ in 6-fold coordination is 0.54 Å , which is bigger than that of Mn4+ in 6-fold co-ordination (0.53 Å ).[17] The ionic radius of oxygen is taken as 1.40 Å .[18]
The substitution of cations may induce distortion in the unit cell of the manganite. The tolerance parameter t describes the structural distortion of ABO3-type perovskites induced by cation substitution. It is defined as
where RA, RB, and RO are the ionic radii of A, B, and O ions in the respective co-ordination. For the cubic perovskite structure, it can be seen that t is close to 1. In this case, the oxygen octahedra around the Mn ions are located exactly at the corners of the cubic perovskite structure. However, in the event of smaller RA or larger RB, i.e., as t deviates from 1, the geometric distortion gradually increases. Therefore, the deviation in value of t confirms the enhancement of the orthorhombic distortion. To calculate the tolerance factor in the present case, the coordination numbers of the A-site ion, B-site ion, and O ion are taken as 12, 6, and 6, respectively, and Shannon' s ionic radii[18] are used. The calculated values of the tolerance factor are found to be close to 1 for the CaMnO3 and to lie between 0.974 and 0.976 for the substituted samples. The deviation in value of t from 1 confirms the structural distortion.
The Seebeck coefficient is measured by using a quasisteady state measurement technique. During all of the measurements, a temperature difference (Δ T = T2 − T1) of 10 K is maintained at an average temperature T (T = (T1 + T2)/2) across the sample. Here T1 and T2 are the temperatures of the two ends of a sample. The slope of variation of thermo-emf with applied temperature gives the value of the Seebeck coefficient (S = Δ V/Δ T).[19] The negative Seebeck coefficient of all of the samples implies that electrons are the dominant charge carriers.
The Seebeck coefficient of pristine CaMnO3 at room temperature is estimated to be − 495 μ V/K, which is marginally lower than the maximum reported value (∼ − 510 μ V/K).[20] The substituted samples (Ca1− xBixMn1− yVyO3− δ , with x = y = 0.02 and x = y = 0.06) recorded negative low values of the Seebeck coefficient (100– 120 μ V/K).
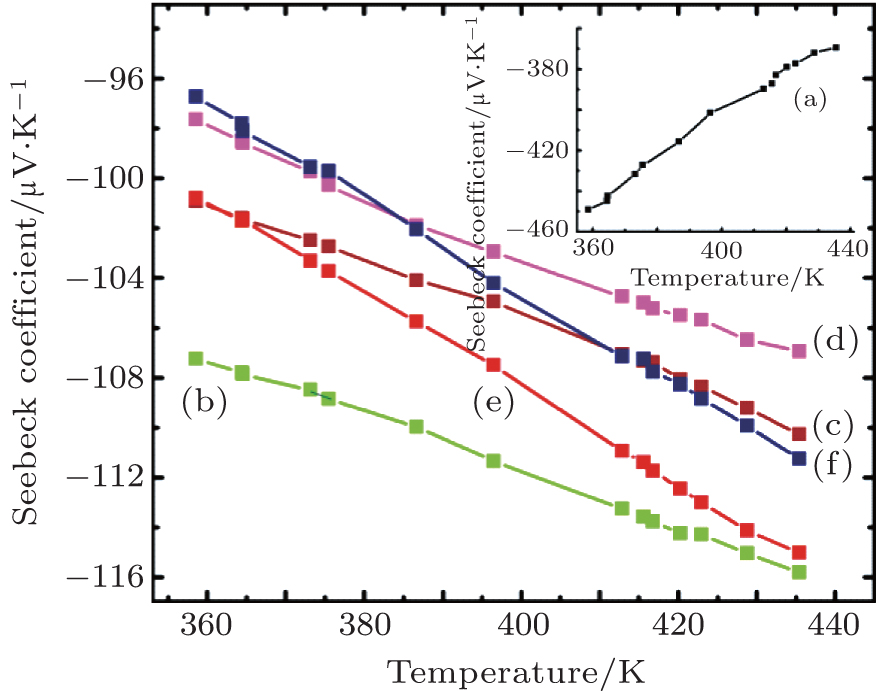 | Fig. 3. Temperature variation of thermopower of Ca1− xBixMn1− yVyO3− δ samples: (a) x = y = 0.0, (b) x = 0.02, y = 0.0, (c) x = 0.04, y = 0.0, (d) x = 0.10, y = 0.0, (e) x = y = 0.04, and (f) x = y = 0.06. |
It may be noted from Fig. 3 (curves (b)– (f) and the inset curve (a)) that there is a monotonic increase in the absolute value of the Seebeck coefficient of both pristine and substituted CaMnO3 with an increase in temperature. However, the absolute value of the Seebeck coefficient is observed to decrease with an increase in the concentration of the substituents (Bi, V). For degenerate semiconductors, the dependence of the Seebeck coefficient on the carrier concentration and temperature is expressed as[21]

where n denotes the carrier concentration density and m is the effective mass of the carrier. Polycrystalline samples of CaMnO3, substituted with other transition metals also shown similar behavior.[17]
Hall measurements are carried out on Ca1− xBixMn1− yVy O3− δ samples to estimate the carrier concentration density in these samples. The values obtained are summarized along with estimated crystallite size in Table 3. This table also includes the calculated values of important physical parameters (σ , S, and S2σ values).
| Table 3. Variation of carrier concentration, particle size, electrical conductivity (σ ), thermopower (S), and power factor (S2σ ) with composition. |
It may be noted from Table 3 that the carrier concentration monotonically increases with the increase in the concentration of the substituents. The crystallite size first increases and it then decreases with an increase in the concentration of the substituents. The electrical conductivity follows exactly the same trend as that followed by the crystallite size. The lattice scattering, lattice strain, and carrier concentration are known to affect the electrical conductivity. The ionic radii of the substituent ions are different from the host ions. This in turn increases the lattice strain (as estimated by distortion parameter) and also the scattering of charge carriers, which tends to reduce the electrical conductivity in our samples. The reduction in crystallite size increases the grain boundary area, and hence the grain boundary scattering reduces the electrical conductivity. With the increase in carrier concentration, there is a nominal decrease in the absolute thermopower of almost all the samples, as predicted by Eq. (3).
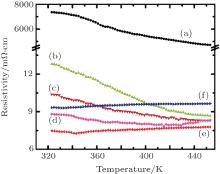
The variation of the electrical resistivity of Ca1− xBixMn1− yVyO3− δ samples with temperature is studied from room temperature to 450 K using the four-probe technique (see Fig. 4).
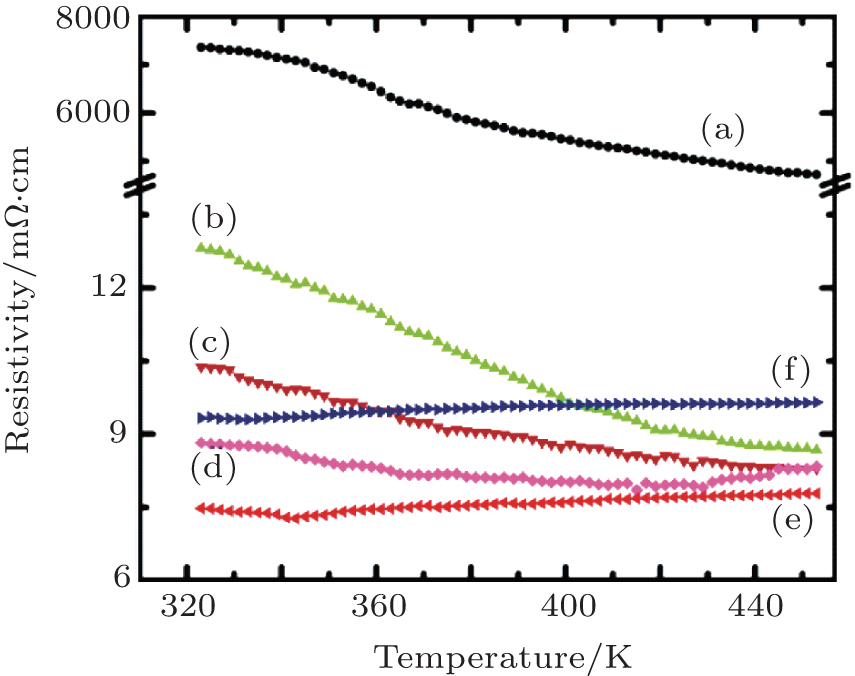 | Fig. 4. Variation of resistivity of Ca1− xBixMn1− yVyO3− δ samples with temperature: (a) x = y = 0.0, (b) x = 0.02, y = 0.0, (c) x = 0.04, y = 0.0, (d) x = 0.10, y = 0.0, (e) x = y = 0.04, and (f) x = y = 0.06. |
It may be noted from this figure that the manganite with a single dopant (Bi) retains a semiconducting nature (negative slope of dρ /dT in curves (b), (c), and (d)) along with an enhancement in carrier concentration, while co-doping with Bi and V transforms it to marginally metal like (positive slope of dρ /dT). This is driven by the compromise among carrier concentration, defects, and structural distortion. Similar behavior is observed in Yb and Nb co-substituted CaMnO3.[21] This nearly unchanged electrical resistivity with temperature is of great importance for the application of these co-substituted samples as n-type legs in a thermoelectric generator (module).[22]
The electrical conductivity of the manganites, following hopping conduction, [23, 24] can be expressed by
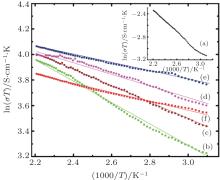
where n, e, a, A, Ea, k, and T are carrier concentration, electronic charge, hopping distance, pre-exponential constant, activation energy of hopping and Boltzmann constant, and absolute temperature, respectively. It can be seen that the increase in electrical conductivity can either be due to an increase in the number of charge carriers with the substitution of Bi and V, an increase in the hopping intersite distance, or it may be due to both. The straight line plots of ln(σ T) versus 1000/T for all of the samples establish the applicability of Eq. (4) for both pristine and substituted samples, as well as in the entire temperature range of the investigation, as shown in Fig. 5.
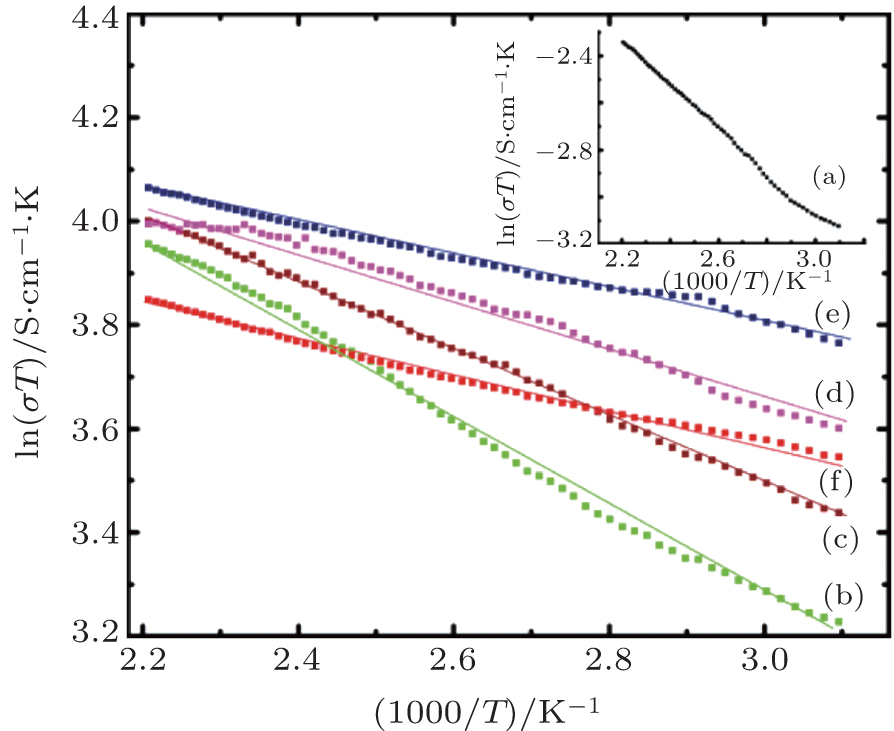 | Fig. 5. Plots of ln(σ T) versus 1000/T for polycrystalline Ca1− xBixMn1− yVyO3− δ samples. (a) x = y = 0.0, (b) x = 0.02, y = 0.0, (c) x = 0.04, y = 0.0, (d) x = 0.10, y = 0.0, (e) x = y = 0.04, and (f) x = y = 0.06. |
The inset in Fig. 5 shows the plot for the pristine CaMnO3. The activation energy for the charge transport Ea has been estimated from the slopes of the curves. It can be observed from Table 2 that the activation energy of the pristine sample is 78.8 meV, and it decreases to 30 meV for the cosubstituted Ca1− xBixMn1− yVyO3− δ sample with x = y = 0.04. This may possibly be due to the presence of energy states in the substituted/defect material, making the hopping of the charge carriers easier. With the further increase in the substituent concentration to x = y = 0.06, the activation energy is found to increase, which possibly explains the lower value of electrical conductivity of x = y = 0.06 sample as compared to x = y = 0.04. The enhanced activation energy may possibly be due to the distortion of (Mn, V) O6 octahedra, as evidenced by the decrease in the value of distortion factor (t) due to V doping at the Mn site, which results in the decreased mobility and dominates over the increase in carrier concentration.[25] The increase in system orthorhombicity (expressed as Or (%) = [(c − a)/(c + a)]) from 0 for unsubstituted CaMnO3 to 0.0017 for Ca1− xBixMn1− yVyO3− δ sample with x = y = 0.06 also supports the induced disorder on higher double substitution. Hence, except for the valence of substituents, which is responsible for conduction in the oxide, the size of the substituent is also an important parameter. It may be noted that no such behavior is seen when bismuth alone is used as a substituent on the calcium site.
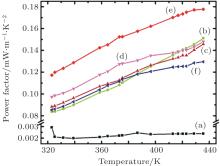
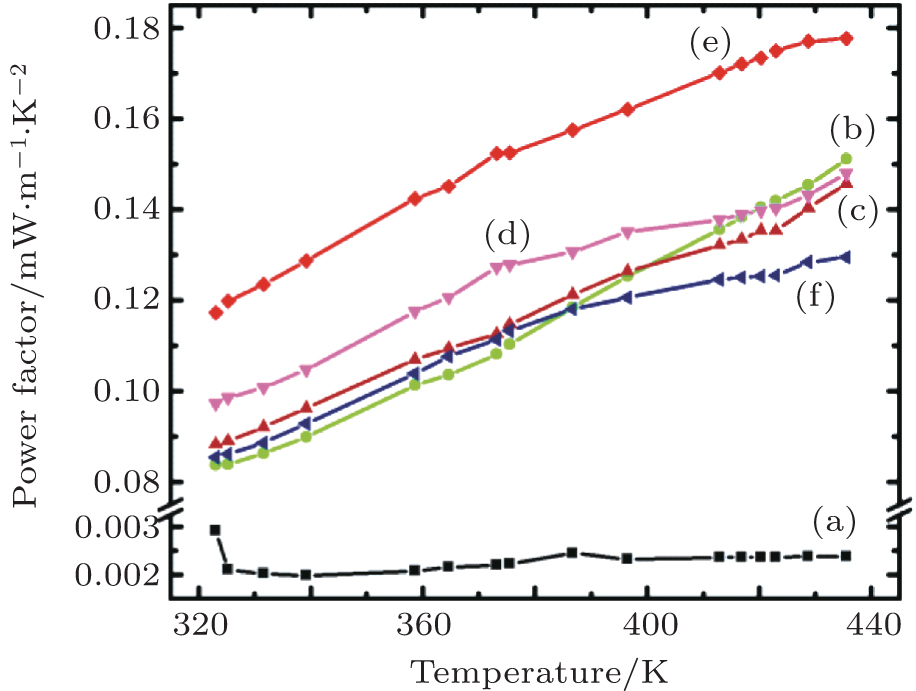 | Fig. 6. Variation of power factor of Ca1− xBixMn1− yVyO3− δ samples with temperature. (a) x = y = 0.0, (b) x = 0.02, y = 0.0, (c) x = 0.04, y = 0.0, (d) x = 0.10, y = 0.0, (e) x = y = 0.04, and (f) x = y = 0.06. |
Figure 6 shows the power factor, S2σ , of the manganite samples, which is calculated from the measured values of the Seebeck coefficient and electrical conductivity for all of the samples. It can be readily observed that with the increase in the amount of substituents, the electrical conductivity increases, while the Seebeck coefficient decreases. It can be directly observed that, on the one hand, the power factor for all the substituted samples increases monotonically with temperature. On the other hand, pristine CaMnO3 shows an almost temperature-independent PF. The power factor reaches its maximum value of 176 μ W/m/K2 at 423 K, for Bi and V cosubstituted sample (x = y = 0.04), which is strikingly higher (84 times) than that of pure CaMnO3 (2.1 μ W/m/K2). With a further increase in the concentration of substituents from 0.04 to 0.06, the power factor decreases, which may possibly be due to the distortion in the (Mn, V) O6 octahedra.[26] Thus, co-doping can be used as an effective tool to increase the thermoelectric performance of manganite.
A high-temperature thermopower measurement set up is designed and fabricated in the laboratory. It is used to estimate the thermopower of pristine and co-substituted calcium manganite samples up to 450 K. There is a three-order change in the electrical resistivity of the co-substituted sample (x = y = 0.04), along with a moderate decrease in the absolute value of the Seebeck coefficient. The power factor of the substituted sample is estimated to be 176 μ W/m/K2 at 423 K, which is strikingly higher (nearly two orders) than that of pure CaMnO3 (2.1 μ W/m/K2). In addition, the variation of electrical conductivity and Seebeck coefficient with temperature in the appropriate direction suggests the potential application of this material in thermoelectric modules and thermal sensors.
The authors acknowledge useful suggestions given by Prof. S. Chaudhary at the Department of Physics, IIT Delhi.
| 1 |
|
| 2 |
|
| 3 |
|
| 4 |
|
| 5 |
|
| 6 |
|
| 7 |
|
| 8 |
|
| 9 |
|
| 10 |
|
| 11 |
|
| 12 |
|
| 13 |
|
| 14 |
|
| 15 |
|
| 16 |
|
| 17 |
|
| 18 |
|
| 19 |
|
| 20 |
|
| 21 |
|
| 22 |
|
| 23 |
|
| 24 |
|
| 25 |
|
| 26 |
|