Defect stability in thorium monocarbide: An ab initio study

Defect stability in thorium monocarbide: An ab initio study |
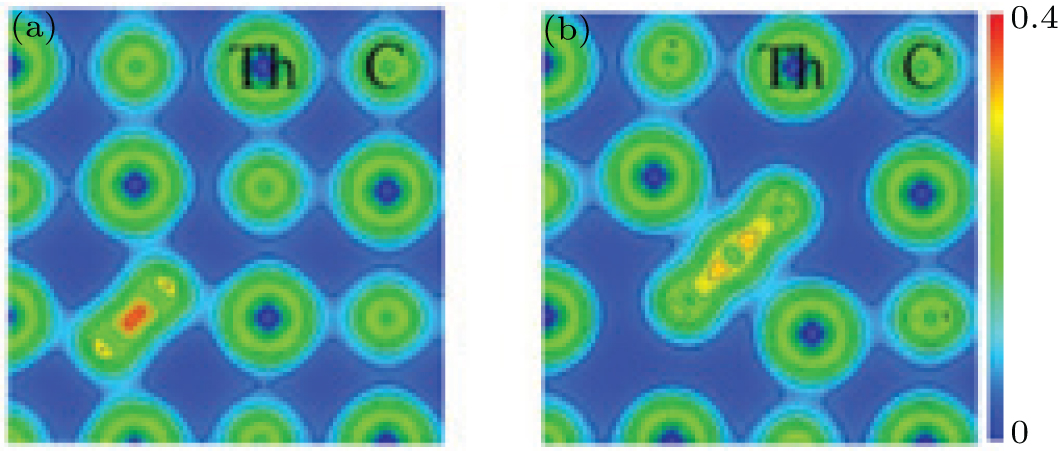
| Charge density distribution graph in (010) plane of ThC for (a) C2⟨110⟩ dimer and (b) C3 trimer. Red color for high electron density and blue color for low electron density. The contour interval is 0.05 electrons/Bohr3. |
 |