Gas adsorption and accumulation on hydrophobic surfaces: Molecular dynamics simulations

Gas adsorption and accumulation on hydrophobic surfaces: Molecular dynamics simulations |
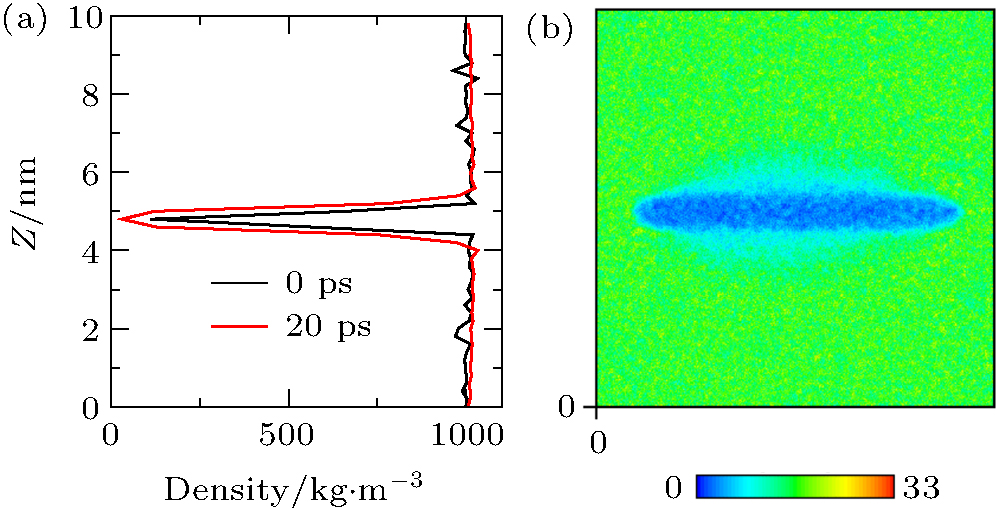
| (a) Water densities at 0 ps and 20 ps obtained by simulation of Case 3 show that, near the graphite, the density at 20 ps is distinctly lower than that at 0 ps. (b) Nephogram of water density at 20 ps obtained by simulation of Case 3 shows that the depletion layer appears at 20 ps. |
 |