†Corresponding author. E-mail: qiangliu@mail.tsinghua.edu.cn
*Project supported by the National Natural Science Foundation of China (Grant No. 61275146), the Research Fund for the Doctoral Program of Higher Education of China (Grant No. 20120002110066), and the Special Program of the Co-construction with Beijing Municipal Government of China (Grant No. 20121000302).
The 30 at.% Ho: BaY2F8 crystals were grown by the Czochralski method, and their spectroscopic properties are analyzed systematically by standard Judd–Ofelt theory. The Judd–Ofelt intensity parameters are estimated to be Ω2 = 6.74 × 10⁻²⁰ cm2, Ω4 = 1.20 × 10⁻²⁰ cm2, and Ω6 = 0.66 × 10⁻²⁰ cm2, and the fluorescence branching ratios and radiative lifetimes for a series of excited state manifolds are also determined. The emission cross sections with our measured infrared luminescence spectra, especially important for 4.1 μm, are calculated to be about 4.37 × 10⁻²¹ cm2. The crystal quality is preliminarily tested through a mid-infrared laser emission experiment.
The 3– 5 micron mid-infrared lasers are of significance for applications due to their many good characteristics, such as high transmittance through atmosphere, low background noise and special absorption spectrum of most important gas molecules.[1– 3] Currently, with the nonlinear frequency conversion technology, high energy or high average power midinfrared lasers can be obtained.[4– 6] Nonetheless, the overall design principle and mechanical structure, at least two-stage scheme, still seem to be a little complex. Meanwhile, the quantum cascade laser (QCL) based on intersubband transitions within a multiple-quantum-well structure can obtain a wide tuning range of 3– 25 μ m.[7] However, it is difficult to further improve the output power and efficiency in a short term. With the development of material science and engineering, some new fabricated laser crystals are found to have low enough multi-phonon decay rates, which are beneficial to long wavelength emission, such as rare earth (RE) or transition metal (TM) ions doped hosts.[8– 10] In consequence, utilizing the direct pumping scheme of only single-stage oscillator will be increasingly significant to obtain mid-infrared laser.
Among the RE-ion doped crystals, holmium-doped barium yttrium fluoride (Ho3+ :BaY2F8, simplified as Ho: BYF) has been proven to emit 3.9 μ m pulsed laser efficiently.[11, 12] In 2011, Tsuboi et al.[13] first investigated the ultraviolet, visible, and near IR luminescence spectra (< 2.4 μ m) of Ho: BYF at room temperature and by cryogenic cooling way separately. To date, no one has calculated the detailed spectroscopic parameters of Ho: BYF completely with the Judd– Ofelt (J– O) theory, [14, 15] which are vital to the dynamics analysis of Ho: BYF laser. And Stutz et al.’ s model of 3.9 μ m Ho: BYF laser[16] still has some flaws. More importantly, the parameters are crucial for designing the way to co-dope sensitized ion into Ho: BYF to further enhance the mid-infrared excitation efficiency.
In this work, we will analyze in detail the spectroscopic properties of heavily-doped Ho: BYF crystal, grown by Czochralski (CZ) method. With the calculations of three phenomenological J– O intensity parameters Ω i (i = 2, 4, 6), we can further obtain the transition parameters, including spontaneous emission probabilities, fluorescence branching ratios and radiative lifetimes, etc. Additionally, the emission cross sections can be calculated with two different methods, based on absorption spectra or luminescence spectra.
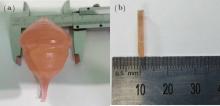
For growing the Ho: BYF single crystal, the spectrophotometric grade oxide reagents of Ho2O3, Y2O3, and BaCO3 were taken as the raw materials, and the molar ratio was 0.3:0.7:1. The oxide reagents were first dissolved by the reaction of halogenation with hydrochloric acid, and Ho: BYF with monoclinic structure was synthesized at a high temperature of 800 ° C by hydrothermal and co-precipitation methods. Single crystal Ho: BYF was grown by CZ method in a platinum crucible and the chamber was first vacuumized to about 0.003 Pa. The crucible was maintained at a temperature of 800 ° C with graphite resistance heating system for 10 h, then, high-purity argon gas (> 99.999%) and volume fraction of 5% hydrogen fluoride gas were flowed into the furnace to further eliminate the water and oxygen. After seeding in the direction b, [010], the crystal rotation and pulling rates were fixed at 5 rpm and 1 mm/h, respectively, and the pressure was increased to 0.02 MPa. Finally, we obtained a transparent Ho: BYF crystal with holmium-doped concentration of 30 at.%, as shown in Fig. 1, and it has adequate quality for the x-ray diffraction analysis.[17] The size of manufactured Ho: BYF crystal for spectrum measurement was 15 mm × 7.5 mm × 2 mm with a rectangular section, and two end faces were uncoated.
The absorption spectrum of Ho: BYF in a wavelength range of 200– 2500 nm was measured with a UV– Vis– NIR spectrophotometer (Cary 5000, UV1009M292, Agilent Technologies), whose spectral resolution is 0.02 nm in the ultraviolet (UV) range and about 0.5 nm in the near infrared (NIR) range. The infrared luminescence spectrum of Ho: BYF, pumped by a CW tunable Ti: sapphire laser (Mira 900-D, Coherent), was detected with a liquid-nitrogen cooled InSb photo-diode (Dmni-λ 3015, Zolix) and a lock-in amplifier (Model420, Scttec).
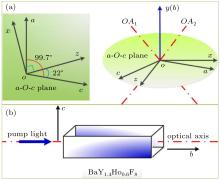
The host material of Ho: BYF is monoclinic biaxial BaY2F8 crystal, whose crystallographic axes, principal axes and optic axes are shown in Fig. 2(a). Apparently, only the b crystallographic axis coincides with the y principal axis, and the angle between two other crystallographic axes is about 99.7° . Trivalent holmium ion (Ho3+ ) is merely a little smaller in size than trivalent yttrium ion (Y3+ ), but quite different from barium ion (Ba2+ ). So Ho3+ will substitute for Y3+ more easily than Ba2+ in BaY2F8, and Ho: BYF crystal has nearly the monoclinic structure.[18] The phonon energy of BaY2F8 is about 420 cm− 1 according to the vibrational spectra measured by Kaminskii[19] or Guilbert, [20] and is almost the lowest among fluorides. Figure 2(b) shows the cut direction of our samples, so the laser propagates through the b axis.
The transmittance spectra of Ho: BYF at room temperature of 298 K are shown in Fig. 3, including UV range of 200– 385 nm in Fig. 3(a), visible range of 385– 850 nm in Fig. 3(b), and near-infrared range of 850– 3200 nm in Fig. 3(c). Apparently, there is a series of characteristic absorption peaks in these figures, and some of them are listed in Table 1 with their corresponding transition processes.
 | Fig. 3. Measured transmittance spectra of 30 at.% Ho: BYF at room temperature. (a) UV light band, (b) visible light band, (c) near IR light band. |
| Table 1. Values of wavelength of absorption peak (λ ap) and the corresponding transitions from measured spectra in Fig. 3. |
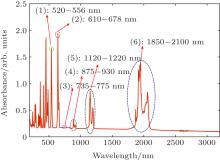
The optical density spectrum is shown in Fig. 4, which can be easily calculated with transmittance spectra from the following expression:

where OD(λ ) is the optical density varying with wavelength λ , and T(λ ) is the transmittance through Ho: BYF.
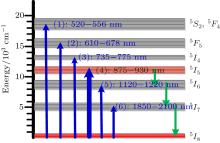
We choose six important absorption bands from Table 1 based on the absorption spectrum, and depict the seven lower energy level distributions in Fig. 5.
Only in consideration of the electric dipole (ED) transitions, [21– 23] can the spectral line strengths SJJ′ and the oscillator strengths PJJ′ of six chosen transitions above be obtained with Judd– Ofelt theory from the following expression:

where J (J′ ) is the total angular momentum of ground state (excited state), h the Planck’ s constant, c the light speed in vacuum, λ a the average absorption wavelength of transition, lc the length of Ho: BYF, E the electron charge, n the refractive index of Ho: BYF corresponding to λ a, m the electron mass, and χ = (n2 + 2)2 / 9n the field correction factor.[22] For Ho: BYF, the value of J is 8, and the length lc is 2 mm.
In addition, the relations among single-pass absorption coefficient α (λ ), absorption cross section σ a(λ ) and OD(λ ) can be easily derived as follows:

where e is the base of natural logarithm. Obviously, when OD(λ ) and lc are given, α (λ ) and σ a(λ ) can be easily obtained, meanwhile, the refractive index n (λ ) is needed to further figure out SJJ′ and PJJ′ .
One-term Sellmeier dispersion equation of BaY2F8 can be referred from Ref. [24] by Weber in 1995 as follows:

The calculated refractive indices are only mean values, and the coefficients A = 0.0053 and B = 0.7707.
Considering the refractive indices at wavelength of 589.3 nm are 1.5235, 1.5356, and 1.5145, respectively for (x, y, z) axes, [24] we calculate the angle β = 41.07° between optic axes (OA1 or OA2 as shown in Fig. 2(a)) and y-axis from the following expression:

Apparently, the BYF crystal is biaxial positive as nx is closer to ny in magnitude than to nz, namely β < 45° . For the holmium doped BYF crystal, we assume that the dispersion equation is the same as that of BYF crystal.
In general, birefringence will appear when light passes through a biaxial crystal along neither of its optic axes, and the refractive indices are different for two kinds of extraordinary light. However, we neglect the walk-off effect to simplify the calculation process, and take the mean refractive index of principal axes in Eq. (4) as the value of undetermined n(λ ) in Eqs. (2) and (3).
Substituting the values of refractive index and the optical density into Eqs. (2) and (3), we obtain the values of SJJ′ and PJJ′ as listed in Table 2, and calculate the values of α (λ ) and σ a(λ ) of six typical absorption peak wavelengths, which are listed in Table 3.
| Table 2. Calculated results of spectral line strengths SJJ′ and oscillator strengths PJJ′ . |
| Table 3. Calculated results of α (λ ) and σ a (λ ) for six typical wavelengths of absorption peaks. |
The relationship between the ED line strengths SJJ′ and J– O intensity parameters Ω i can be expressed as

where U(i) is the irreducible tensor of ED operator, 〈 4fnψ J| | U(i)| | 4fnψ ′ J′ 〉 is usually written as | U(i)| 2 which is doubly reduced matrix element.[21] In order to calculate Ω i, the value of | U(i)| 2 is needed at least with three different transition processes. Considering the fact that the host material has little effect on the value of | U(i)| 2, we take this value as the value of Ho3+ in aqueous solution (aq), or Ho3+ in LaF3 crystal in Refs. [25] and [26], and list | U(i)| 2 of six different transitions[26] in Table 4.
| Table 4. Doubly reduced matrix element for Ho3+ . |
Apparently, with different transitions, an equation set is obtained in the form of matrix as follows:

where M is the matrix of the reduced matrix elements, in which each row vector is corresponding to one kind of transition, S the matrix of ED line strengths, and Ω the matrix of J– O intensity parameters.
According to the known values in Tables 2 and 4, we obtain the matrixes S and M as follows:
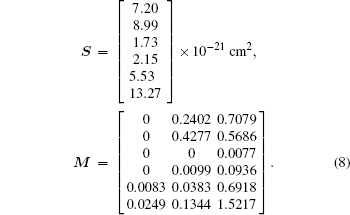
The number of rows of matrix M is always larger than that of matrix Ω , optimization method is necessary to find the approximate solution. Herein we use the least square method (LSM) and the optimal solution Ω op is obtained as

Meanwhile, to calculate the fitting error, we substitute the oscillator strengths in Eq. (2) and spectral line strengths in Eq. (7) with the above optimal solution Ω op, namely they are expressed as follows:

where Sexp and Pexp are matrixes of spectral line strengths and oscillator strengths respectively based on experiment, while Scal and Pcal are counterparts based on the optimal solution.
The errors δ S and δ P, corresponding to the calculated line strengths and the oscillator strengths respectively, are then shown below in the form of root-mean-square error (RMSE).

Finally, we obtain the results of Ω op, δ S, and δ P as follows:

The J– O intensity parameters of Ho3+ single-doped crystal for many kinds of glass hosts or fiber hosts have been reported. Here, we enumerate some of them in Table 5, [27– 32] and compare them with those of the present BYF-based crystal. It can be easily found from Table 5 that the Ω 2 parameter of Ho: BYF is much larger than those of other fluoride crystals and similar to those of ZnCl2-based chloride crystal and Sc2O3-based oxide ceramic, indicating that the covalency of chemical bond between holmium and fluoride ions is relatively strong; [33] the Ω 6 parameter of Ho: BYF is very small, so the spontaneous emission probability should be small and the radiative lifetime may be large; [34] the Ω 4/Ω 6 value of Ho: BYF is a little smaller than those of ZnCl2, KYF or SC2O3-based crystals, which reflects that the fifth odd term of crystal field has a more important influence on the 4fn transition than the third odd term.[35]
| Table 5. J– O intensity parameters of several Ho3+ single doped crystals. |
With the J– O intensity parameters, we calculate the radiation transitional parameters, [23] such as spontaneous emission probability AJJ′ , fluorescence branching ratio β JJ′ and radiative lifetime τ J from the following expressions:
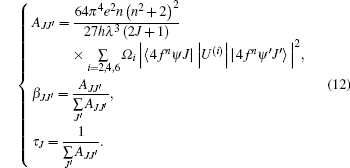
The emission transition parameters are calculated with Eqs. (5) and (12), and the results are listed in Table 6 for emission probability AJJ′ , fluorescence branching ratio β JJ′ , and in Table 7 for radiative lifetime τ J.
The effect of magnetic dipole (MD) is not considered in this work, so the spurious exceptions can be expected in Tables 6 and 7 compared with the results in Ref. [16], such as the radiative lifetime of 5I7 (about 42 ms, larger than about 17 ms in Ref. [16]), and the radiative lifetime of 5I6 (about 18.4 ms, also larger than about 5.4 ms in Ref. [16]), but the fluorescence branching ratios β 56, β 57, β 58 (0.057, 0.563, 0.380) are similar to those (0.0674, 0.5381, 0.3944) of Ho: YLF crystal in Ref. [24]. Apparently, the calculated radiative lifetimes are a little larger than the values reported in Ref. [16]. It is because, on the one hand, the Ho3+ concentration is different from those of samples in Ref. [24], on the other hand, our standard Judd– Ofelt model neglects the effects of magnetic dipole.
If we only take account of the contribution of MD to emission probability, then equation (11) can be counted as follows:[23]

where Amd is the contribution of MD to emission probability, Smd is the MD transition spectral line strength, L is the angular momentum operator, and S is the spin operator.
In the LS coupling scheme, the contributions of MD to emission probability of transitions 5I7 → 5I8, 5I6→ 5I7, 5I5 → 5I6, 5I4 → 5I5, 5F4 → 5F5 are 21.61 s− 1, 11.57 s− 1, 5.40 s− 1, 2.46 s− 1, and 7.32 s− 1, respectively. Obviously, the radiative lifetimes and the fluorescence branching ratios will change accordingly, and the adjusted radiative lifetimes of 5I7, 5I6, 5I5, 5I4 are 22.03 ms, 15.15 ms, 25.32 ms, and 50.63 ms, respectively. Assuming that the observed lifetimes are the same as those in Ref. [16], namely the radiative lifetimes of 5I7, 5I6, 5I5 are 17 ms, 5.4 ms, and 0.052 ms, respectively, the non-radiative lifetimes of 5I7, 5I6, 5I5 can be easily calculated to be 74.46 ms, 8.39 ms, and 0.0521 ms, respectively, based on the following equation:

where 𝜏 nr is the non-radiative lifetime, Wnr is the nonradiative relaxation rate, τ m is the observed radiative lifetime, and τ r is the calculated radiative lifetime.
| Table 6. Calculated results of emssion transional parameters (AJJ′ and β JJ′ ). |
| Table 7. Calculated results of emssion transional parameter τ J. |
Finally, we further calculate the emission cross section σ e with the equation of reciprocity relating emission to absorption derived by McCumber[36] and Payne et al., [37] which is given as

where vs is the frequency of signal light, Zl and Zu are the partition functions of the lower and upper manifolds, respectively, E0 is the energy difference between the lowest crystalfield level of the upper laser state and the lowest crystal-field level of the lower laser state, kB is the Boltzmann constant, and the temperature T of the laser crystal is assumed to be room temperature of 298 K. The Zl/Zu, and E0 are very important parameters for the calculation, herein we mainly refer Walsh et al.’ s paper[23] in which the spectroscopic properties of Ho: YLF was analyzed.
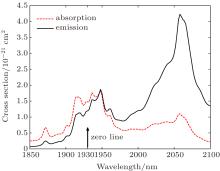
With the experimental value of σ a in Table 3, we obtain σ e for several chosen transitions as shown in Table 8. A detailed emission cross section spectrum around 2 μ m is shown in Fig. 6, and the emission peak is around 2060 nm. Obviously, it is impossible to obtain σ e for some other transitions, whose emission wavelength is beyond the absorption spectral range.
| Table 8. Calculated results of emission cross section with the McCumber law. |
The luminescence spectra at room temperature of 298 K are shown in Fig. 7, including the near-infrared range of 1850– 2300 nm in Fig. 7(a), the mid-infrared range of 2775– 3050 nm in Fig. 7(b), and 3700– 4400 nm in Fig. 7(c). Apparently, three characteristic emission peaks exist, and we list them in Table 9 together with their corresponding transition processes, and calculate the emission cross section at the wavelength of emission peak, λ ep.
| Table 9. Calculated results of emission cross section with Fü chtbauer– Ladenburg equation. |
According to the Fü chtbauer– Ladenburg law[38] in Eq. (16), we calculate the emission cross section for radiation transition

where λ e is the emission wavelength, I(λ e) the absolute value of emission intensity, and η the quantum emission efficiency. Herein we assume η = 1 without considering the non-radiative transitions.
The emission section at 2080 nm is about 2.09 × 10− 21 cm2 based on the reciprocity equation (15), a little smaller than that based on Fü chtbauer– Ladenburg law, 3.82 × 10− 21 cm2. The main causes may be firstly that the vibronic interaction in Ho: BYF is prominent, resulting in non-reciprocity of σ e and σ a.[39] Secondly, the quantum emission efficiency should be less than 1 for the high dopant concentration. Meanwhile, the preliminarily calculated results for 2848 nm and 4100 nm are 2.82 × 10− 21 cm2 and 4.37 × 10− 21 cm2, respectively, with the emission spectra.
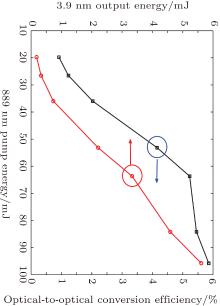
A mid-infrared Ho: BYF laser of plano– plano cavity is preliminarily built with our double lamp pumped Cr3+ : LiSAF laser, with a centarl wavelength of 889 nm. Cr3+ : LiSAF laser is operated with a repetition rate of 1 Hz and pulse duration of 50 μ s, and its maximum output energy is 100 mJ. The size of Ho: BYF crystal is 3 mm × 3 mm × 2.8 mm. The transmittance of output mirror is 20% at 3.9 μ m and a long-pass filter is used to inhibit the residual pump light. The output energy of 3.9 μ m laser is about 5.61 mJ with an optical-to-optical conversion efficiency of 5.81%. Detailed output characteristics are shown in Fig. 8. The spectra are confirmed to be around 3886– 3905 nm with a grating monochromator and the pulse width is about 35 μ s. The output ability of our crystal is similar to the results given by Tabirian et al.[12] and Stutz et al.[16] when the pump energy is lower than 100 mJ. But Tabirian et al.[12] obtained a maximum energy of 30 mJ with a 1 cm in length, 20 at.% concentrated Ho:BYF crystal when the pump energy was increased to more than 320 mJ. And Stutz et al.[16] scaled up the output to 55 mJ with a 8 mm in length, 30 at.% concentrated Ho:BYF crystal when increasing the pump energy to more than 600 mJ. Considering the fact that the output of our Cr3+ :LiSAF laser is limited, we will investigate more detailed characteristics of the laser with our crystal in future studies.
In summary, to our knowledge, it is the first time to systematically analyze the spectral properties of Ho: BYF crystal based on the standard Judd– Ofelt theory. With our 30 at.% Ho: BYF crystal, grown by the CZ method, the single-pass absorption coefficient, absorption cross section and J– O intensity parameters are determined with the measured absorption spectra. The optimized Ω i (i = 2, 4, 6) are Ω 2 = 6.74 × 10− 20 cm2, Ω 4 = 1.20 × 10− 20 cm2, and Ω 6 = 0.66 × 10− 20 cm2. Furthermore, with the calculated Ω i, we calculate the spontaneous emission probabilities, the fluorescence branching ratios, the radiation lifetimes and emission cross sections for a series of excited state manifolds, especially important for 5I5 → 5I6 and 5I7→ 5I8 transitions, whose emission wavelengths are about 4 μ m and 2 μ m, respectively. Then, we conduct a contrastive calculation of emission cross section with the McCumber law based on the absorption spectra and the Fü chtbauer– Ladenburg law based on the measured luminescence spectra. The three important emission cross sections at wavelengths of 2080 nm, 2800 nm, and 4100 nm are 3.82 × 10− 21cm2, 2.82 × 10− 21 cm2, and 4.37 × 10− 21 cm2, respectively. The results are basically satisfactory with our primary analysis. However, to obtain a more accurate calculation for Ho: BYF, a modified Judd– Ofelt model can be adopted.[38] Furthermore, detailed emission spectra for more transition processes can be measured to verify whether the values of Zl / Zu, and E0 are reasonable. Finally, the preliminary mid-infrared laser emission experiment proves our crystal quality, and the 3.9 μ m laser energy is obtained to be about 5.61 mJ.
| 1 |
|
| 2 |
|
| 3 |
|
| 4 |
|
| 5 |
|
| 6 |
|
| 7 |
|
| 8 |
|
| 9 |
|
| 10 |
|
| 11 |
|
| 12 |
|
| 13 |
|
| 14 |
|
| 15 |
|
| 16 |
|
| 17 |
|
| 18 |
|
| 19 |
|
| 20 |
|
| 21 |
|
| 22 |
|
| 23 |
|
| 24 |
|
| 25 |
|
| 26 |
|
| 27 |
|
| 28 |
|
| 29 |
|
| 30 |
|
| 31 |
|
| 32 |
|
| 33 |
|
| 34 |
|
| 35 |
|
| 36 |
|
| 37 |
|
| 38 |
|
| 39 |
|


