Crossover between electromagnetically induced transparency and Autler–Townes splitting with dispersion

Crossover between electromagnetically induced transparency and Autler–Townes splitting with dispersion |
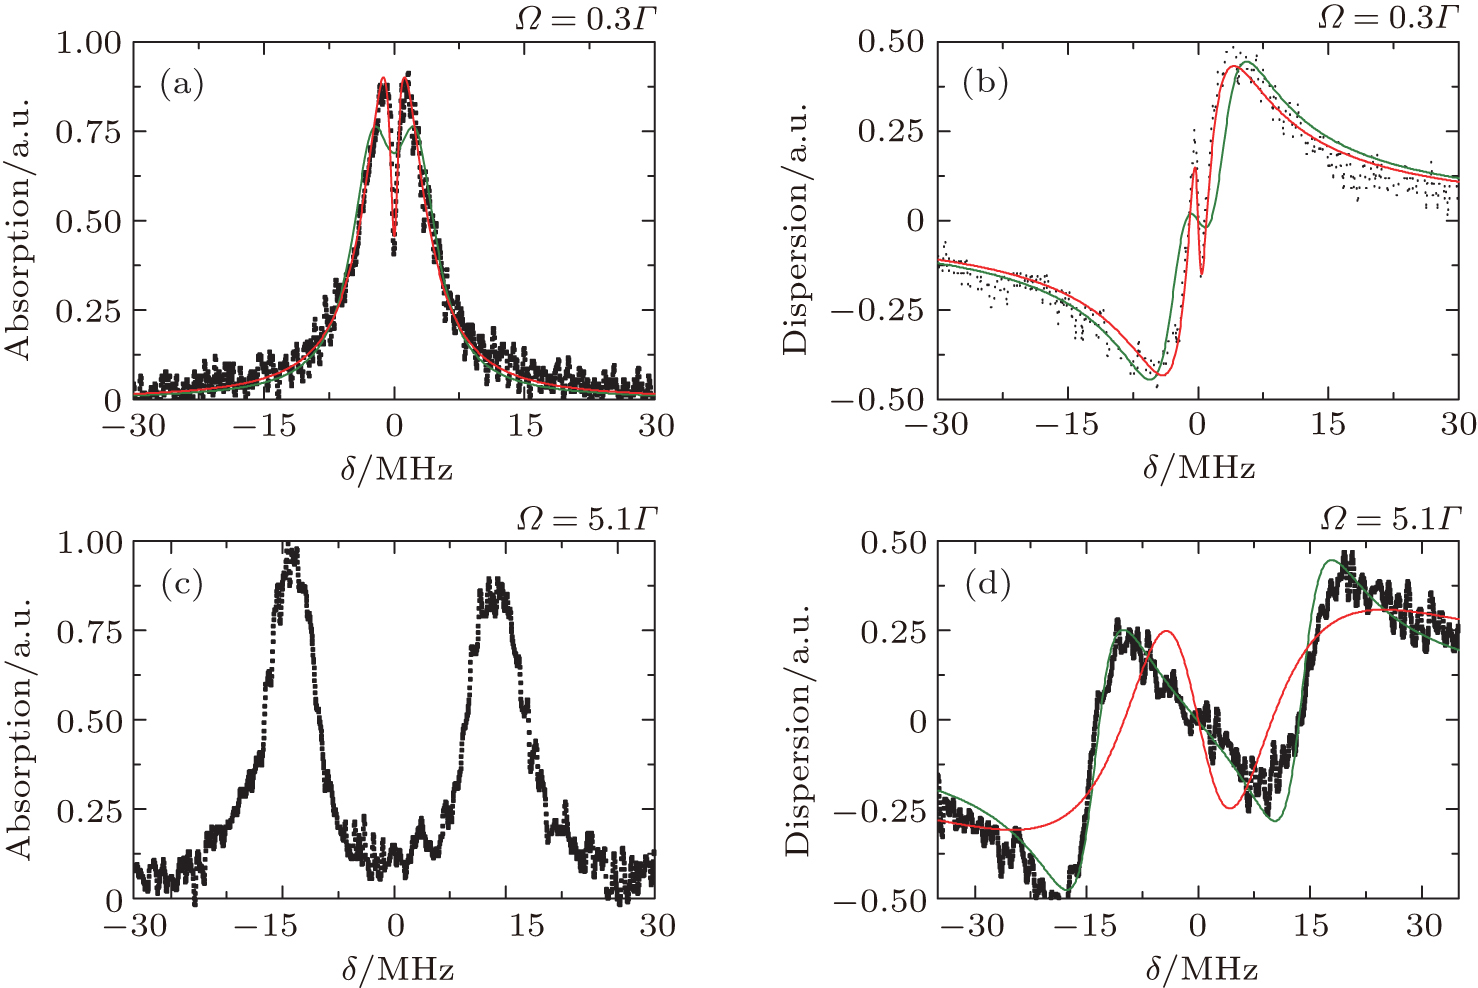
| Fitting of the absorption ((a), (c)) and dispersion ((b), (d)) models for two values of the coupling Rabi frequency Ω (0.3 Γ and 5.1 Γ ). Experimental data (black dots) are presented together with the best fitted results of functions A EIT and D EIT (red solid lines), and A ATS and D EIT (green solid lines). As A EIT is not well suited for fitting experimental data, we obtain results which are unreasonable in reality (red solid line in panel (c)). |
 |