Three-dimensional coherent diffraction imaging of Mie-scattering spheres by laser single-orientation measurement

Three-dimensional coherent diffraction imaging of Mie-scattering spheres by laser single-orientation measurement |
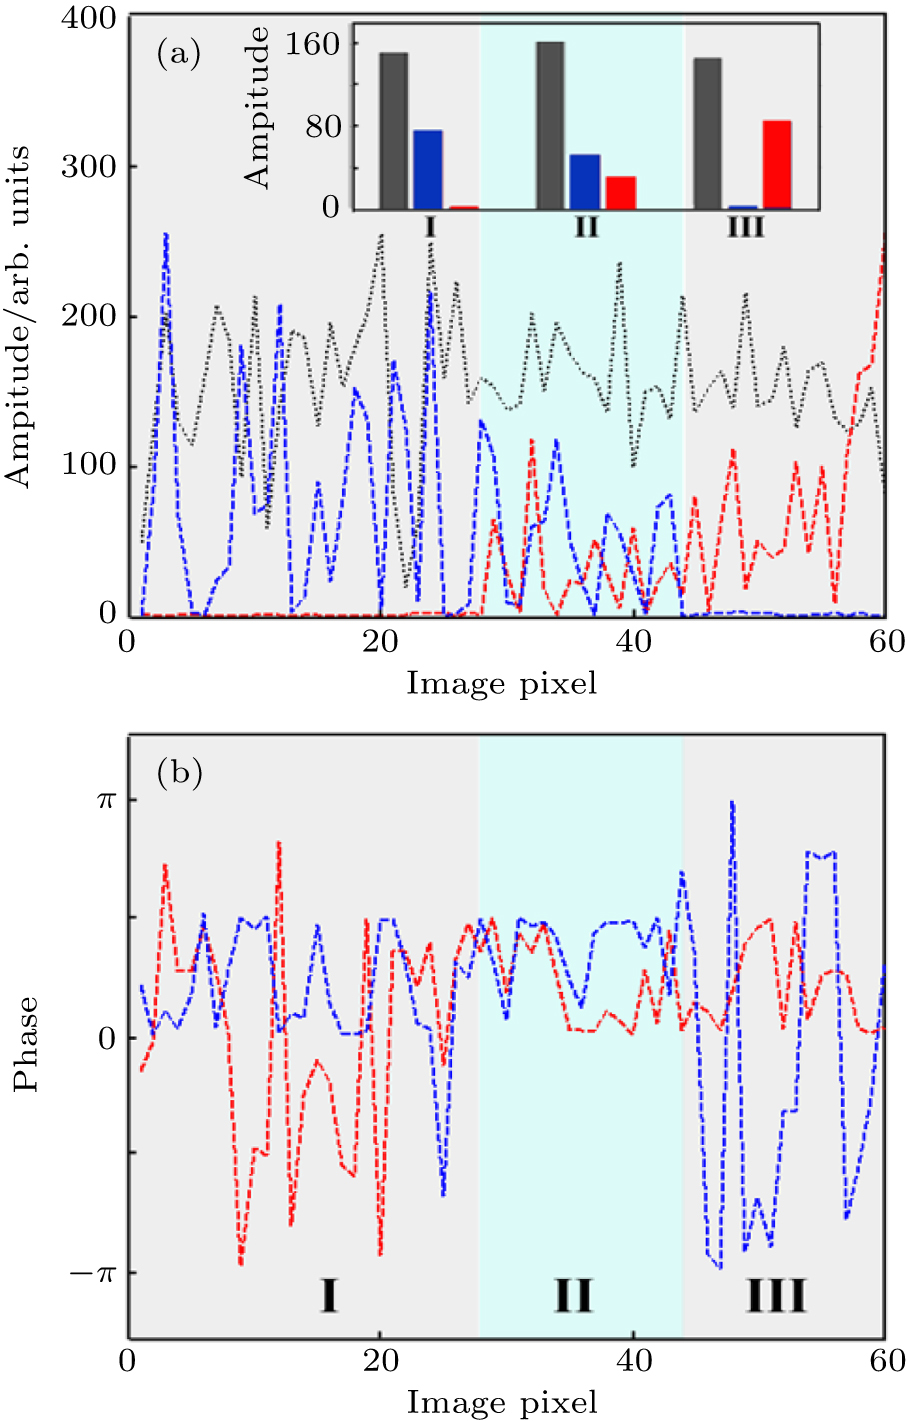
| (a) Line scans along the dashed lines across two overlapped spheres in Figs. 5(a) and 5(b) , and Fig. 4(b) . The inset shows average amplitudes of scan lines at different regions. Region II (cyan) represents overlapped area of the two spheres perpendicular to the beam direction. (b) Two line scans along the same dashed line in the 3D phase reconstruction, showing the phase variation across the overlapped spheres. |
 |