†Corresponding author. E-mail: zhaoyt@sxu.edu.cn
*Project supported by the National Basic Research Development Program of China (Grant No. 2012CB921603), the National High Technology Research and Development Program of China (Grant No. 2011AA010801), the National Natural Science Foundation of China (Grant Nos. 61275209, 11304189, 61378015, and 11434007), and Program for Changjiang Scholars and Innovative Research Team in Universities of China (Grant No. IRT13076).
We have employed recoil-induced resonance (RIR) with linewidth on the order of 10 kHz to demonstrate the fast thermometry for ultracold atoms. We theoretically calculate the absorption spectrum of RIR which agrees well with the experimental results. The temperature of the ultracold sample derived from the RIR spectrum is T = 84±4.5 μK, which is close to 85 μK that measured by the method of time-of-flight absorption imaging. To exhibit the fast measurement advantage in applying RIR to the ultracold atom thermometry, we study the dependence of ultracold sample temperature on the trapping beam frequency detuning. This method can be applied to determine the translational temperature of molecules in photoassociation dynamics.
The laser cooling and trapping atom technology via the magneto-optical trap (MOT) is a powerful tool to study ultracold atomic and molecular physics.[1, 2] These ultracold atoms or molecules, which have a low collision rate, long interaction time, and reduced Doppler broadening, are suitable for the precision metrology, [3] quantum information, [4] or quantum analog simulation of complex phenomena.[5] The spectroscopy study will provide the information such as, atomic cloud density, spatial distribution, velocity distribution, or temperature of the sample.[6] In these researches, the evolution of the temperature in the system is a very important and fundamental process. It is desirable to use a nondestructive method to explore this process.[7, 8] Typically, the sample temperature is measured by the methods of time-of-flight, [9] ballistic expansion, [10] electromagnetically induced transparency, [11] or photoionization signal.[12] However, these techniques share a problem that there is a change of the spatial distribution due to ballistic expansion of the sample.
Using a recoil-induced resonance (RIR) method to measure the velocity distribution of ultracold atoms has been proposed and treated in Ref. [13], where the RIR signals were first observed by Courtois.[14] This method provides a nondestructive velocity measurement in MOT or optical lattice trap, from which the corresponding temperature can be derived.[15] The measurements of velocity or temperature in three dimensions can be realized by employing an additional probe beam. Hence, the significance of the RIR goes beyond the interpretation of the pump-probe spectroscopy of the ultracold atomic sample.[16, 17] In addition, this technique can also be applied to the temperature measurement of molecules formed from alkali metal atoms, in which situation, the time-of-flight absorption imaging is not suitable.
In this paper, we study the RIR signals in a working MOT. The resonance structure with a linewidth on the order of 10 kHz was observed from a weak probe beam through a sample of laser cooled 133Cs atoms. The calculated RIR signals agree well with the experimental results. Then the dependence of the RIR spectrum width on the angle between the pump and probe beams was studied. Based on the RIR spectrum, the derived temperature of the ultracold sample is T = 84± 4.5 μ K, which is very close to the result of 85 μ K measured by time-of-flight absorption imaging. We show that the RIR spectrum is helpful for the fast thermometry of trapped atoms. Ultimately, we verified the fast measurement advantage of this technique in thermometry, through theoretically and experimentally investigating the changes of the temperature with the frequency detuning of trapping beam.
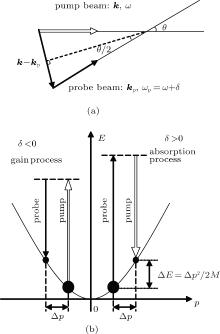
The RIR arises from the momentum changes between the interacting atoms and light fields.[18, 19] A simple description of the physical principle of RIR is as follows. A strong pump beam with wave vector k, frequency ω , and a weak probe beam with wave vector kp, frequency ω + δ crosses an atomic ensemble at a small angle θ , as shown in Fig. 1(a). Assuming the probe beam frequency detuning δ is sufficiently small, one can find that | kp| ≈ | k| = k. The changes of momentum contain two competing processes. When δ < 0, the atom absorbs the pump photon followed by stimulated emission into the probe photon, resulting in the probe gain and the atom momentum change Δ p = − ℏ kθ . On the other hand, when δ > 0, the atom absorbs the probe photon followed by stimulated emission into the pump photon, resulting in the probe absorption and the atom momentum change Δ p = ℏ kθ , which is shown in Fig. 1(b). The variation of the RIR signal amplitude is proportional to the population differences Π (p+ Δ p) − Π (p) of two momentum states.
For simplicity, we consider the model in Ref. [13], in which the momentum distribution is continuous. By integrating over all possible atomic momentum values, the RIR signal can be written as

where Ω and Ω p are the resonance Rabi frequencies for the pump and probe beam, respectively, Δ is the frequency detuning of pump beam from the resonance, γ is the typical population relaxation rate, and M is the atomic mass. It is reasonable to make the assumption that 


where ℏ is the reduced Planck constant, kB is the Boltzman constant, 

which is proportional to the angle θ . One can notice that the width of the signal is proportional to the mean velocity of the ultracold sample. Substituting 


Hence, the RIR signal can be used to investigate the velocity distribution and temperature of the ultracold atomic sample.
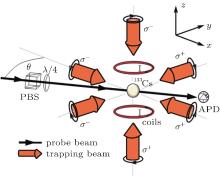
In the experiment, we employ a conventional MOT with a high vacuum backgound (about 1.6 × 10− 7 Pa). The trapping beams are used to trap the atoms and the repump beams are used to get the atoms back to cycle transitions for cold atoms. The pump beam and the probe beam are used to realize the RIR. The trapping beam comes from a single-frequency Ti:sapphire laser (coherent MBR110). The frequency detuning of trapping beam is fixed at Δ = − 3Γ (Γ denotes the natural linewidth) from the resonant transition 6S1/2(F = 4) → 6P3/2(F′ = 5) of Cs D2 line by an acousto-optic modulator (AOM). The repump beam is provided by a Littrow external cavity diode laser (DL100) and the corresponding frequency is stabilized at the resonant transition 6S1/2(F = 3) → 6P3/2(F′ = 4) of Cs D2 line. The trapping beam is divided into three pairs of mutually orthogonal laser beams with opposite σ + /− polarizations as shown in Fig. 2. The anti-Helmholtz configuration can generate a magnetic gradient of 15 G/cm. There are about 2 × 10⁷ atoms in the trap, and the temperature of the atom cloud is about 85 μ K measured by the time-of-flight absorption imaging. The probe beam also comes from the same Ti:sapphire laser, but with frequency tuned around the trapping beam frequency by another AOM. The probe beam is injected into the sample at a small angle θ = 2° with respect to a pair of trapping beams, which act as pump beams in the RIR phenomenon. The pump beam polarization is σ − (direction x), while the polarization of the probe beam is σ − , which is controlled by a λ /4 waveplate. Typically, the intensity of the pump beam is 25 mW/cm2 and the power of the probe beam is fixed at 12 μ W to minimize the perturbation on the atom cloud. An avalanche photodiode (APD) is used to directly detect the transmission of the probe beam.
The pump beam and probe beam are coherent because of the same origin from the Ti:sapphire laser. Thus, the transmission spectrum has a high resolution allowing us to distinguish the RIR signal with the width on the order of 10 kHz.
Guo et al. have given a simple model for the Raman transitions.[13] For quantitative description of the Raman transition spectrum, all the Raman transitions between light-shifted Zeeman magnetic sublevels should be considered. The amplitudes of these Raman transitions depend on the atomic sublevels and the Clebsch– Gordan coefficients associated with the corresponding transition paths. The relationship of the probe transmission spectrum with the pump-probe detuning δ is shown in Fig. 3. We can see that the shape of the spectrum contains two parts, the broad one is the Raman transitions between Zeeman magnetic sublevels of the Cs 6S1/2(F = 4) ground state, and the narrow one is the RIR signal. This RIR signal results from the interaction between the σ − polarized probe beam and the σ − polarized pump beam in the x direction with the interactional angle θ = 2° . The frequency detuning of the pump beam is Δ = − 3Γ . Based on Eq. (2) for describing RIR and the result of Raman transitions in Ref. [14], we present the theoretical curves (the red line) in Fig. 3, which agrees well with the experiment data. The RIR structure shows a dispersion-like shape at δ = 0 and the peak– peak width is 40 kHz (see the inset in Fig. 3).
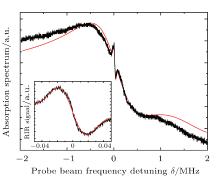 | Fig. 3. Absorption spectrum of probe beam. The inset shows the RIR signal. The red line is the theoretical curve. |
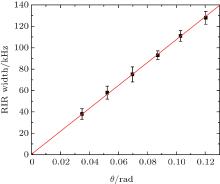
We use one pair of trapping beams as the pump beam to avoid transversely heating the atomic cloud.[20] Figure 4 shows the corresponding RIR linewidth as we change the angle θ from 2° to 7° (0.035– 0.122 rad). The parameters of pump beam and probe beam are the same as those in Fig. 2. The widths are observed to vary linearly with θ . When the angle θ is sufficiently small, the RIR width can be written as W = 2kθ 

In order to verify the advantage of RIR in thermometry, we make a fast measurement to sweep the trapping beam frequency detuning from Δ = − 3Γ with a range of ± 3 MHz. The experimental results are shown in Fig. 5, which denotes the relationship between the frequency detuning and the RIR width.
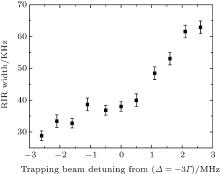 | Fig. 5. The RIR width as a function of the trapping beam frequency detuning. The angle θ = 2° . The intensity of the pump beam is 25 mw/cm2 and the power of the probe beam is fixed at 12 μ W. |
In Ref. [21], Dalibard and Cohen-Tannoudji have evaluated the equilibrium temperature in the σ + – σ − cooling mechanism from semiclasscal optical Bloch equations

Using Eq. (5), we calculate the theoretical curve (the red line in Fig. 6), which describes the relationship between the trapping beam frequency detuning and the equilibrium temperature of the ultracold sample. The theoretical curves are in good agreement with the experiment data. The main error comes from the movement of atom center when the trapping beam detuning is changed. In this case, the probe beam cannot pass the atom center accurately.
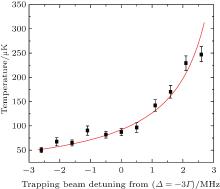 | Fig. 6. Temperature as a function of the trapping beam frequency detuning from Δ = − 3Γ . These data are calculated based on Fig. 5. The red lines are the theoretical curve. |
In conclusion, we have shown that the RIR can be used for nondestructive, on-line diagnostics of the atom temperature dynamics in a trapped MOT. The temperature obtained using this method agrees well with that measured by the time-of-flight absorption imaging technique. Compared with the time-of-flight absorption imaging, the advantage of RIR is more convenient and faster in ultracold thermometry. The relation between the temperature of the ultracold sample and the trapping beam frequency detuning is also studied in theory and experiment. It verifies the reliablility of the RIR in fast measurement of the ultracold sample temperature. Furthermore, this nondestructive method can also be used to monitor the temperature dependence of the molecule formation rate, the heating effect in an MOT and the dynamic process in atom– molecule sympathetic cooling.[22]
| 1 |
|
| 2 |
|
| 3 |
|
| 4 |
|
| 5 |
|
| 6 |
|
| 7 |
|
| 8 |
|
| 9 |
|
| 10 |
|
| 11 |
|
| 12 |
|
| 13 |
|
| 14 |
|
| 15 |
|
| 16 |
|
| 17 |
|
| 18 |
|
| 19 |
|
| 20 |
|
| 21 |
|
| 22 |
|


