1. IntroductionIn recent years, the nonaqueous rechargeable lithium-air or lithium– oxygen (Li– O2) battery has attracted extensive attention because of its ultra-high theoretical energy density (i.e., 3505 W· h· kg− 1 or 3436 W· h· l− 1, [1– 5] which is about 5– 10 times higher than that of state-of-the-art lithium-ion battery.[6– 15] Most conventional oxygen electrodes in nonaqueous Li– O2 batteries are made of coating carbon-based materials with or without catalysts on oxygen-permeable current collectors.[16– 21] In previous research, various kinds of carbon materials, such as Ketjan Black (KB), [22, 23] or Super P (SP), [24] Vulcan XC-72, [25] carbon nanotubes, [26, 27] and graphenes[28, 29] have been proven to be good cathode materials for nonaqueous Li– O2 batteries because they might produce large values of specific capacities during discharge, owing to their intrinsic ability to reduce oxygen, the availability of sufficient active sites for lithium– oxygen reactions, and the spaces for accommodating the insoluble solid products.[30] Carbon papers (CPs), which are composed of densely integrated carbon fibers, have often been used as current collectors since they may be used as light weight conductive supports as well as gas diffusion layers.[31– 35] However, few investigations[36] have been carried out on their contribution to discharge capacities.
Consequently, in this work we intentionally choose CPs (TGP-H-060, Toray) as current collectors with different carbon-based cathode materials (e.g. KB or SP). Stainless-steel (SS) mesh current collectors are also used for comparison. It is found that the CP used without cathode materials shows a negligible capacity during discharge. However, a considerable contribution to the discharge capacity by the CP is found when discharging cells with KB or SP-coated CP serving as the cathode. This is attributed to the synergetic effect between the large-surface carbon-based cathode materials and the low-surface CP current collectors. The latter is activated by the initial discharge of the former materials.
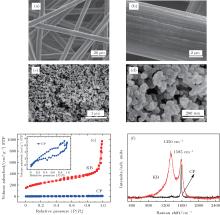
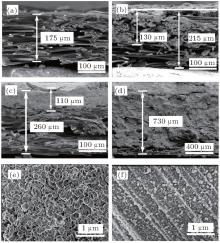
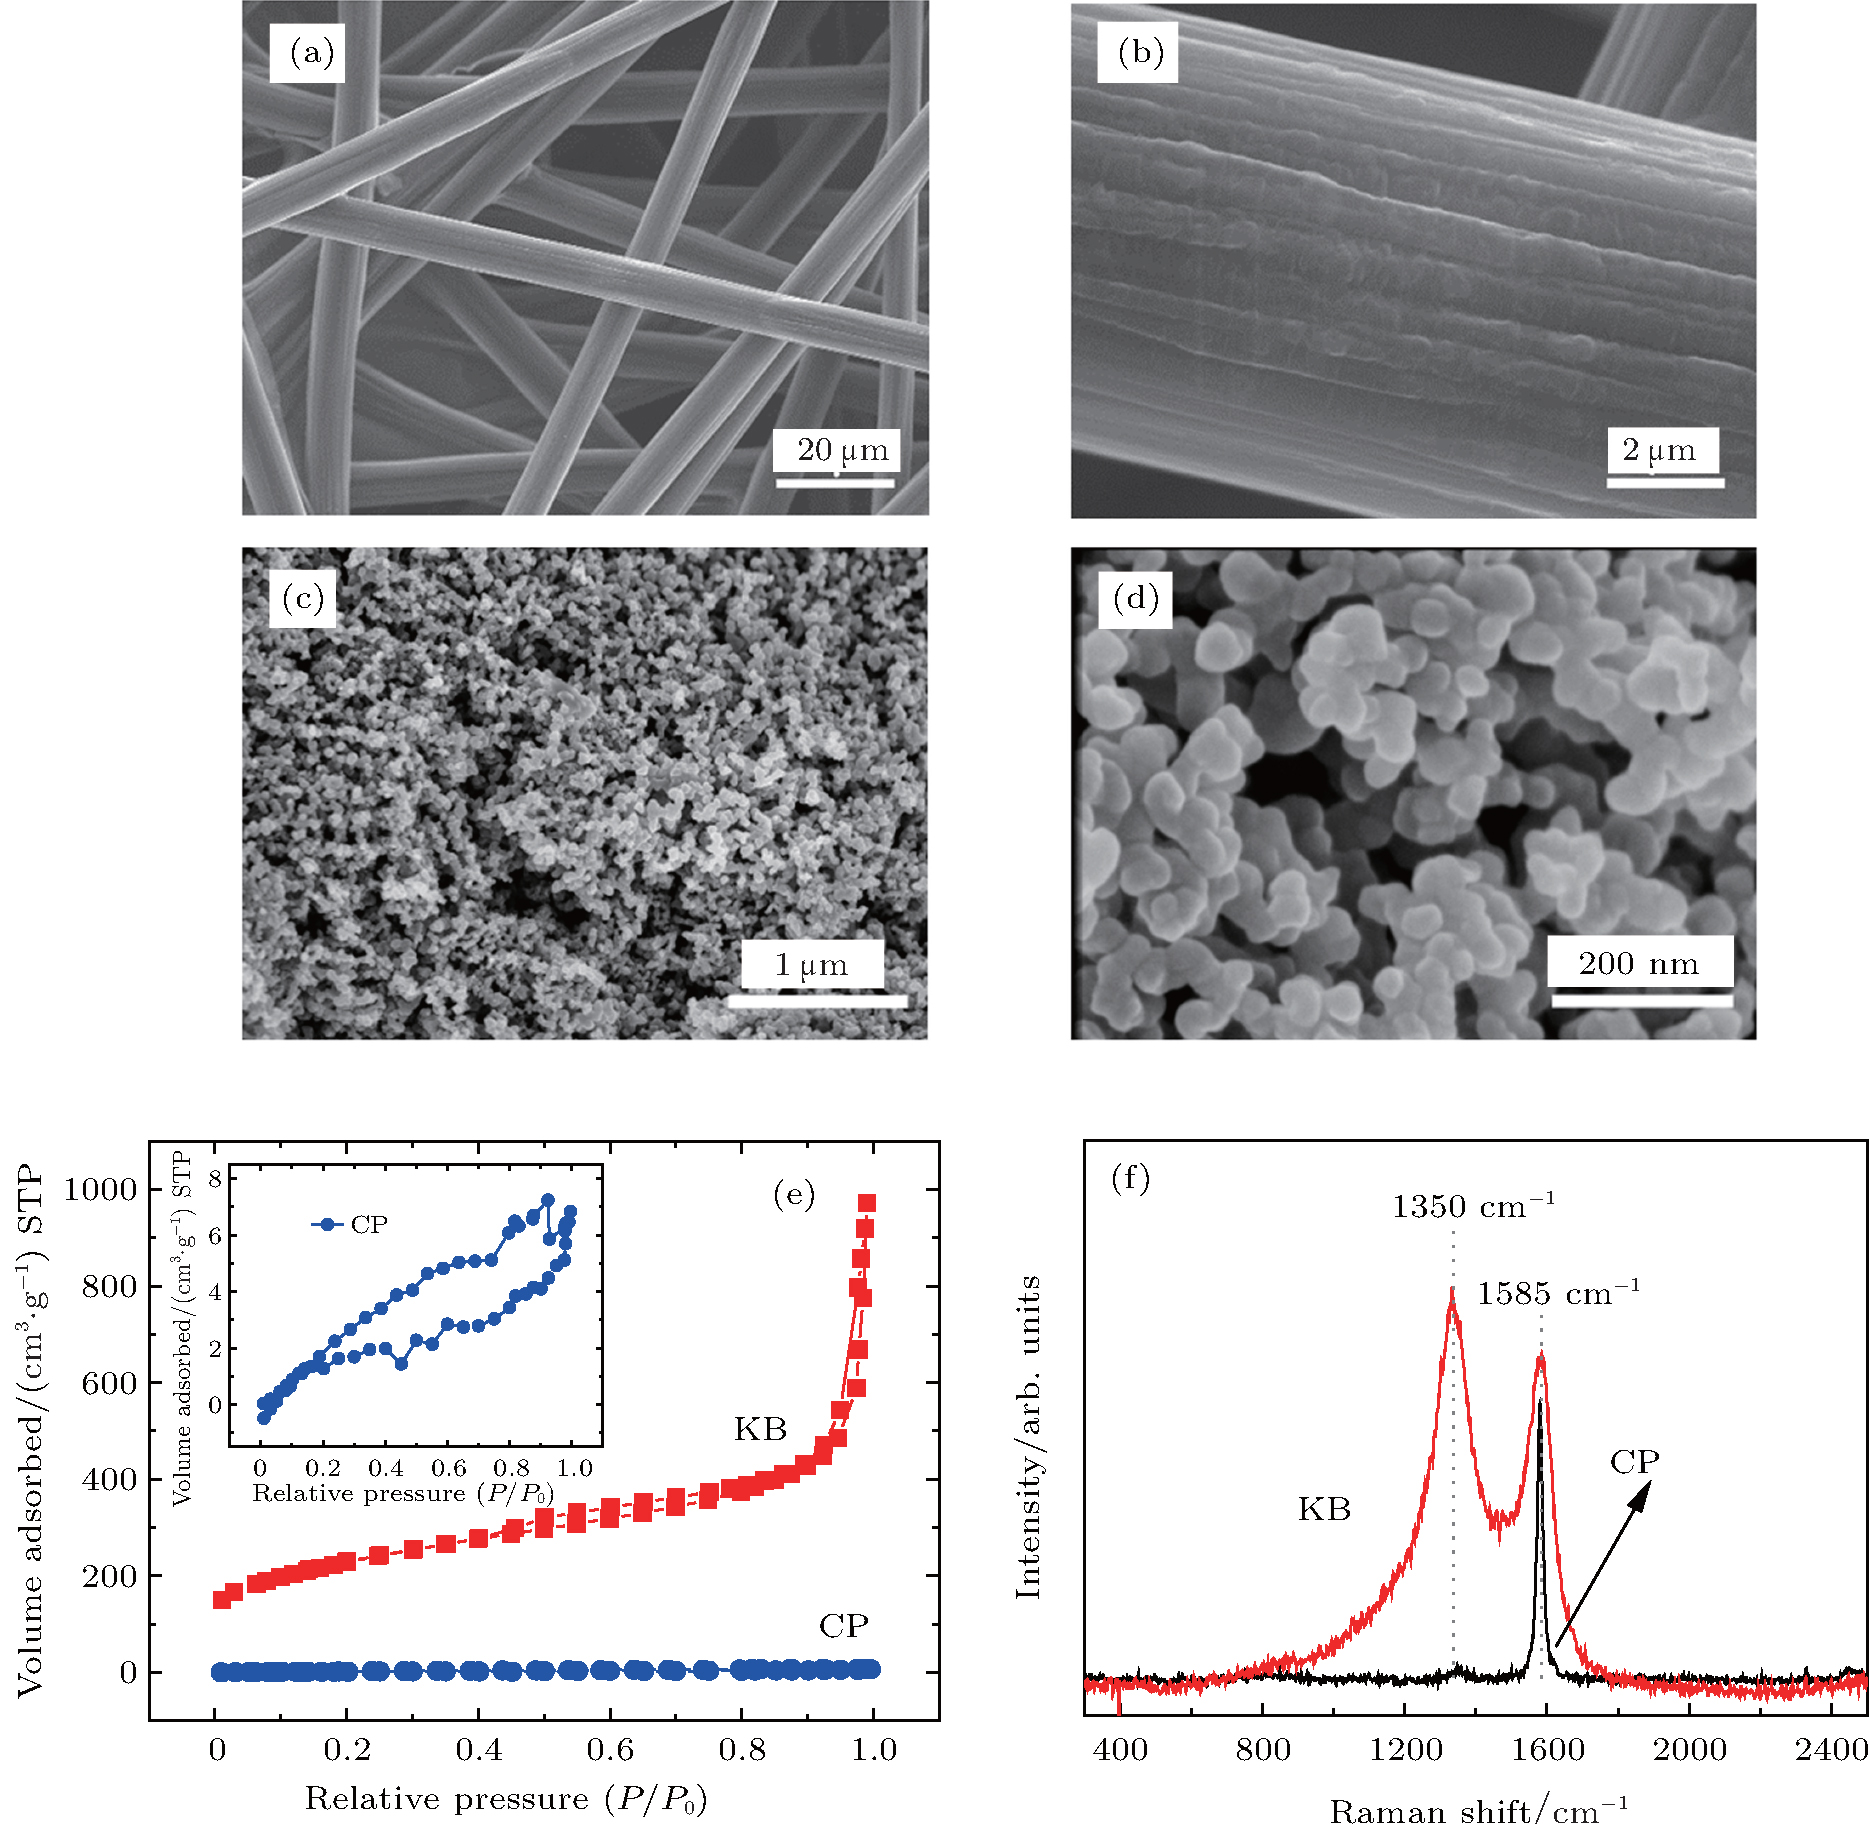
3. Results and discussionThe surface morphologies of the two different carbon materials have been investigated. As can be seen in Figs. 1(a)– 1(d), the CP consists of carbon fibers, each with a diameter of approximately 10 μ m and a smooth surface. However, the KB carbons are composed of spherical primary particles with sizes in a range of 20 nm– 50 nm. They are fused together to form high-structure primary agglomerates with sizes that range from 200 nm– 300 nm. Their shapes and porosities are dependent on the preparation process. The specific surface area of KB is approximately 10 times larger than that of CP as shown in Fig. 1(e). The Raman spectra of pristine KB and CP are displayed in Fig. 1(f). The G band at 1585 cm− 1 is observed in both carbon materials. The intensity of the D band at 1350 cm− 1 of KB is much greater than that of the corresponding G band. However, the D band of CP is nearly invisible. Since the D band is related to the presence of defects, this implies that the KB has more surface defects than the CP. In previous studies, [25, 37] the surface defects of carbon cathodes are thought to have had an effect on the discharge performance of a Li– O2 battery. From the above results, it is reasonable to infer that the two different carbons may have different discharge performances.
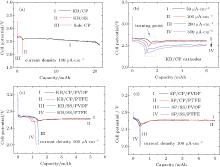
Figure 2(a) shows the discharge profiles of the Li– O2 cells with sole CP, KB/SS, and KB/CP cathodes. It is clear that the sole CP current collector produces a negligible discharge capacity, which is consistent with previous reports.[22, 24] In contrast, the cell with the KB/CP shows a much larger discharge capacity of approximately 23 mAh, which is also approximately a factor of 15 greater than that of 1.5 mAh for the cell with the KB/SS. This result clearly indicates that a KB/CP cathode produces a much greater capacity than a cathode of CP or KB alone. More interestingly, a turning point can be clearly seen in the discharge curve of the KB/CP cell. The capacity value (i.e., 1.5 mAh) at the turning point exactly corresponds with that produced by the sole KB in the KB/SS cell. This implies that in the KB/CP cell the initial capacity contribution from the KB layer leads to an additional large capacity, which should be closely related to the CP current collectors.
To check whether the above phenomenon is dependent on the current density or the used carbon material, the KB/CP cells are tested at a current density ranging from 50 μ A· cm− 2 to 300 μ A· cm− 2, the results of which are shown in Fig. 2(b). Different binders (i.e., PVDF and PTFE) and different carbon-based materials (i.e., KB and SP) are also used to construct the air cathodes, the discharge behaviors of which are shown in Figs. 2(c) and 2(d). As can be seen from the above figures, the turning points exist at different current densities, with the corresponding capacity value decreasing with the increasing current density. Similar turning points and an increasing discharge capacity can also be observed if KB:PVDF/CP, KB:PTFE/CP, SP:PVDF/CP, or SP:PTFE/CP are used to construct the cathodes. These results indicate that the underneath CPs are most likely to be activated by the Li2O2 or  intermediate arising from the discharge of the upper-coated cathode materials, such as KB or SP.
To gain an insight into what occurs to the KB/CP cathodes during discharge, compositional and morphological changes are investigated. Figure 3(a) shows SEM images for the cross section of a typical pristine CP. It can be seen that the pristine CP has an apparent thickness of approximate 175 μ m, consisting of porous layer-stacked carbon fibers. The coated KB layer on the CP current collector is estimated to be 130 μ m in thickness and seems to consist of two parts. One is flatly distributed on the top of CP and the other permeates into the voids, as shown in Fig. 3(b). After the KB/CP cathode discharges to 5 mAh (Fig. 3(c)), the top layer obviously becomes thicker and denser, which is approximately 110 μ m. In this process, the total thickness of the cathode increases to ∼ 260 μ m. This increase in thickness can be attributed to the expansion of the top layer as a result of the deposited discharge products. After further discharging to 23 mAh (Fig. 3(d)), the
cathode is full of discharge product. The CP layer is difficult to distinguish. Meanwhile, the total thickness of the cathode becomes ∼ 730 μ m, which is a factor of 3.5 greater than that of the pristine one as shown in Fig. 3(a). According to Faraday’ s constant (96485 C· mol− 1, we can calculate that the number of transferred electrons for 23 mAh (82.80 C) discharge capacity is 8.58× 10− 4 mol. As the discharge reaction (2Li + O2 → Li2 O2) of Li– O2 cell experiences two electric processes, the discharge product Li2O2 is 4.29× 10− 4 mol. With the density (1.21 g· cm− 3) and Molar mass (45.88 g· mol− 1 of Li2O2, the volume of Li2O2 can be calculated, which is approximately 1.63× 10− 2 cm− 3. On the other hand, we can estimate the volume of the cathode expansion from the cross-section SEM images in Figs. 3(b) and 3(d). We can clearly see that the thickness values for the pristine cathode and after discharging to 23 mAh are 215 μ m and 730 μ m, respectively, in Figs. 3(b) and 3(d). The average geometric area of the cathode is 0.50 cm2. Therefore, the expansion of the volume is approximately 2.58× 10− 2 cm− 3, which is consistent with the previous calculated value (i.e., 1.63× 10− 2 cm− 3). The above results clearly show that the Li2O2 formation is initiated first on the large-surface carbons (the top layer, i.e., KB or SP) and then moves on to the low-surface carbon, (i.e., CP). Furthermore, volume expansion of electrode during Li2O2 deposition is identified, which should be taken into account for practical design and realization of Li– O2 cells.
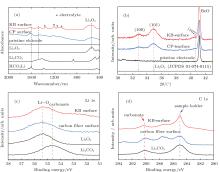
The morphologies of discharge products on the KB surface and the surface of CP side are shown in Figs. 3(e) and 3(f), respectively. Toroid-shaped particles can be observed in both cases, meanwhile the former has particles with a greater size than the latter. For the discharge products formed on both sides of the cathodes, composition analyses on both sides are carried out by FTIR, XRD, and XPS respectively. The results are shown in Fig. 4. From the figures, it can be seen that the signal difference between the two sides is negligible. The broadened peaks at 542 cm− 1 in FTIR (Fig. 4(a)) clearly indicate that Li2O2 is the dominant discharge product. The traces of carbonate species (e.g., HCO2Li and Li2CO3 can be identified. Other peaks at 1064, 1138, 1202, and 1340 cm− 1 are attributed to the used electrolyte (i.e., TEGDME:LiTFSI).[38] The peaks corresponding to the Li2O2 crystalline peaks can also be observed by the XRD scans as displayed in Fig. 4(b). The surface-sensitive XPS, on the one hand, confirms that Li2O2 is the dominant discharge product (a broad Li– O bond at 55.4 eV as shown in Fig. 4(c)). On the other hand, it indicates that Li2CO3 is formed during discharge (a broad Li2CO3 peak at approximately 290 eV as shown in Fig. 4(d)). These carbonates formed during discharge are attributed to the decomposition of the used TEGDME electrolyte and/or oxidization of the carbon-based cathode.[39, 40]
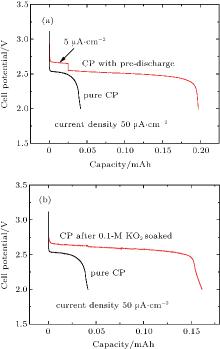
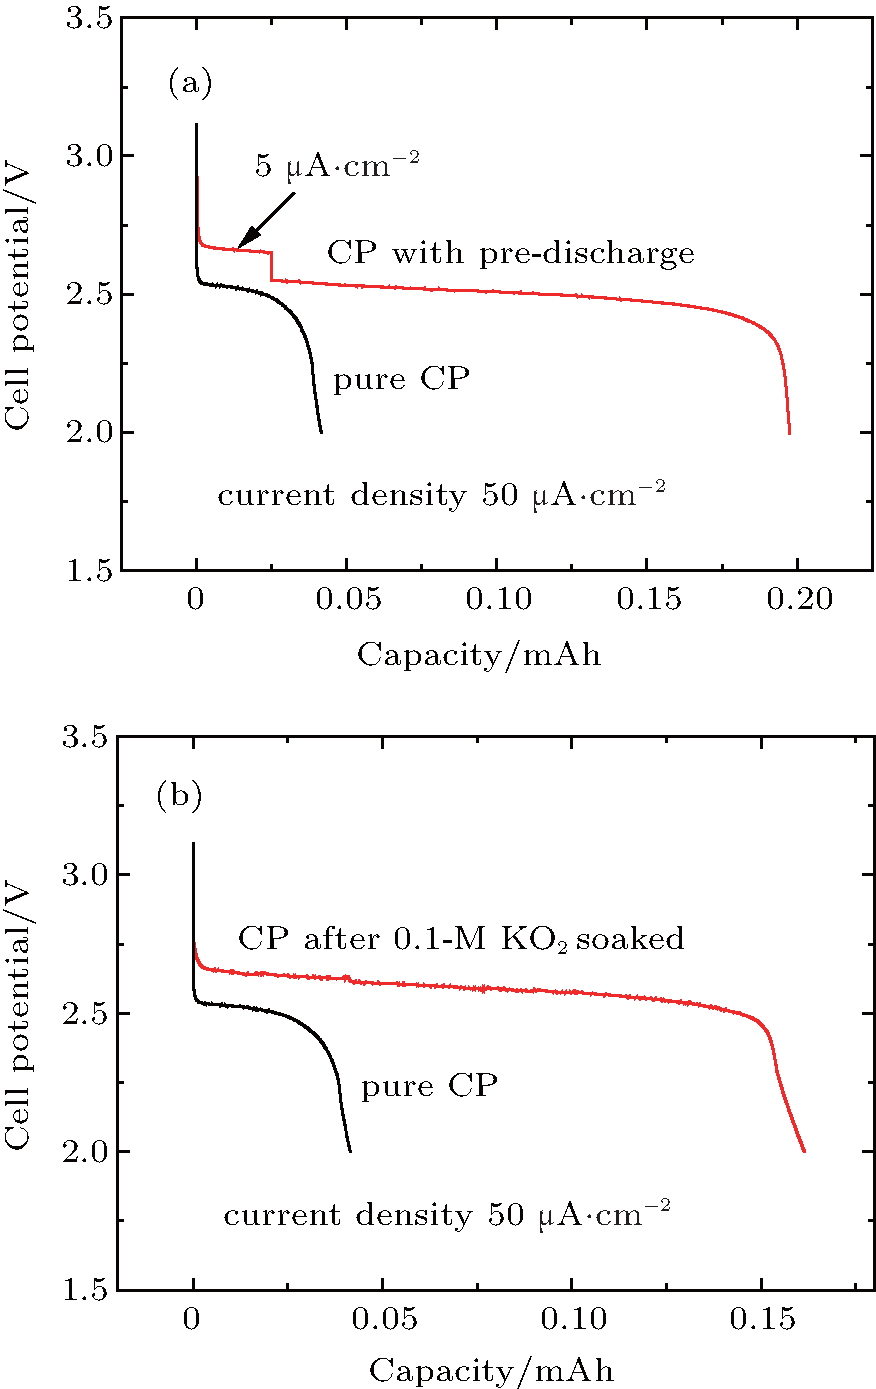
Therefore, the above analysis clearly indicates that the crystalline Li2O2 is formed on both carbon-based cathodes and CP current collectors, although the formed particles seem not to be completely the same in size and morphology. According to the fact that the cathodes of the KB/CP or SP/CP produce much greater capacities than the individuals (as shown in Fig. 2), it is reasonable to assume that these large capacities result from a synergetic effect between the carbon-based cathode materials and the CP current collectors. Furthermore, according to the fact that the discharge capacity contributed from sole CPs is negligible, it should be activated by the effect of the carbon-based cathode, such as KB or SP. It is well known that the KB or SP is a good large-surface material for promoting the reaction of 2Li+ + O2 + 2e− → Li2O2, leading to a large amount of Li2O2 deposited on the material surfaces as well as  intermediates dissolved in the solvent. The formed Li2O2 at the KB/CP or SP/CP interface may function as pre-deposited nuclei for the CPs, which promotes the further growth of Li2O2 on them. As shown in Fig. 5(a), the cell with a pre-deposition of Li2O2 on the CP at a small current density (i.e., 5 μ A· cm− 2) leads to a much larger discharge capacity (i.e. 0.2 mAh) at 50 μ A· cm− 2, which is approximately four times greater than the va
without the pre-deposition (as can be seen in Fig. 5(a)). This pre-deposition influence is also observed in the Na– O2 batteries that were recently reported.[41] Moreover, it is known that the superoxide radicals are produced in the initial discharge process of Li– O2 cells and dissolved in the liquid electrolyte, which have strong oxidability and may activate the CP surfaces to promote the growth of Li2O2 on it. This is indeed observed in the experiment. The KO2 dissolved in the TEGDME solvent can produce superoxide radicals. In order to simulate the circumstance of electrolyte with superoxide radicals in discharge process, the CPs were soaked in 0.1-M KO2/TEGDME solvent for 48 h. After being washed and dried, the treated CPs are used as cathodes to assemble the cells. As can be seen in Fig. 5(b), the discharge capacity (0.16 mAh) of the treated CPs is approximately three times larger than that (0.05 mAh) of the pristine CPs, clearly indicating the promotion effect on growth of Li2O2 on the CP by the in the solvent. Consequently, these two factors cause the CPs to produce considerable discharge capacities.
The turning points as shown in Fig. 2 can be explained by the fact that the Li2O2 preferentially grows at the large-surface carbon material (e.g. KB or SP) during the initiate discharge. After the carbon materials all form Li2O2 compounds and their active sites are used up, the growth of Li2O2 on the low-surface carbon fibers becomes dominant, as shown in Fig. 3. Since the sizes and morphologies of the formed Li2O2 particles are not completely the same for carbon-based cathode materials and carbon fibers, different discharge plateaus lead to the turning points, as observed in the discharge curves. As indicated in the discussion on the properties of KB and CPs, these results are probably caused by the fact that the surface morphologies and chemical defects are different in the two types of carbon materials.
The reason why CP current collectors can be activated to contribute a large discharge capacity lies in two key points: the first is that the synergetic effect between the large-surface carbon material and the low-surface carbon– paper current collector could be used to enhance the discharge capacity of the Li– O2 battery; and, the second is that the discharge capacities of the investigated cathode materials could be overestimated if the mass of CP is excluded. For instance, a discharge capacity of an Li– O2 cell based on the sole weight of KB would be as large as  Whereas, the value is only
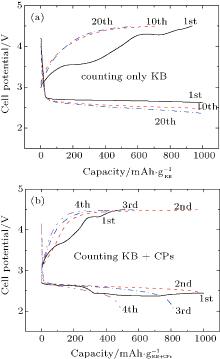
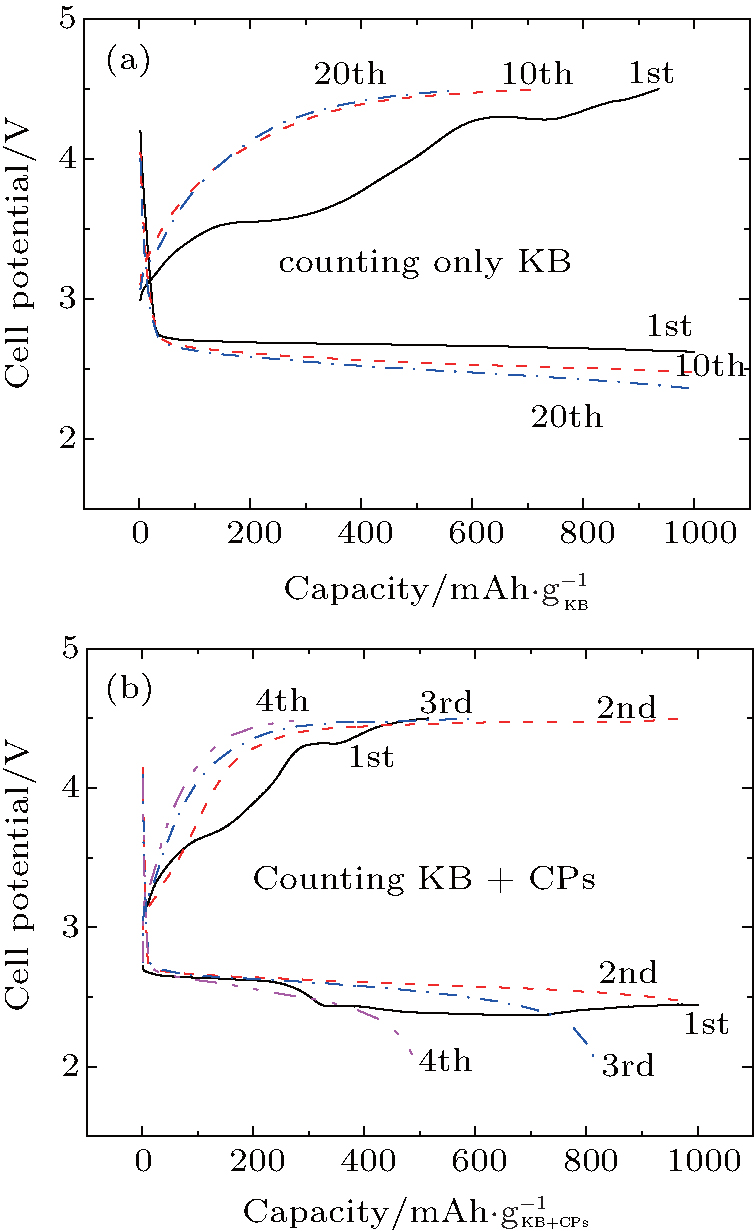
  if both weights of the KB and CPs are included. This overstated capacity may also be misleading in the case of cycling with limited depth of discharge (DOD). As can be seen in Fig. 6, if the limited discharge capacity of 1000 mAh· g− 1 is only for the weight of KB, then the cells can be cycled
at least 20 times without capacity degradation. However, if 1000 mAh·
g− 1 is for both weights of KB and CPs, then the cells can only be cycled a few times in terms of maintaining initial capacity. This lies in the fact that the former DOD is only 5% while the latter is 50% of the overall discharge capacity. A smaller DOD obviously leads to an extended cycle number. This result means that we should be careful calculating discharge capacities when CPs are used as current collectors.


 ]
]