


Extended x-ray absorption fine structure study of MnFeP0.56Si0.44 compound
[Li Ying-Jiea) , Haschaolu Wa) , Wurentuya a) , Song Zhi-Qianga) , Ou Zhi-Qianga) , Tegus O†b)  , Nakai Ikuo
b) ]
, Nakai Ikuo|
|

 , Nakai Ikuo
†Corresponding author. E-mail: tegusph@imnu.edu.cn
*Project supported by the National Natural Science Foundation of China (Grant Nos. 51461035, 51161017, and 11404176), the Scientific Research Projects of the Higher Educational Department of Inner Mongolian Autonomous Region (Grant No. NJZZ14033). The XAFS measurement was performed under the approval of Photon Factory Program Advisory Committee (Proposal Nos. 2012G095 and 2014G047).
The MnFeP0.56Si0.44 compound is investigated by x-ray diffraction, magnetic measurements, and x-ray absorption fine structure spectroscopy. It crystallizes in Fe2P-type structure with the lattice parameters a = b = 5.9823(0) Å and c = 3.4551(1) Å and undergoes a first-order phase transition at the Curie temperature of 255 K. The Fe K edge and Mn K edge x-ray absorption fine structure spectra show that Mn atoms mainly reside at 3g sites, while 3f sites are occupied by Fe atoms. The distances between the absorbing Fe atom and the first and second nearest neighbor Fe atoms in a 3f-layer shift from 2.65 Å and 4.01 Å in the ferromagnetic state to 2.61 Å and 3.96 Å in the paramagnetic phase. On the other hand, the distance between the 3g-layer and 3f-layer changes a little as 2.66 Å–2.73 Å below the Curie temperature and 2.68 Å–2.75 Å above it.
Magnetic refrigeration based on the magnetocaloric effect has attracted much attention as an energy saving and environmentally friendly alternative to conventional gas-compression refrigeration.[1, 2] In 1997, Pecharsky et al.[3, 4] discovered a giant magnetocaloric effect in Gd5Si2Ge2 in the vicinity of the first-order phase transition. A lot of magnetocaloric materials with the first-order phase transition have since been reported such as MnAs-based alloys, [5] MnFePxAs1 − x, [2] and Mn1.1Fe0.9PxGe1 − x[6] compounds. Recently an Fe2P-type Fe2 − xMnx(P, Si) compound has been intensively investigated as a promising candidate for room-temperature magnetic refrigeration.[7] The first-order phase transition usually relates to a structural deformation. In an Fe2P-type compound, the lattice parameters a and c undergo a discontinuous change, while the volume hardly changes, either below or above the transition temperature.[8]
Zhang et al. showed that Mn and Fe atoms preferentially occupy the 3g and 3f sites in FeMnP0.6Si0.4, while P and Si are randomly distributed at the 1b and 2c sites.[9] Hö glin et al. suggested that the Fe atoms are mainly situated in the 3g site, while the Mn atoms prefer the 3f position in FeMnP0.5Si0.5.[10] Their results conflict. To settle the controversy, we undertook an extended x-ray absorption fine structure (EXAFS) study of FeMn(P, Si). EXAFS is a powerful tool to probe the local atomic arrangements around a specific atom, such as coordination number and interatomic distance. In a previous study, we measured near Fe K edge EXAFS and reported on the local structure around Fe atoms for an Mn-rich Mn1.28Fe0.67P0.46Si0.54 compound.[11] Although it was only for the Fe K edge EXFAS, we found that the Mn atoms are located mainly at the 3g sites and that the 3f sites are occupied by Fe atoms and Mn atoms randomly. To get more understanding of the local structure of FeMn(P, Si), we carried out an EXAFS study on an MnFeP0.56Si0.44 compound. In the present work, we report on the local structure around both Fe and Mn atoms for MnFeP0.56Si0.44 and the interplay between the microscopic structure and the magnetic phase transition.
A polycrystalline ingot of MnFeP0.56Si0.44 was synthesized by high-energy ball milling and a solid-state reaction. The proper amounts of Mn (99.9%), Si (99.99%), Fe (99.5%), and red-P (99.999%) were mixed and ball-milled for 72 hours in a vacuum. The fine powder was then pressed into a small pellet and sealed in a quartz ampoule in an Ar atmosphere of 200 mbar (1 bar = 105 Pa). It was sintered at 1150 ° C for 2 hours, annealed at 850 ° C for 20 hours and then cooled down to room temperature. The x-ray diffraction was measured using Cu Kα radiation in a conventional θ – 2θ scan mode. Magnetic measurements were carried out in a vibrating sample magnetometer (Lakeshore 7407 VSM) between 150 K and 300 K and in magnetic fields up to 0.5 T. The EXAFS measurements near Fe and Mn K edges were performed using synchrotron radiation at the beamline BL12C of Photon Factory.[12] The storage ring was operated in the top-up mode at 2.5 GeV with a beam current of about 450 mA. The Si (111) double crystal monochromator was installed in the optics system. All the spectra were measured at 25 K, 100 K, 200 K, and 295 K in the transmission mode with the intensities of incident and transmitted x-ray beams measured using the ionization chambers filled with pure N2 gas in front of the sample and a mixed gas of 85% N2 and 15% Ar behind the sample. The incident energy of photons was calibrated with the energy value for a peak near the Cu K edge. The sample was powdered and uniformly spread onto scotch tape. For EXAFS measurements we piled up several layers of tape to obtain an appropriate absorption. The full spectrum at the Mn and Fe K edges was accumulated at intervals of 0.3 eV near the edges and at 2.5-eV intervals in the EXAFS range.
Figure 1 shows the x-ray diffraction pattern of MnFeP0.56Si0.44 at room temperature, which shows that the MnFeP0.56Si0.44 compound crystallizes in a single phase of the hexagonal structure with 
 | Fig. 1. X-ray powder diffraction patterns of MnFeP0.56Si0.44 taken at 295 K. The typical indices of the reflections are labeled. |
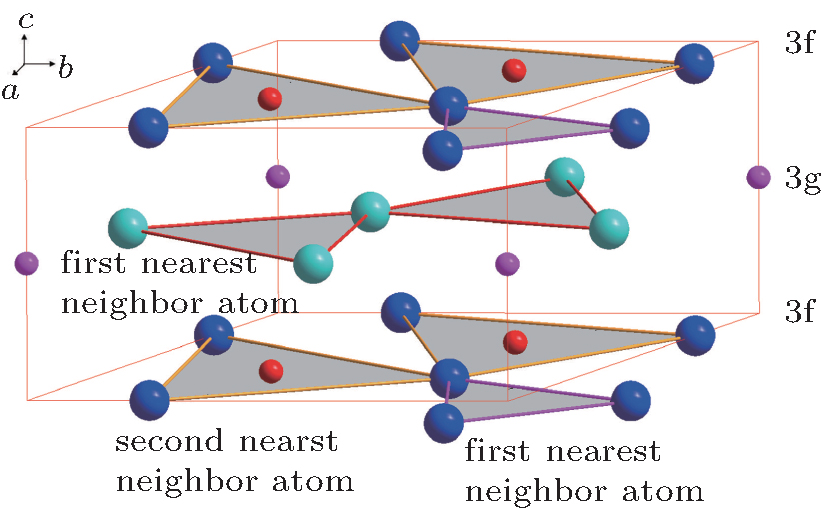 | Fig. 2. Local atomic configuration of MnFeP0.56Si0.44 around the 3g site and the 3f site denoted by large spheres (Fe/Mn) and small ones (P/Si). The triangles composed of the 3g sites and the 3f sites are stacked alternately along the c-plane. |
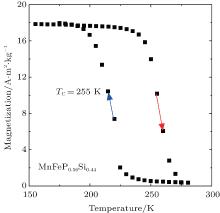
Figure 3 shows the temperature dependence of the magnetization of MnFeP0.56Si0.44, measured in a magnetic field of 0.05 T, with increasing temperature followed by decreasing temperature. The thermal hysteresis between the warming and cooling curves indicates that the magnetic transition between the paramagnetic and ferromagnetic phases is of the first order. The Curie temperature (in the warming process) is 255 K, which is determined by the temperature, where the first derivative of the magnetization on temperature, shows its extreme value.
 | Fig. 3. Temperature dependence of the magnetization of MnFeP0.56Si0.44, measured in a field of 0.05 T with increasing temperature and decreasing temperature, where TC is the phase transition temperature in the warming process. |
The total x-ray absorption μ ob(E) as a function of incident photon energy E is given as

where I0 and I are incident and transmitted intensities of photons, respectively.
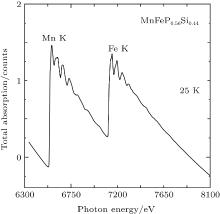
Figure 4 represents μ ob(E) for MnFeP0.56Si0.44 at 25 K. Two x-ray absorption edges appear: one represents the Mn K absorption at 6539 eV; the other is the Fe K absorption at 7113 eV. There is a rather small energy separation between the Mn K edge and the following Fe K edge; that is, the range of the Mn K EXAFS is restricted between 6600 eV and 7100 eV. Here we will concentrate our discussion on EXAFS at the both Mn K and Fe K edge at 25 K, 100 K, 200 K, and 295 K. In order to obtain the EXAFS oscillation, a Victoreen’ s polynomial (CE3 + DE4 + const) was used to subtract the background signal. The background subtracted spectra are normalized at the energy of the absorption edge. We presume the absorption of an isolated Mn/Fe atom by using spline smoothing method. The EXAFS oscillation can be extracted from the absorption in this manner.
 | Fig. 4. The total x-ray absorption of MnFeP0.56Si0.44 against photon energy at 25 K. |
In Fig. 5, the weighted EXAFS oscillation k3χ (k) of the Mn K edge for MnFeP0.56Si0.44 at 25 K is drawn as a function of the wave vector of photoelectron k. Fourier transformation of k3χ (k) in the k space gives a radial structure function Φ (R) in the R space

where the interatomic distance R is the variable complementary to the wave vector k, W(k) is the Hanning window function. We transform k3χ (k) between 3.75 Å − 1 and 11.95 Å − 1 into Φ (R) for Mn K edge.
 | Fig. 5. EXAFS spectrum k3χ (k) as a function of wave vector k for the Mn K edge at 25 K for MnFeP0.56Si0.44. |
The radial structure function Φ (R) is displayed in Fig. 6 for MnFeP0.56Si0.44 at 25 K, 100 K, 200 K, and 295 K. It should be noted that the distance in Φ (R) is shorter than the real one due to the phase shift. The peak at 2.27 Å corresponds to the first neighboring Mn– Fe pair along the c axis. On the other hand, the peak at 2.94 Å gives the second neighbor Mn– Mn distance in the c-plane. It can be seen that the peak position at 2.27 Å is almost independent of temperature. The peak at 2.94 Å is also independent of temperature 25 K to 200 K, while it disappears suddenly at 295 K. We suppose that its sudden change is related to the first-order magnetic transition at TC. To determine the structural parameters, we convert Φ (R) into k3χ (k) with the Fourier filtering technique; then, we fit the Fourier filtering k3χ (k) spectrum to the following formula using the least-squares method,

with the amplitude

Here, Ni is the coordination number, fi(k, π ) is the backscattering amplitude, σ i is the Debye– Waller factor, Ri is the interatomic distance between the absorbing and the i-th neighboring atom, δ i is the phase shift and λ is the mean free path of the photoelectron. We use the standard FEFF84 code[13, 14] in EXAFS analysis to calculate the parameters such as fi(k, π ) and δ i based on the crystallographic parameters of Fe2P-type structure. To reduce the number of disposable parameters in the fitting process, we set the restriction that the energy correction Δ E and the Debye– Waller factor have the same value for each shell.
 | Fig. 6. The radial structure function of MnFeP0.56Si0.44 for the Mn K edge at 25 K, 100 K, 200 K, and 295 K. |
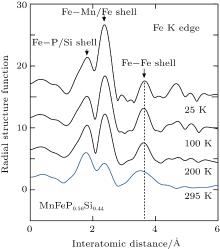
Figure 7 shows the radial structure function of MnFeP0.56Si0.44 for Fe K edge at 25 K, 100 K, 200 K, and 295 K. The peak at shell (Fe– P/Si) of 1.77 Å indicates the P or Si atom in the neighborhood of Fe atom. The peak at 2.40 Å gives Fe– Mn and Fe– Fe pairs along the c axis and c-plane. On the other hand, the peak at 3.7 Å shows the second nearest neighbor atoms (Fe) around the Fe atom in c-plane. The peak positions at 1.77 Å and 2.40 Å are almost independent of temperature because the parameters a and c change with temperature in opposite sense.[10] The peak at 3.7 Å is also almost independent of temperature below 200 K, while it decreases at 295 K. As an example of analysis, figure 8 illustrates the Fourier-filtered spectrum of MnFeP0.56Si0.44 using the R range between 1.78 Å and 3.56 Å at the Mn K edge by open circles. The solid line shows the best fit of Eq. (2) to the spectrum, which is in good agreement with the spectrum.
 | Fig. 7. The radial structure function of MnFeP0.56Si0.44 for the Fe K edge at 25 K, 100 K, 200 K, and 295 K. |
 | Fig. 8. Fourier filtered spectrum k3χ (k) (open circle) plotted against wave vector k for MnFeP0.56Si0.44 at the Mn K edge. The solid line denotes the best fit. |
According to the crystal symmetry of Fe2P structure with the lattice parameters a = b = 5.9823(0) Å and c = 3.4551(1) Å , the Fe atom has four second nearest neighbors at 3.9632 Å if it is in the 3f site; it also has four second nearest neighbors at 3.1522 Å if it is in the 3g position. In Table 1 and Table 2 we tabulate the parameters of the local structure around the Mn and Fe atoms determined from the Mn K and Fe K edge EXAFS spectra of MnFeP0.56Si0.44 at 25 K, 100 K, 200 K, and 295 K. Our XAFS analysis shows that the Fe atom has Fe neighbors at a distance of about 4.01 Å , which corresponds to the second nearest neighbor atoms around the Fe atom in the c-plane; the Mn atom possesses Mn pairs at about 3.22 Å , which correspond to the second nearest neighbor atoms around the Mn atoms in the c-plane at 25 K. All the 3g sites are occupied only by the Mn atoms, while the Fe atoms are located on the 3f sites and form an equilateral triangle. These new results are totally different from the previous neutron and x-ray diffraction results.[9, 10] The interlayer distance between the 3f and 3g sites increases with increasing temperature. The Mn atoms at the 3g site have neighbors with a couple of Mn atoms along the c-plane and six Fe atoms at the 3f site along the c axis. For the 3g site in the c-plane, the Mn atom has two Mn atoms located at the distance of 3.22 Å as the second nearest neighbors at 25 K. The distance around the Mn atom in the 3g site is almost unchanged below 200 K and disappears at 295 K. The Fe atoms on the 3f site have six Mn atoms on the 3g site along the c axis. This interlayer distance between the 3f and 3g sites increases with increasing temperature. For the Fe– P/Si pairs, the nearest neighbor distance is independent of temperature, and the Debye– Waller factor increases as expected for a crystalline material with increasing temperature. In the 3f site on the c-plane the Fe atom has a pair of Fe atoms located at the distance of 2.65 Å as the first nearest neighbors and four Fe atoms at 4.01 Å as the second ones at 25 K. These distances around the Fe atom in the 3f site are constant within the error with increasing temperature from 25 K to 200 K, which decreases suddenly by nearly 2% for the first neighbors and by about 1% for the second ones at 295 K. Three Fe atoms at the 3f site and one Mn atom at the 3g site form a tetrahedral structure. Based on the XAFS data, we calculated the volume of the tetrahedron in the ferromagnetic and the paramagnetic state. The estimated volume is 3.9823 Å 3 at 200 K (in the ferromagnetic phase) and 3.9937 Å 3 at 295 K (in the paramagnetic phase). When the material undergoes a transition from the ferromagnetic state to the paramagnetic state, the relative volume change is 2.8 × 10− 3, which is larger than the value of 0.64 × 10− 3 for Fe2P reported by Fujii et al.[8] EXAFS provides the local atomic structure for a selected atomic species, while XRD provides information about the unit cell dimensions, which comes from the average effect of the overall crystal. Therefore, it is reasonable to presume that the local structure of the Fe in this material is greatly distorted, which probably results from magnetoelastic coupling. Delczeg-Czirjak et al. pointed out that in the MnFePSi compound, stabilization of the ferromagnetic structure is due to the localization of the Fe moments induced by the larger Fe– Fe distance in the ferromagnetic phase.[15] Our results show that the Fe– Fe distance change between the ferromagnetic and the paramagnetic states is up to 2% in the MnFeP0.56Si0.44 compound. We presume that this large change comes from the magnetoelastic effect and plays an important role in determining the first-order phase transition. The distance between the 3g and 3f layers, derived from the Mn K edge, is shorter than that derived from the Fe K edge. The accuracy of the derived structural parameters for the Mn K edge is somewhat lower than that of the Fe K edge due to the limited energy range. On the other hand, this may be affected by the distortion of the local environment of the Fe atoms, because the distances between the Fe atom and its first nearest neighbor atoms in the 3f-layer are similar to the distance between the 3g and 3f layers.
| Table 1. Structural parameters of MnFeP0.56Si0.44 determined from the Mn K edge EXAFS at temperatures 25 K, 100 K, 200 K, and 295 K, where A is an absorbing atom, B is a backscattering atom, N is the coordination number, R is the interatomic distance, σ is the Debye– Waller factor, and Δ E is the threshold energy difference. The fitting parameters are N, R, σ , and Δ E. |
| Table 2. Structural parameters of MnFeP0.56Si0.44 determined from the Fe K edge EXAFS at temperatures 25 K, 100 K, 200 K, and 295 K, where A is an absorbing atom, B is a backscattering atom, N is the coordination number, R is the interatomic distance, σ is the Debye– Waller factor, and Δ E is the threshold energy difference. The fitting parameters are N, R, σ , and Δ E. |
In conclusion, the local structures around the Fe atoms and the Mn atoms in the MnFeP0.56Si0.44 compound have been determined from the Fe K and Mn K edge EXAFS spectra. The Fe and Mn atoms occupy the 3f and 3g sites, respectively. This is a new observation, differing from previous reports. In 3f layers the first and the second Fe– Fe neighboring distances exhibit large changes at the magnetic transition. These large changes come from the magnetoelastic effect and play an important role in determining the first-order phase transition.
| 1 |
|
| 2 |
|
| 3 |
|
| 4 |
|
| 5 |
|
| 6 |
|
| 7 |
|
| 8 |
|
| 9 |
|
| 10 |
|
| 11 |
|
| 12 |
|
| 13 |
|
| 14 |
|
| 15 |
|