Plasma induced by pulsed laser and fabrication of silicon nanostructures

Plasma induced by pulsed laser and fabrication of silicon nanostructures |
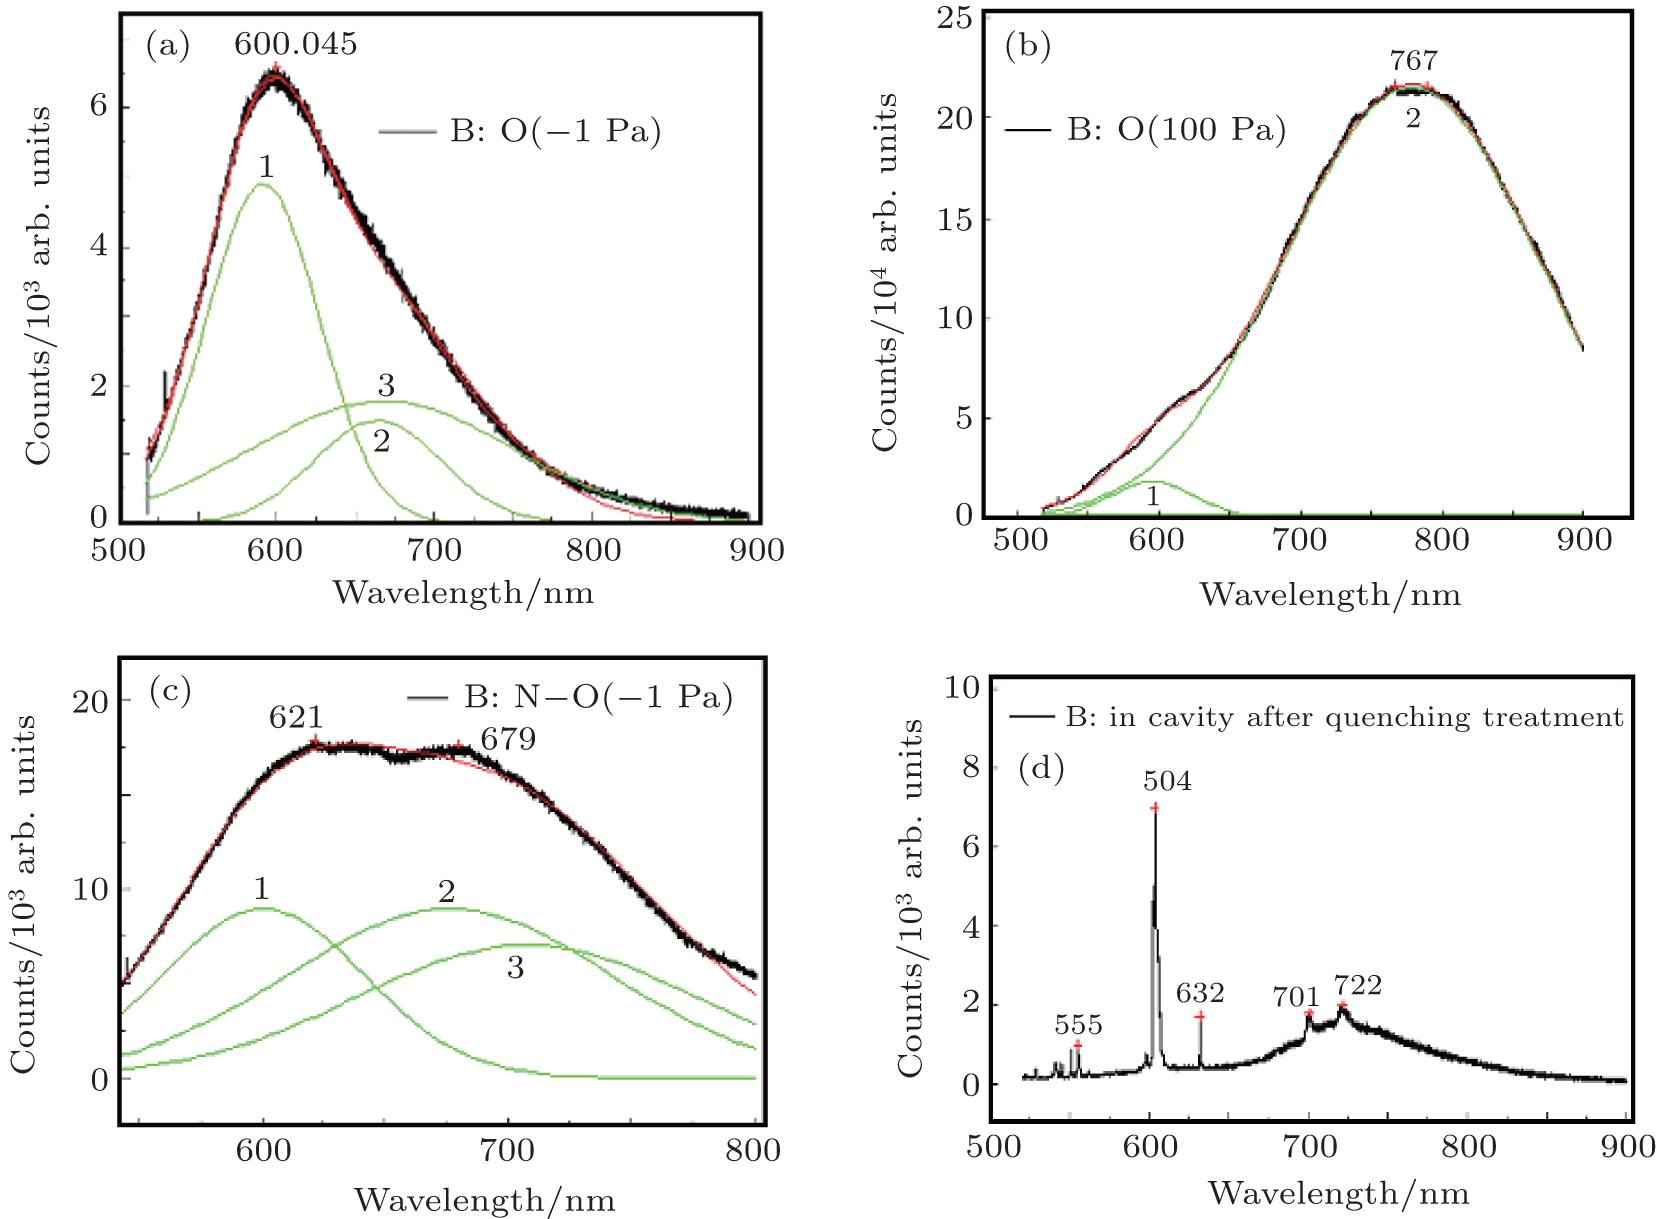
| (a) PL spectrum on nanosilicon sample prepared at a smaller oxygen pressure (< 10−1 Pa), in which the stronger fit peak 1 from Si–O–Si bonds relates to the localized states emission, the broader fit peak 3 relates to the QC effect emission. (b) PL spectrum on nanosilicon sample prepared at a larger oxygen pressure (> 100 Pa), in which the stronger fit peak 2 (the red-shift occurs) from Si=O bonds relates to the localized state emission, and the fit peak 3 disappears because of the relaxation of almost transition electrons from the high states to the lower localized states. (c) PL spectrum on sample prepared in oxygen and nitrogen environment. (d) PL spectrum on nanosilicon sample prepared at an oxygen pressure (∼10−1 Pa) after annealing and quenching treatment for 15 min, in which the localized states emission plays a main role and several sharper peaks occur in the resonant modes of the Purcell cavity. |
 |