


Characteristic of femtosecond laser pulsed digital holography
[Shi Bing-Chuana) , Wang Xiao-Lei†a)  , Guo Wen-Gang
b) , Song Li-Peia) ]
, Guo Wen-Gang|
|


†Corresponding author. E-mail: wangxiaolei@nankai.edu.cn
*Project supported by the National Natural Science Foundation of China (Grant No. 61275133).
Digital holography can be applied to ultrafast detection when a femtosecond laser pulse is used. In this paper, the interference process of two femtosecond laser pulses is studied and the recording process of the femtosecond laser pulsed digital hologram is simulated. Holograms at different recording angles are generated by integrating the instantaneous interference field. By analyzing the distribution of the reconstructed phase error, the characteristics of femtosecond laser pulsed digital holography are discussed.
In recent years, with the development of femtosecond laser pulse technology, femtosecond laser pulsed digital holography has been widely used. Compared with the conventional laser source, the femtosecond pulse has a very short duration, which means that it has a high time resolution in time-resolved pump-probe detection, short coherence length in multi-pulse interference, and strong peak power in laser ablation. In recent researches, the time-resolved femtosecond laser pulsed holography has been applied to detecting an ultrafast process, [1, 2] such as laser interaction with materials, because it can provide much valuable experimental data due to its ability to record both amplitude and phase information. Digital holographic tomography[3– 5] based on a short coherent pulse provides a new and effective way to avoid speckle noise. Instead of point-wise laser direct writing, femtosecond holographic lithography technology[6– 9] has been used for machining the macro-grating structure and has potential applications in diffractive optical element lithography. Because of the short duration, the distribution of the interference field of femtosecond pulses is also different from that of a continuous laser, while the distribution is critical to digital holographic recording. Although some researches have been done on femtosecond digital holography, [10– 12] the characterization and processing method show less difference. In this paper, we characterize the temporal integrating process of femtosecond laser pulsed interference and simulate its ability to make holographic recording in a specific case.
Formed by multi-longitudinal mode locking, lots of frequency components are included in a pulse. Generally we assume that the amplitudes of the longitude modes have a symmetric Gaussian distribution, so the pulse envelope, which is obtained by the Fourier transform of the longitude modes, is Gaussian shaped in the time domain. In this case, the phase term can be expressed as a monochromatic wave of the central frequency. So the laser pulse can be expressed as

where Δ t is the pulse duration, ω 0 is the central frequency, φ 0 is the initial phase, and the pulse propagates in the Z direction.
Generally, the quadratic phase in the X– Y plane will be greatly weakened in the beam expanding process, thus no longer be considered. Assuming that the beam radius of the Gaussian beam is R, the amplitude distribution in the X– Y plane is

Based on Eqs. (1) and (2), the spatial and temporal expression of the Gaussian pulse amplitude is

Figure 1 shows the schematic diagram of the interference process by two femtosecond pulses. In Fig. 1, pulses E1 and E2 are distributed in coordinate systems (X, Y, Z) and (X′ , Y′ , Z′ ) respectively:


where coordinate system (X′ , Y′ , Z′ ) is rotated by a small angle α around the X axis with respect to coordinate system (X, Y, Z), thus the beam angle is α . The relationship between the two coordinates is

 | Fig. 1. Interference and recording of femtosecond laser pulses. |
As the pulses propagates, the amplitude of the femtosecond pulse changes rapidly, so the interference process lasts a very short time, and the instantaneous intensity is

The interferogram recorded by the charge coupled device (CCD) is:

For a certain pixel of the charge coupled device (CCD), the phase difference between pulses E1 and E2 is constant, so the difference in pixel energy is just caused by the difference in pulses’ amplitude. Given in the following is a detailed illustration of this process.
Figure 2 shows the overlapping process of two femtosecond laser pulses in the x = 0 plane. The photosensitive surface of the CCD is placed in the plane at z = 0. The pulse duration is set to be 50 fs, the wavelength is 800 nm and the pulse amplitude is 0.5, the radius of the incident beam is 3 mm, the angle between two beams α is 0.01 rad and the time when the amplitude peak of a single pulse arrives at the z = 0 plane (the vertical center line in Fig. 2) is set to be 0 fs. Corresponding to Fig. 2, the normalized intensity of the interference signal is shown in Fig. 3. In Figs. 2 and 3, different scales of Z and Y axes are adopted to obtain a better demonstration effect, where the Y axis ranges from − 5 mm to 5 mm and the Z axis ranges from − 100 μ m to 100 μ m.
 | Fig. 2. Amplitude overlapping of two pulses at different times. |
 | Fig. 3. Intensity distributions of interference signal at different times. |
As can be seen in Fig. 2, the pulse amplitudes in the recording plane are not always equal, so the instantaneous interference signal is rapidly changing in the plane. Figure 3 shows the changing process of the relative position between the signal and the recording plane.
In Fig. 2, we can see that from − 100 fs to − 50 fs, part of the oblique incident pulse E2 arrives at the recording plane while the normal incident pulse E1 is far from it. So there is no interference fringe as shown in Fig. 3. At about − 50 fs, the front of pulse E1 arrives and is superimposed on E2, thus interference fringes are generated in Fig. 3. From − 50 fs to 0 fs, the interference signal increases as the pulse amplitude increases. At 0 fs the interference signal reaches its maximum. From 0 fs to 50 fs, the interference signal decreases as the amplitudes of pulse E1 and pulse E2 decrease. At about 50 fs, the tail of pulse E1 escapes from the recording plane while part of pulse E2 does not yet. So after 50 fs, the interference signal in the recording plane disappears and the rest of the energy of E2 is only contributed to background intensity.
To realize the characteristic performance of femtosecond laser pulsed digital holography, image digital holographic recording and reconstruction process are simulated.[13] A two-dimensional cosine phase object is chosen as an object to be recorded as shown in Fig. 4(a). The holograms are recorded by a virtual CCD (1024 pixels× 1024 pixels, 4 μ m× 4 μ m, 8 bit) at different angles between two beams. For example, only holograms with the values of angle α being 0.01 rad, 0.02 rad, and 0.03 rad are given in Fig. 4(b). For comparison, holograms generated by continuous laser are also given in Fig. 4(c).
 | Fig. 4. (a) Two-dimensional phase object, (b) holograms recorded by femtosecond pulses, and (c) holograms recorded by continuous laser. |
Compared with the holograms generated by the continuous laser in Fig. 4(c), the fringe of femtosecond pulsed holograms in Fig. 4(b) has a lower edge contrast with the increase of angle α . We reconstruct the femtosecond pulsed holograms and the continuous laser holograms, and the error distributions of the reconstructed phase are shown in Figs. 5 and 6 respectively. A Hanning window[14] is used in Fourier transform in order to reduce frequency spectrum leakage.
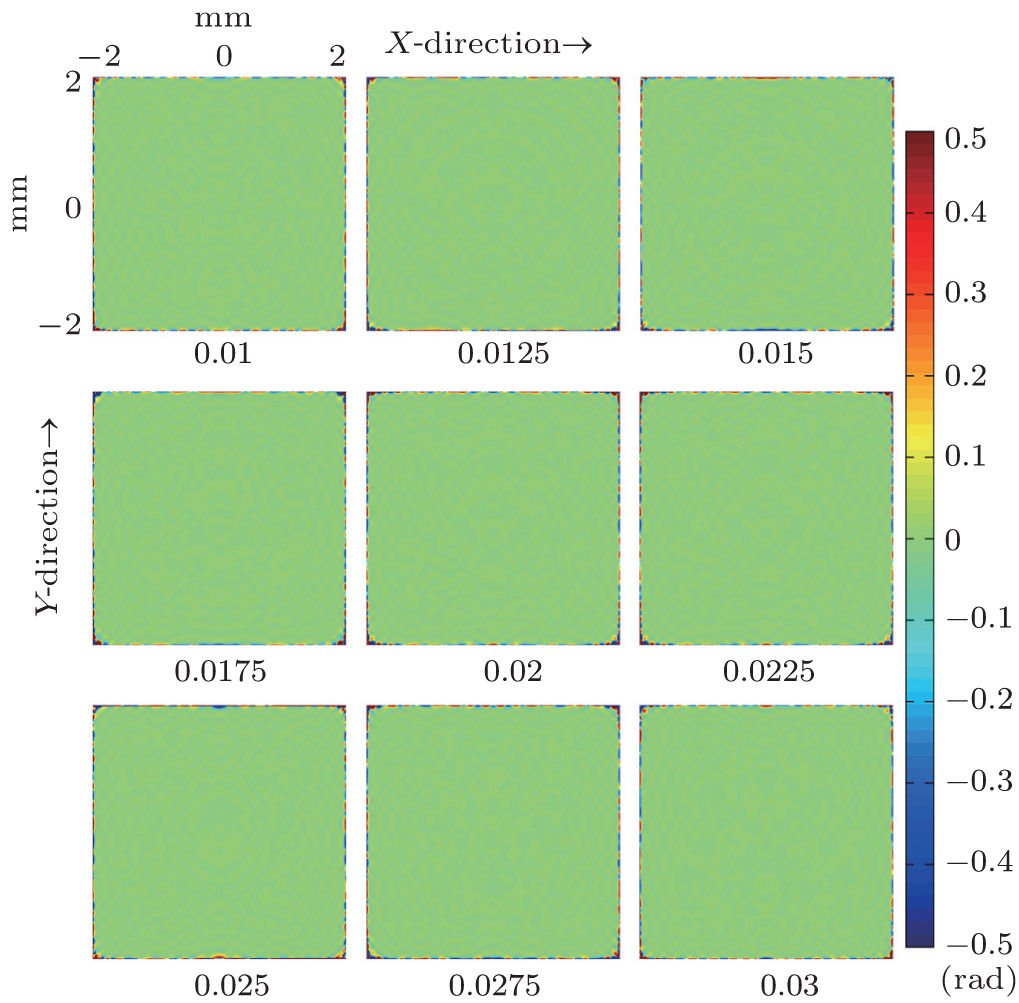
 | Fig. 5. Error distributions of reconstructed phases of femtosecond pulsed holograms. |
 | Fig. 6. Error distributions of reconstructed phases of continuous laser holograms. |
In order to display the error value we are concerned with, in Figs. 5 and 6 the maximum and minimum value are limited to 0.5 rad and − 0.5 rad respectively, thus phase errors greater than 0.5 rad or less than − 0.5 rad are just shown to be 0.5 rad or − 0.5 rad respectively.
As shown in Fig. 5, when the angle α between two beams is less than 0.015 rad, the points of phase error are limited on the edge of the reconstructed phase map. As α increases to 0.0175 rad, the points of phase error expand and have a tendency that they are connected into a region in the Y axis direction. As α increases to 0.02 rad, a significantly different region consisting of many error points appears on each of both sides in the Y direction. The error distributions in Fig. 5 indicate that the phase error region expands obviously as the angle α between two beams increases. However, from Fig. 6 it can be seen that the phase error derived from holograms generated by continuous laser is not influenced by increasing angle α between two beams.
Figure 7 shows the statistics of Fig. 5, in which the percentages of phase error points less than 0.5 rad, 0.3 rad, and 0.1 rad are plotted with respect to the angle between two beams respectively. When the angle is not more than 0.015 rad, up to 95% points can be reconstructed in high accuracy (phase error< = 0.1 rad). Obviously there exists a slope change between 0.015 rad and 0.025 rad. When the angle is greater than 0.025 rad, the percentage decreases linearly. These three sections of the phase error points are corresponding to the expanding process mentioned above. So the angle is less than 0.015 rad, and we can infer that the phase error points are just caused by the Gibbs effect at the edge, namely, the reconstructed phase derived from femtosecond laser pulsed digital hologram has a high accuracy. As the angle is greater than 0.025 rad, the percentage decreases sharply in Fig. 7, which is caused by non-interference of the two pulses.
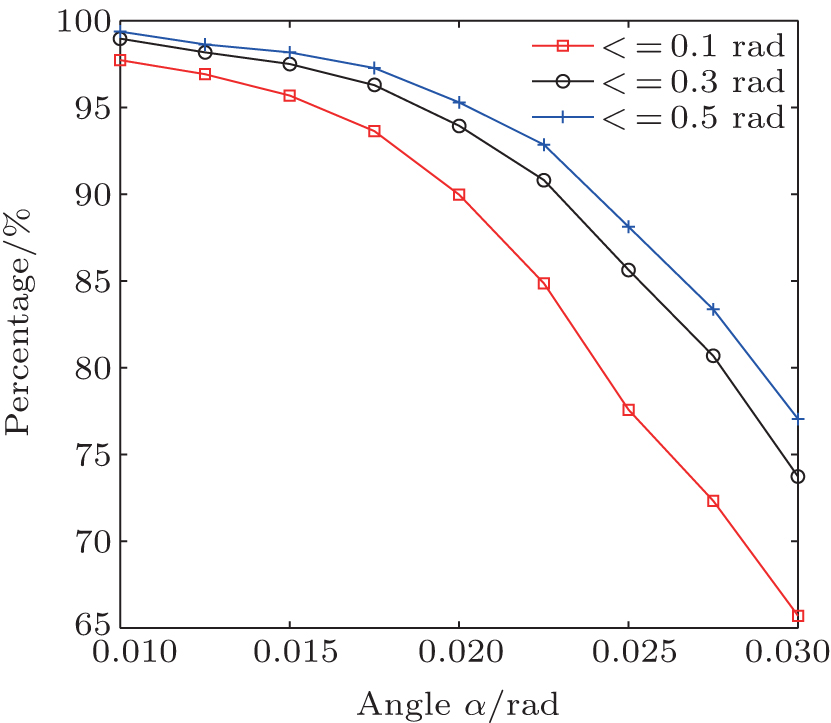 | Fig. 7. Statistics of phase error points. |
According to the above simulations and analyses, we can know that the recording area becomes smaller with the increase of the angle between two beams, so the interference recording area of femtosecond laser pulsed digital holography is limited. The limitation comes from the limited spatial and temporal distribution of femtosecond laser pulses. Although neither noise nor fluctuation is not considered, the simulation and analysis results above can be a guide to the implementation of the femtosecond laser pulsed digital holography.
| 1 |
|
| 2 |
|
| 3 |
|
| 4 |
|
| 5 |
|
| 6 |
|
| 7 |
|
| 8 |
|
| 9 |
|
| 10 |
|
| 11 |
|
| 12 |
|
| 13 |
|
| 14 |
|