†Corresponding author. E-mail: jieyuan@nudt.edu.cn
‡Corresponding author. E-mail: maxborn@nudt.edu.cn
*Project supported by the National Natural Science Foundation of China (Grant No. 61475192) and the Science Research Program of National University of Defense Technology, China (Grant No. JC140702).
A dip of the transverse component of the magnetic moment as a function of resonance frequency-detuning will emerge when the intensity of oscillating magnetic field exceeds a specific value, which is demonstrated theoretically and experimentally. The linewidth of magnetic-resonance signal can be much smaller than when the M x– M R magnetometer operates on condition that the intensity of oscillating magnetic field is smaller than this specific value, and the M x– M R magnetometer can possess a much higher signal-to-noise ratio. The experimental result shows that the sensitivity of M x– M R magnetometer can be improved by an order of magnitude under this condition.
Detection of a weak magnetic field is vital in many areas such as fundamental physics, biomagnetism, and geophysical exploration.[1– 3] An optically pumped quantum magnetometer (OPQM) is excellent in these particular applications. The OPQM approach was first proposed by Dehmelt in 1957.[4] Later, it was implemented by Bloom.[5] After about five decades’ development, great progress has been achieved.[6– 8] The sensitivity of OPQM was demonstrated to be 

Based on the form of a magnetic resonance signal which is associated with the projection of the magnetic moment, general OPQMs are divided into Mz magnetometer and Mx magnetometer. The Mz magnetometer detects the absorption signal of the longitudinal component of the magnetic moment (Mz signal).[9] It possesses a relatively high sensitivity which is limited by the linewidth and signal-to-noise ratio but a slow response speed in the limit of longitudinal relaxation time T1. The Mx magnetometer detects the phase of the oscillating transverse component of the magnetic moment (Mx signal).[9] Its response time is not limited by the relaxation time, so it possesses a high operational speed. However, it is so sensitive to the phase error that its sensitivity is relatively low. In many situations, a magnetometer with a high operational speed and sensitivity is necessary.[10] An idea of an Mx– Mz tandem which combines the advantages of Mz and Mx magnetometers was proposed and further developed.[11– 13] It detects both the amplitude (MR signal) and the phase of the oscillating transverse component of the magnetic moment. The MR signal is similar to the Mz signal and also possesses high sensitivity but low operational speed which can be compensated for by the Mx signal.
As for the MR magnetometer and Mz magnetometer, the sensitivity δ B is given by

where, Δ ω is the resonance linewidth, γ is the gyromagnetic ratio of sensory atom (alkali-metal atom), and SNR is the signal-to-noise ratio. So the sensitivity can be improved by reducing Δ ω and improving SNR. In a traditional measuring method, the Rabi frequency ω 1 satisfies

where, B1 is the amplitude of oscillating magnetic field, and T2 is the transverse relaxation time. Under this condition, the resonance linewidth is limited to 2/T2.
In this paper, a dip of the MR signal as a function of resonance frequency-detuning will emerge when ω 1 is larger than (T1T2)− 1/2, which is demonstrated theoretically and experimentally. The Mx– MR magnetometer which operates under this condition is analyzed. Compared with the Mx– MR magnetometer which operates when ω 1 < (T1T2)− 1/2 in Ref. [12], this magnetometer has a linewidth that can exceed the limit of 2/T2, and more important is that the Mx– MR magnetometer can possess a much higher signal-to-noise ratio. When B1 is properly chosen, the sensitivity can be improved by an order of magnitude. The Mx– MR magnetometer with higher sensitivity can be achieved without losing the operational speed.
As for a vapor cell filled with alkali-metal atoms, considering a constant field B0 directed along the Z axis in the laboratory coordinate system XYZ as shown in Fig. 1(a), the energy levels of alkali-metal atoms will split along the Z axis. In the equilibrium state, the numbers of atoms in different Zeeman energy levels obey the Boltzmann distribution, and it can be described by a macroscopic magnetization M0 along the Z axis. As the difference in the number of atoms between different Zeeman energy levels is tiny, M0 is quite small. If circularly polarized light is used to pump alkali-metal atoms along the Z axis, [14]M0 will be improved by several orders of magnitude. In Fig. 1(a), an oscillating magnetic field B1 = 2B1x̂ cos(ω at) exciting the atomic transition is applied along the X axis.
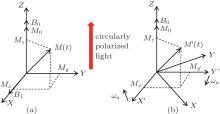 | Fig. 1. Magnetization vectors in (a) a laboratory coordinate system XYZ and (b) a rotating coordinate system X′ Y′ Z. |
A rotating coordinate system X′ Y′ Z which rotates clockwise around the Z axis with a frequency of ω α is introduced and shown in Fig. 1(b). The magnetization vector M due to spin polarization is represented as (Mx(t), My(t), Mz(t))T in the XYZ coordinate system. In the X′ Y′ Z coordinate system, the magnetization vector M′ is represented as (Mx′ (t), My′ (t), Mz(t))T. The following relationship can be easily obtained:

in the above equation, 
For simplifying computation, we divide B1 into the clockwise components and counterclockwise components. The clockwise components are Bx = B1cos(ω α t) and By = − B1sin(ω α t), and the counterclockwise components are Bx = B1cos(ω α t) and By = B1sin(ω α t). The counterclockwise components have little influence on the evolution of M unless B1 is quite large.[15] When we ignore the counterclockwise components with the rotating-wave approximation, the evolution of the magnetization vector M′ can be described by

where, ω 2 = γ B0− ω α is the detuning of resonance frequency. By setting the above equations to be equal to zero, the stationary solution can be obtained as follows:

Substituting Eq. (5) into Eq. (3), we obtain

By setting dMR/dω 2 = 0, the following solution can be easily obtained:

If ω 1 is larger than (T1T2)− 1/2, a dip of the MR signal as a function of the resonance frequency-detuning emerges. The width of two peaks Δ ω p − p is

Therefore, the linewidth (full-width at half-maximum) of the dip can exceed the limit of 2/T2.
When the influences of the counterclockwise components of B1 are considered, reference [15] shows that in the lowest order correction the shape of the resonance curve is unchanged but it is shifted. The resonance frequency 

Here, ω 0 = γ B0, and [B1/(2B0)]2 is the percentage of frequency-shift. Usually, T1 ≈ 2T2.[16] By assuming T1 = 2T2, when 
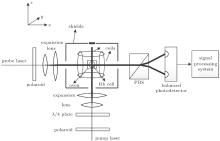
The experimental setup is shown in Fig. 2. A spherical Pyrex cell with a diameter of 2 cm contains 87Rb atoms and 100 Torr (1.33322× 10² Pa) of buffer gas (N2 and 4He) for slowing atomic diffusion and quenching. The cell is placed inside a five-layer magnetic shield and heated with a hot air oven. A constant magnetic field B0 and an oscillating magnetic field B1 are generated by the surrounding two pairs of Helmholtz coils. The Helmholtz coils along the Z axis are driven by steady current circuit and the Helmholtz coils along the X axis are driven by a lock-in amplifier. The pump beam is generated by a distributed feedback diode laser which is locked to 87Rb D1 transition. It becomes circularly polarized beam after passing through a polaroid and λ /4 plate. Then, it polarizes the 87Rb atoms along the Z axis after expansion and collimation. The probe beam is generated by a distributed feedback diode laser which is turned to near 87Rb D1 transition. It illuminates the cell after passing through the polaroid and apparatus of expansion and collimation. The Mx(t) signal is measured with a polarized beam splitter (PBS) and a balanced photodetector by utilizing optical rotation of the linearly polarized probe beam.[17] Finally, the detected signal is acquired and processed by the signal processing system.
The cell is heated and its temperature is stabilized at 110 ° C. The frequency of B1 is slowly linearly scanned with different amplitudes. The MR signals are extracted from Mx(t) signals and shown in Fig. 3 when ω 1 < (T1T2)− 1/2 and ω 1 > (T1T2)− 1/2. Compared with Fig. 3(a) when ω 1 < (T1T2)− 1/2, figure 3(b) shows an obvious dip when ω 1 > (T1T2)− 1/2.
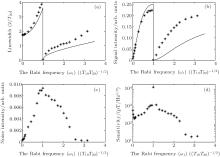
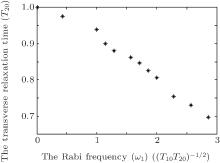
In order to compare the characteristics of the Mx– MR magnetometer when ω 1 < (T1T2)− 1/2 with those when ω 1 > (T1T2)− 1/2, we measure the sensitivities of the Mx– MR magnetometer with different values of ω 1 under the same condition. When ω 1 is smaller than (T1T2)− 1/2, we define the resonance linewidth as the full-width at half-maximum of MR signal, which is a function of detuning (ω 2), and the signal intensity as half of the amplitude of MR at ω 2 = 0. Similarly, when ω 1 is larger than (T1T2)− 1/2, the resonance linewidth is defined as the full-width at half-maximum of the dip and the signal intensity is defined as half of the depth of the dip. The experimental results of the linewidth and signal intensity as a function of ω 1 are shown in Figs. 4(a) and 4(b) by using asterisks. In Figs. 4 and 5, T20 is the transverse relaxation time which is obtained by measuring ϕ (t) as a function of ω 2 when ω 1 is much smaller than (T1T2)− 1/2, [18] and T10 is the longitudinal relaxation time which is assumed to be a constant. The computational results of the linewidth and signal intensity can be obtained from Eqs. (6) and (7) by assuming both T2 and T1 to be constants, which are shown in Figs. 4(a) and 4(b) by using solid lines. From Figs. 4(a) and 4(b), we can find that the results of experiment and computation are almost identical when ω 1 is small. As ω 1 becomes larger, the difference between experimental results and computational results increases. It is mainly because T2 and T1 are assumed to be constants in our computation. In fact, T2 is related to the intensity of oscillating magnetic field. The experimental results of T2 are obtained at different values of ω 1 by measuring ϕ (t) as a function of ω 2, and the results are shown in Fig. 5. From Fig. 5, we can find that the influence of ω 1 on T2 becomes much larger as ω 1 increases. Though T2 is related to ω 1, the change in T2 is less than forty percent. In addition, the operational speed of the Mx magnetometer is independent of relaxation time. Therefore, it has no influence on the operational speed of the Mx– MR magnetometer.
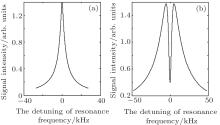 | Fig. 3. The MR signals extracted from Mx(t) signals when (a) ω 1 < (T1T2)− 1/2 and (b) ω 1 > (T1T2)− 1/2. |
Although the technical noises can be completely eliminated in theory, they dominate rather than the quantum noises in practice. As for the atomic magnetometer, there are many fluctuations which cannot be avoided, such as the fluctuations in frequency and intensity of pump laser and probe laser, temperature, etc. These fluctuations will induce the fluctuations (δ M0 and δ T2) in M0 and T2. When the noise intensity is defined by the fluctuation of the MR signal at ω 2 = 0, the intensities of these noises (NM0 and NT2) induced by δ M0 and δ T2 can be obtained from Eq. (6) as follows:

From the first expression of Eq. (10), it is easy to see that the noise intensity increases as the MR signal at ω 2 = 0 rises. From the second expression of Eq. (10), the noise intensity increases when the ratio of the square of the MR signal at ω 2 = 0 to ω 1 rises. According to the above definition of the signal intensity, when ω 1 is smaller than (T1T2)− 1/2, the signal intensity is positively associated with the MR signal at ω 2 = 0. However, when ω 1 is larger than (T1T2)− 1/2, the signal intensity is negatively associated with the MR signal at ω 2 = 0. From Eq. (6), the MR signal at ω 2 = 0 reaches a maximum at ω 1 = (T1T2)− 1/2 and will decrease when ω 1 > (T1T2)− 1/2. Considering these conditions, the noise intensity as a function of ω 1 first increases, and then decreases. The noise intensity is large when the signal intensity is large under the condition of ω 1 < (T1T2)− 1/2. On the contrary, the noise intensity is small when the signal intensity is large under the condition of ω 1 > (T1T2)− 1/2. For obtaining the noise intensity experimentally, the MR signal at ω 2 = 0 passes through a low-pass filter with a cut-off frequency of 50 Hz, and then the filtered signals are continually acquired. By computing the standard deviation of 1000 continual data of the acquired MR signal intensity at ω 2 = 0, the noise intensity with a bandwidth of 50 Hz is obtained and shown in Fig. 4(c). From Figs. 4(b) and 4(c), we can find that the Mx– MR magnetometer can possess a strong anti-noise ability and its signal-to-noise ratio can be much larger when ω 1 > (T1T2)− 1/2 than when ω 1 < (T1T2)− 1/2.
The sensitivity can be computed by utilizing Eq. (1), and the result is shown in Fig. 4(d). Under our experimental condition, the sensitivity of the Mx– MR magnetometer can be improved by an order of magnitude when ω 1 > (T1T2)− 1/2 compared with when ω 1 < (T1T2)− 1/2.
In this study, a dip of the MR signal will emerge when the Rabi frequency is larger than (T1T2)− 1/2, which has been analyzed. The resonance linewidth of the dip can exceed the limit of 2/T2. The experimental result shows that the oscillating magnetic field has an influence on transverse relaxation time and the influence becomes much larger as the intensity of oscillating magnetic field increases. However, the operational speed of the Mx magnetometer is independent of relaxation time. So the intensity of oscillating magnetic field has no influence on the operational speed of the Mx– MR magnetometer. It is demonstrated theoretically and experimentally that the noise intensity is large when the signal intensity is large under the condition of ω 1 < (T1T2)− 1/2. On the contrary, the noise intensity is small when the signal intensity is large under the condition of ω 1 > (T1T2)− 1/2. Therefore, the Mx– MR magnetometer can possess a strong anti-noise ability and its signal-to-noise ratio can be much larger when ω 1 > (T1T2)− 1/2. Its sensitivity can be improved by an order of magnitude without losing the operational speed under our experimental condition. Further research is needed to further improve the characteristics and solve some open problems.
| 1 |
|
| 2 |
|
| 3 |
|
| 4 |
|
| 5 |
|
| 6 |
|
| 7 |
|
| 8 |
|
| 9 |
|
| 10 |
|
| 11 |
|
| 12 |
|
| 13 |
|
| 14 |
|
| 15 |
|
| 16 |
|
| 17 |
|
| 18 |
|


