Characterizing silicon intercalated graphene grown epitaxially on Ir films by atomic force microscopy

Characterizing silicon intercalated graphene grown epitaxially on Ir films by atomic force microscopy |
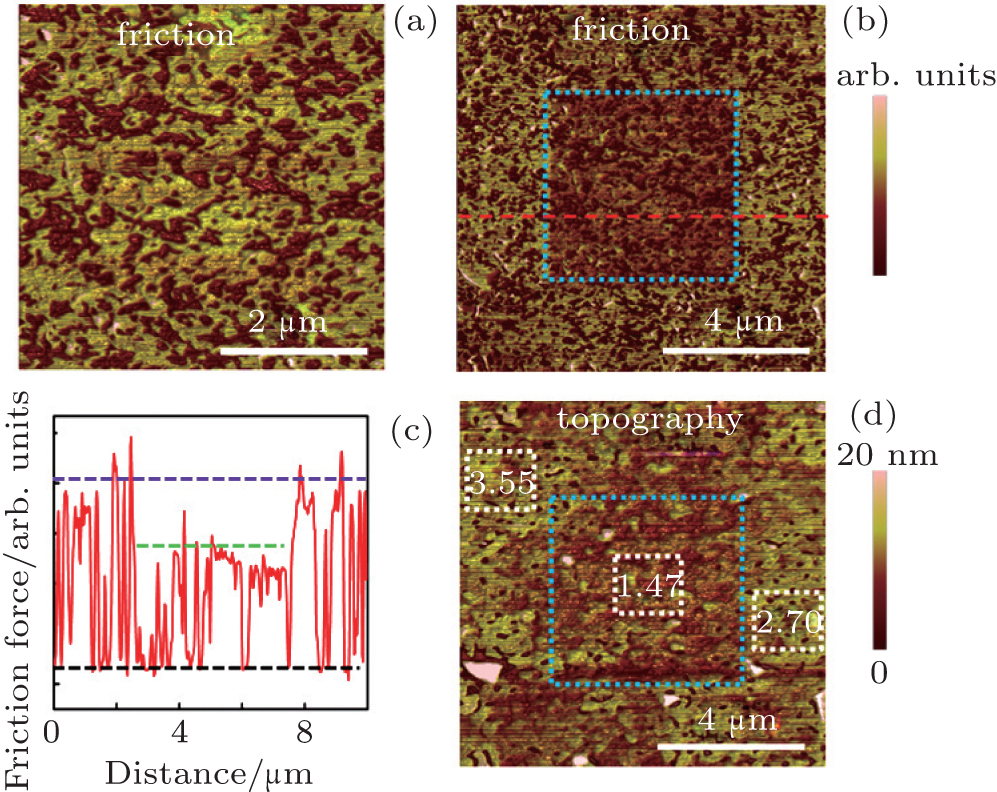
| The effect of repeated scanning by AFM tip in contact mode. (a) Friction force map of the sample after the first scan. (b) The friction map obtained from a larger area centered in panel (a). The blue dotted-square indicates the region in panel (a) scanned repeatedly, where an obvious contrast difference can be observed, indicating that the friction coefficient is reduced by increasing the scan times. (c) Friction force profile taken along the red dotted-line in panel (b). Three horizontal lines across the profile were drawn to assess the change of the friction force. The friction in the middle part (indicated by the green dashed-line), the repeatedly scanned area, become smaller than those of the outside area (indicated by the purple dashed-line). (d) The corresponding topographic image of panel (b). The apparent roughness in the middle region (1.47 nm) marked by a white square is smaller than in the other two square regions (3.55 nm and 2.70 nm) outside. All measurements were made under contact mode with a scanning rate of 1 Hz. |
 |