
Electronic and optical properties of lithium niobate under high pressure: A first-principles study
[Sang Dan-Dana) , Wang Qing-Lin†b)  , Han Chong‡
a) , Chen Kai, Pan Yue-Wu]
, Han Chong‡, Chen Kai, Pan Yue-Wu]
|
|


†Corresponding author. E-mail: wangql@hpstar.ac.cn
‡Corresponding author. E-mail: hanchongxz@163.com
*Projects supported by the National Natural Science Foundation of China (Grant Nos. 11347154 and 51172194) and the Foundation of Xuzhou Institute of Technology, China (Grant No. XKY2013203).
We theoretically study the structural, electronic, and optical properties of lithium niobate under pressure using the plane-wave pseudopotential density functional theory by CASTEP code. It was found that there is a phase transition from the R3 c structure to the Pnma structure at a pressure of 18.7 GPa. The Pnma structure was dynamically stable according to the calculation of phonon dispersion. From the charge density distributions, there exist covalent interactions along the Nb–O bond. The hybridization between O 2p and Nb 4d orbital in the Pnma phase increases with increasing pressure, while it is not changed in the R3 c phase. With increasing pressure, the average Nb–O bond length decreases and the Nb–O bond population increases, indicating the increased covalent character between Nb and O atoms under high pressure at Pnma phase, which leads to the increased hybridization between O 2p and Nb 4d orbitals. Furthermore, the optical dielectric function, refractive index, extinction coefficient, electron energy, loss and reflectivity are calculated.
Lithium niobate (LiNbO3, LN) is an important ferroelectric material that is used in several practical applications owing to its good electro– optic, photorefractive, and nonlinear optical properties.[1– 4] At room temperature, it has trigonal R3c

Another factor that can induce the structural phase transition in LN is pressure. Da Jornada et al.[6] made a high pressure x-ray diffraction study of LN at room temperature and reported a phase transformation at 30± 3 GPa. They concluded that the structure of this high-pressure phase was cubic. Using high-pressure Raman-scattering method at room temperature, Lin et al.[7] reported that LN became amorphous at about 31 GPa, which is driven by a significant volume reduction and the denser packing of highly distorted oxygen octahedra. Mukaide et al.[8] conducted high-pressure in situ x-ray experiments and found that a phase transition to another phase (probably NaIO3-type structure) occurred at about 25 GPa at room temperature. No further transformation was observed up to 90 GPa. Suchocki et al.[9] showed by high pressure Raman and x-ray diffraction studies that the pressure at which phase transitions from R3c to most probably NaIO3-type phase occurred depended on Li/Nb ratio in LN crystals and was reduced in near-stoichiometric crystals. Very recently, Nakamura et al.[10] explored the pressure-induced phase transition in LN with first-principles calculations. Although the Cmcm phase has a better thermodynamic stability than Pnma symmetry at higher pressure, taking the atomistic mechanisms behind the phase transition into account, the Pnma symmetry was predicted as a room temperature, high-pressure phase and was consistent with the experimental results.
As mentioned above, the phase transition behaviors of the LN and related mechanisms have been gradually clarified under high pressure. The electronic and optical properties of LN are important for its functional applications, as in other ABO3 type materials.[11, 12] However, this point has scarcely been tackled and this lack has motivated the present work. Using the first-principles calculations method, we theoretically investigated the electronic and optical structure of both R3c and Pnma phases of LN under high pressure. The charge transfer process was also discussed. The rest of this paper is organized as follows. In Section 2, we briefly describe the computational techniques used in this work. Then, in Section 3 we report and discuss the main results of this work. Finally, a brief summary will be given in Section 4.
The calculation was performed based on the density functional theory (DFT) and pseudopotential methods implemented in the Cambridge Serial Total Energy Package (CASTEP) code.[13] The electron– ion interaction was described by Vanderbilt type ultrasoft pseudopotentials.[14] The exchange and correlation terms were described with generalized gradient approximations (GGA) in the scheme of Perdew– Burke– Ernzerhof (PBE) exchange– correlational energy functional.[15] The structure was optimized with the Broyden– Fletcher– Goldfarb– Shanno (BFGS) method.[16] Integrations in the Brillouin zone were performed using special k points generated with 9× 9× 9, 8× 9× 6 for the R3c and Pnma structures, respectively, which make the separation of the reciprocal space to less than 0.02 Å − 1. One-electron valence states are expanded on a basis of plane waves with a cutoff energy of 700 eV in the electronic property calculations for both phases. Such parameters have been tested to be sufficient for convergence (< 10− 3 eV). During the structure optimization, the total energy is minimized by varying the cell parameters and atomic positions under the restriction of the given symmetry. In the geometrical optimization, all of the forces on the atoms were converged to less than 0.001 eV/Å , and the total stress tensor was reduced to the order of 0.01 GPa by using the finite basis set corrections.[17]
As we know, the thermodynamic stable phase at a given pressure and temperature is the one with the lowest Gibbs free energy G, given by

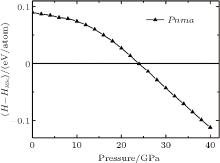
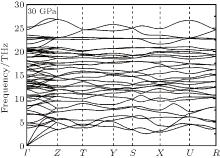
Here, U is the internal energy, P is the pressure, V is the volume, T is the temperature, and S is the entropy. Since the computational approach is based on constant-pressure static quantum mechanical calculations at T = 0 K, the relative stability of different structures can be deduced from the pressure dependence of the enthalpy instead of the Gibbs free energy.[18] As shown in Fig. 1, the calculation suggests that there is a transition from the R3c to Pnma structure. The pressure corresponding to Δ H = H − HR3c approaching zero is the transition pressure. To examine the dynamic stability of the Pnma phase, we calculated its phonon dispersion. As can be seen from Fig. 2, there are no imaginary phonon modes in the whole Brillouin zone, indicating that the Pnma phase is dynamically stable.
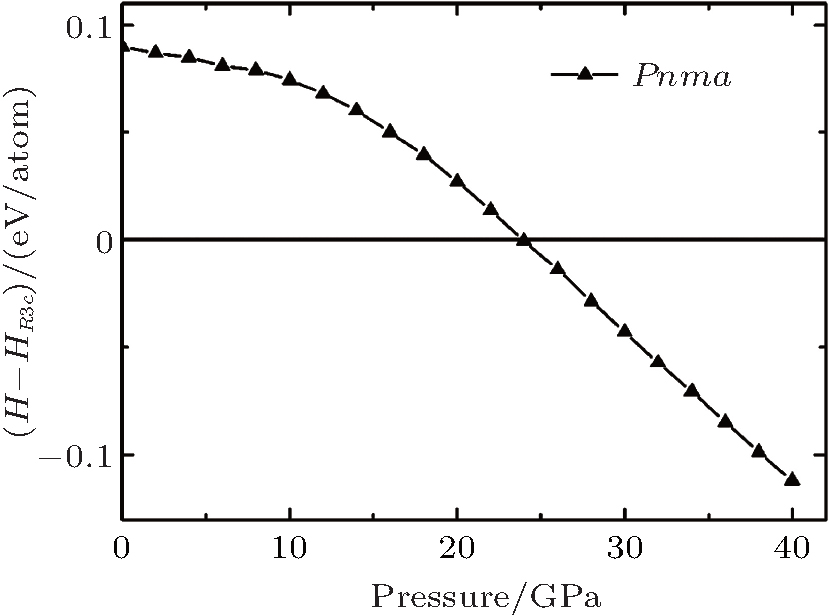 | Fig. 1. The calculated enthalpies of Pnma relative to R3c as a function of pressure. |
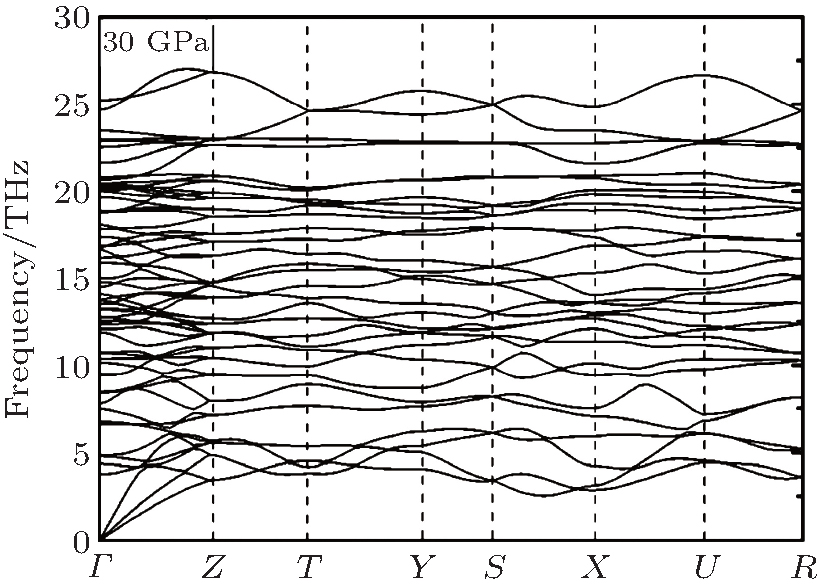 | Fig. 2. Phonon dispersion for the Pnma phase at 30 GPa. |
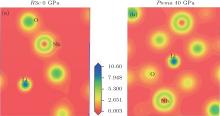
Figure 3 shows the calculated band structure and the pressure dependence of bandgap for LN. As pressure increases, the bandgap width increases in the R3c phase (dEg/dP > 0), whereas it decreases in the Pnma phase (dEg/dP < 0). The charge density distributions have been calculated to achieve a proper understanding of the electronic bond of the system being studied. Charge density distributions serve as a complementary tool that can be used to achieve a proper understanding of the electronic structure of the system being studied. From Fig. 4, we can see that there are some electrons between Nb atoms and O atoms in both phases, indicating that there are mainly covalent interactions along the Nb– O bond.
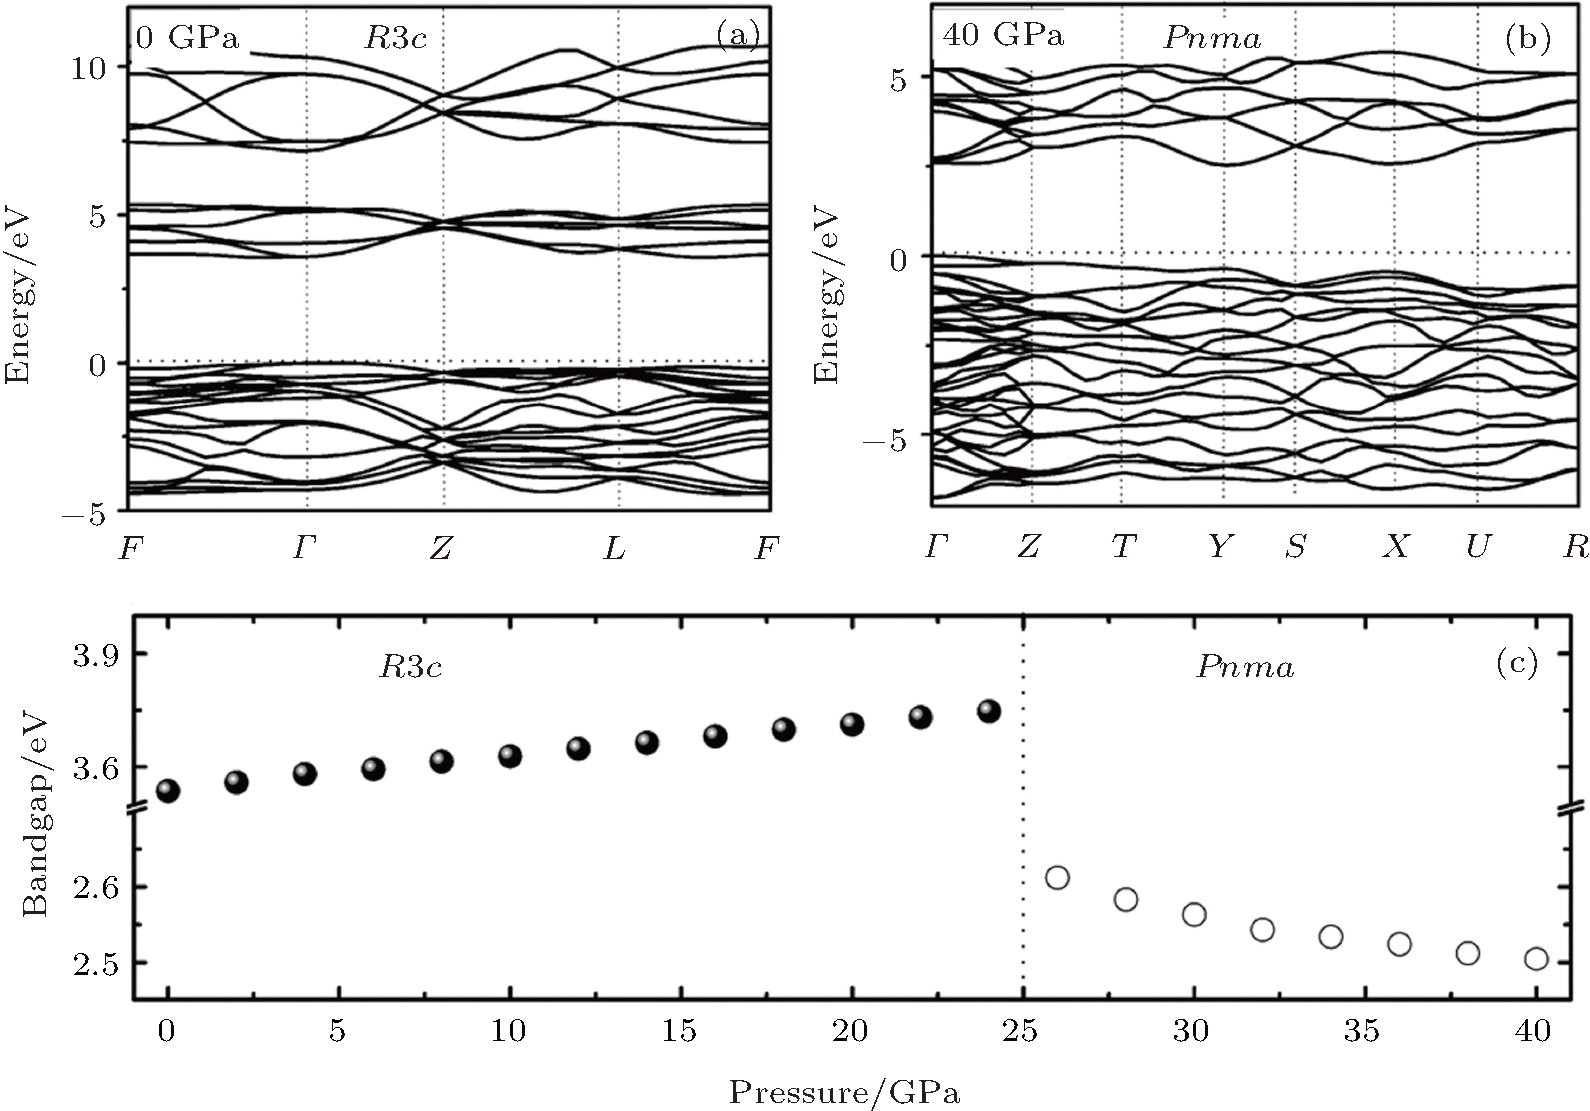 | Fig. 3. The band structure of (a) R3c phase at 0 GPa and (b) Pnma phase at 40 GPa, (c) the pressure dependence of energy bandgap in the two phases. |
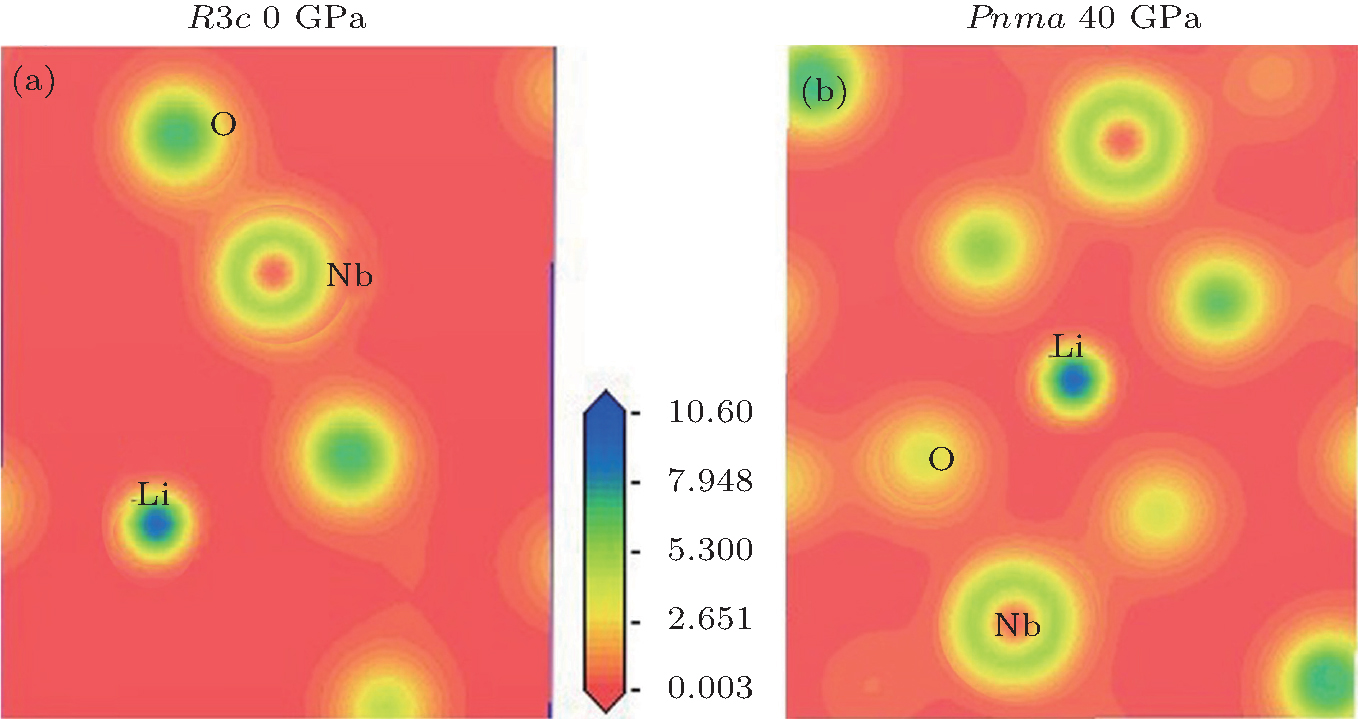 | Fig. 4. Calculated valence charge density distribution for (a) R3c phase at 0 GPa and (b) Pnma phase at 40 GPa in a plane which contains Nb, O, and Li atoms. |
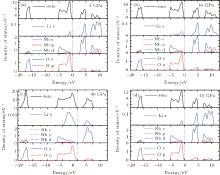
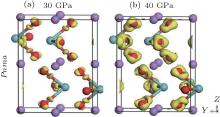
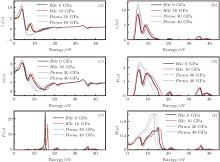
The density of states (DOSs) of both phases are plotted in Fig. 5. The lowest band between − 20 eV and − 15 eV is mainly composed of O 2p state. The upper valence-band in the range between 0 and − 10 eV is mainly divided into two regions: the low-energy region and the high-energy region. In the low-energy region, the O 2p states strongly hybridize with Nb 4d states. The high-energy region is predominately made up of O 2p state. Above the Fermi level, the conduction band of LN is dominated by Li 2s states and O 2p states. It can be seen that the hybridization has formed between O 2p and Nb 4d orbitals in the Pnma phase, and it increases as the pressure increases. However, the hybridization change is not pronounced in the R3c phase. As pressure increases, the charge distribution transfer happens from Nb5+ ion to O2− ion in the Pnma phase, which causes an enhancement in the electron localization around O atoms. This conclusion is further substantiated by the difference of charge density, as shown in Fig. 6. As pressure increases, the electron charge transfer happens from Nb5+ ion to O2− ion in the Pnma phase, which causes an enhancement in electron localization around O atoms. The charge transfer process under high pressure may lead to a change in the resistance and dielectric behavior of LN, which is also related to the variation of band gap with pressure.
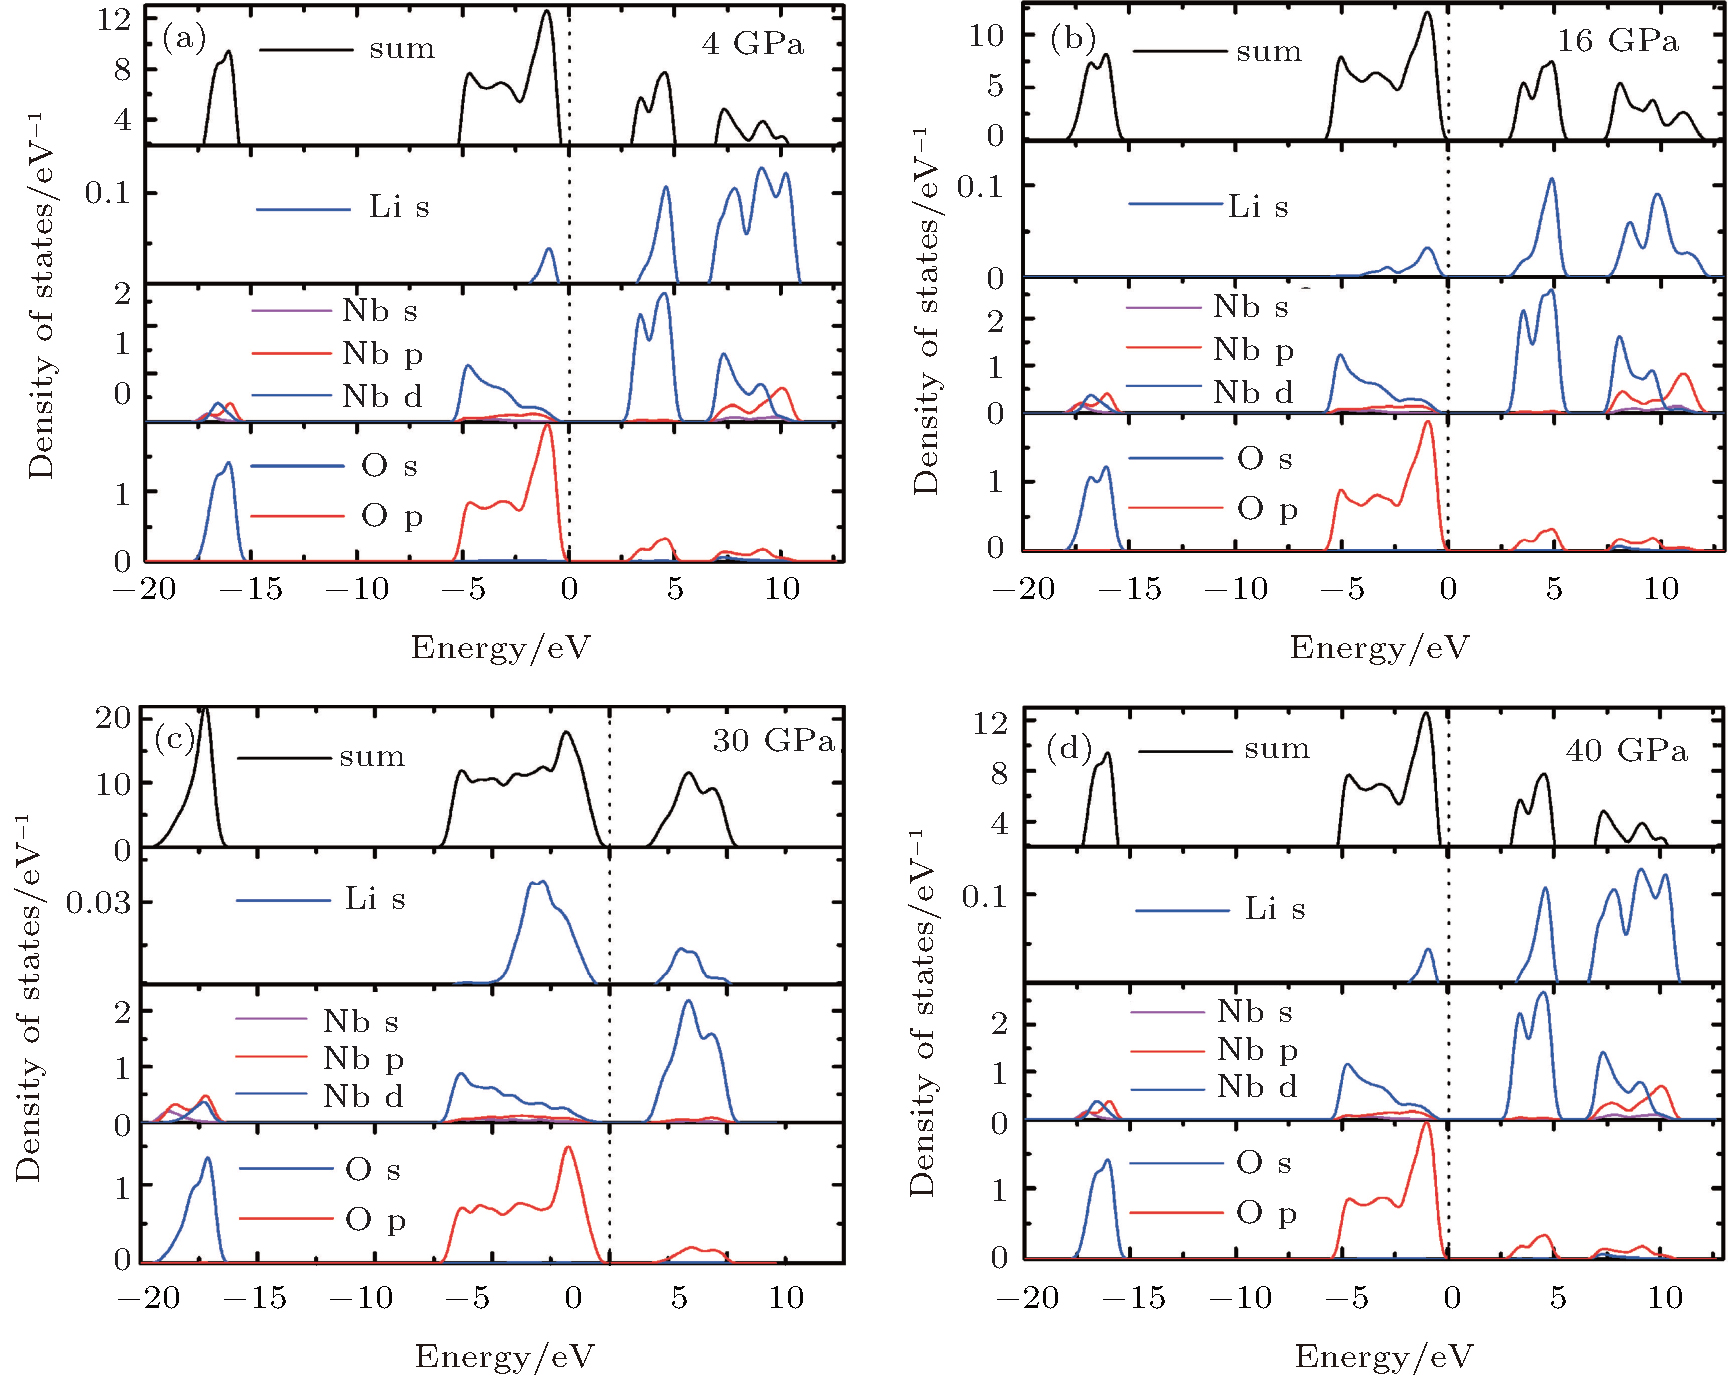 | Fig. 5. Calculated partial DOS at 4 GPa (a) and 16 GPa (b) for R3c phase, and at 30 GPa (c) and 40 GPa (d) for Pnma phase, respectively. |
 | Fig. 6. Calculated difference charge density maps through the Nb and O atoms at 30 GPa (a) and 40 GPa (b) for Pnma phase. The purple, red, and cyan balls denote the Li, O, and Nb atoms, respectively. |
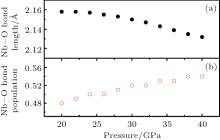
The compressibility of LN is thought to be related to the compressibility of the bond. Therefore, we have investigated the charge and chemical bonding of Pnma phase using a detailed Mulliken population analysis. The bond populations indicate the overlap degree of the electron cloud of two bonding atoms and can be used to access the covalent or ionic nature of a chemical bond. For the bond populations, the lowest and highest values imply that the chemical bond exhibits strong iconicity and covalency, respectively.[19] The changes in the average Nb– O bond length and the bond population is shown in Fig. 7. As pressure increases, the average Nb– O bond length decreases while the Nb– O bond population increases as the pressure increases, indicating the increased covalent character between Nb and O atoms under high pressure at the Pnma phase. The increase of the Nb– O interactions under high pressure leads to the increase of hybridization between O 2p and Nb 4d orbitals at the Pnma phase.
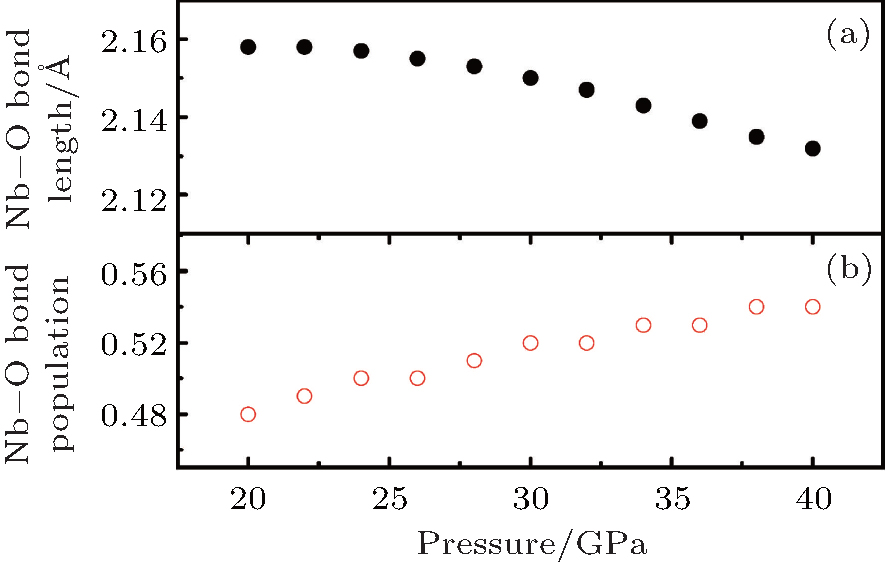 | Fig. 7. Nb– O bond length (a) and bond population (b) change as a function of pressure. |
The optical properties are important for this compound because it can find potential applications in photoelectron devices and in the semiconductor industry. For the structures observed in the optical spectra, we consider transitions from occupied to unoccupied bands in the electronic energy band structure at high symmetry points in the Brillouin zone.[20] The optical properties are studied by dielectric function, which describes the features of linear response of the system to an electromagnetic radiation and governs the propagation behavior of radiation in a medium.[19] This is related to the interaction of photons with electrons. The imaginary part of dielectric function ε 2(ω ) can be calculated by the momentum matrix elements between the occupied and unoccupied wave functions within the selection rules, and the real part ε 1(ω ) can be evaluated by applying the Kramer– Kronig relationship. The refractive index, electron energy-loss function, and reflectivity can be deduced from the dielectric function.[21]
Figure 8 shows the calculated ε 1(ω ) and ε 2(ω ) of the dielectric function, refractive index n(ω ), extinction coefficient k(ω ), energy loss function, reflectivity of LN at 0 GPa and 16 GPa of R3c phase, and 30 GPa and 40 GPa of Pnma phase, respectively. In the R3c phase, two main peaks in the ε 1(ω ) spectra are located at about 3.7 and 7.7 eV. The ε 1(ω ) at the zero frequency limit is the static dielectric constant ε 1(0), which is related to the reflective index measured at a frequency above the lattice vibration frequencies. The calculated values of ε 1(0) are 4.7, 5.0 at 0 and 16 GPa, and 5.7 and 6.0 at 30 and 40 GPa in the R3c and Pnma phases, respectively. In the R3c phase, there are two main peaks in the ε 2(ω ) around 4.8 and 9.1 eV. The peak at 4.8 eV mainly originates from the optical transitions between O 2p and Nb 4d states, while the peak at 9.1 eV is due to the optical transitions between Li 2s and Nb 4d states. As pressure increases, the ε 2(ω ) peaks shift to the high-energy region, which can be attributed to the broadening of the bandgap under pressure. For the Pnma phase, the ε 2(ω ) peak at 5.0 eV is related to the optical transition between O 2p and Nb 4d states.
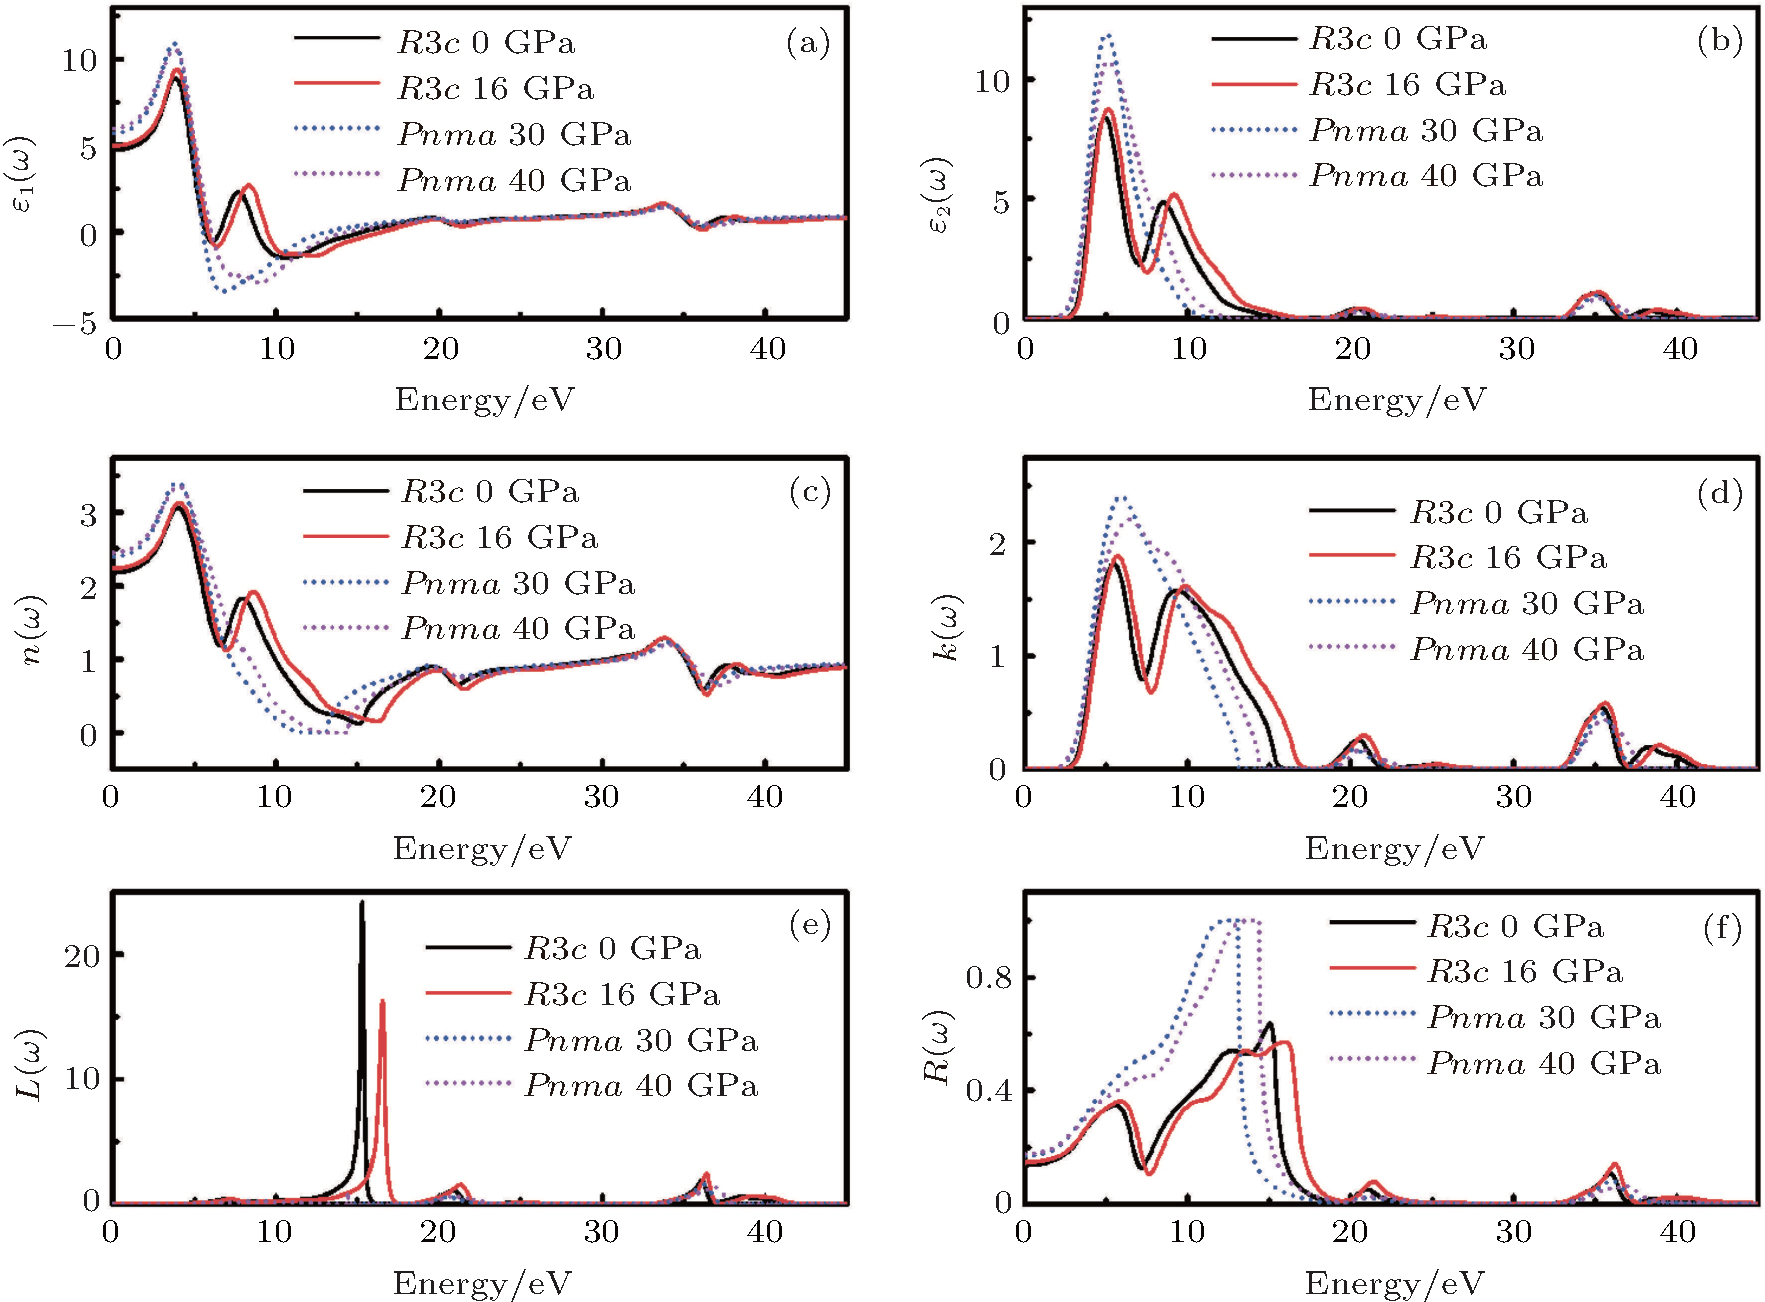 | Fig. 8. (a) Real part of dielectric function ε 1(ω ); (b) imaginary part of dielectric function ε 2(ω ); (c) refractive index n(ω ); (d) extinction coefficient k(ω ); (e) energy loss function and (f) reflectivity of LN at (0 and 16 GPa) for the R3c phase, and (30 and 40 GPa) for the Pnma phase, respectively. |
The refractive index n(ω ) and the extinction coefficient k(ω ) have also been calculated for R3c phase under 0 and 16 GPa, and the Pnma phase under 30 and 40 GPa, as displayed in Figs. 8(c) and 8(d), respectively. For the R3c phase at ambient pressure, the static refractive index is n0 = 2.2. Moreover, n0 of both R3c and Pnma increases as the pressure increases. The k(ω ) shows two main peaks at around 5.6 and 9.2 eV at 0 GPa and one main peak at 5.7 eV at 30 GPa, respectively. Both the refractive index and the extinction coefficient shift toward the higher-energy region as pressure increases. The values of some optical parameters were compared with the existing experimental data, [22] as shown in Table 1, the error was less than 10%.
| Table 1. Calculated and experimental optical properties of LN at ambient conditions. |
Energy-loss function L(ω ) is an important optical factor, which indicates the energy-loss of a fast electron traversing in the material.[23] The peaks in L(ω ) spectra represent the characteristic associated with the plasma resonance and the corresponding energy is the plasma energy. As shown in Fig. 8(e), the calculated plasma energies are (15.3 and 16.5 eV) and (36.2 and 36.9 eV) for the R3c phase at (0 and 16 GPa) and the Pnma phase at (30 and 40 GPa), respectively. The plasma energy increases as pressure increases in both phases. The peaks of L(ω ) correspond to the trailing edges in the reflection spectra, as displayed in Fig. 8(f). The maximum reflectivity values are (64% and 57%) at (0 and 16 GPa) for the R3c phase occurred at (14.9 and 16.1 eV), while for the Pnma phase, the maximum reflectivity values are located at around 13.0 eV.
A detailed investigation of the structural, electronic, and optical properties of LN under high pressure has been performed using first-principles plane-wave pesudopotential calculations. Our calculations show that LN undergoes a phase transition from R3c to Pnma structure at about 18.7 GPa. There are mainly covalent interactions along Nb– O bond in both phases. As pressure increases, the charge distribution transfer happens from Nb5+ ion to O2− ion in the Pnma phase, which causes an enhancement in electron localization around O atoms. The optical properties (such as the dielectric function, the refractive index, the extinction coefficient, the electron energy loss, and the reflectivity) were calculated under pressure, which were explained in terms of the computed electronic structure.
| 1 |
|
| 2 |
|
| 3 |
|
| 4 |
|
| 5 |
|
| 6 |
|
| 7 |
|
| 8 |
|
| 9 |
|
| 10 |
|
| 11 |
|
| 12 |
|
| 13 |
|
| 14 |
|
| 15 |
|
| 16 |
|
| 17 |
|
| 18 |
|
| 19 |
|
| 20 |
|
| 21 |
|
| 22 |
|
| 23 |
|