†Corresponding author. E-mail: tswang@lzu.edu.cn
*Project supported by the Fundamental Research Funds for the Central Universities of China (Grant No. lzujbky-2014-16).
To study the room-temperature stable defects induced by electron irradiation, commercial borosilicate glasses were irradiated by 1.2 MeV electrons and then ultraviolet (UV) optical absorption (OA) spectra were measured. Two characteristic bands were revealed before irradiation, and they were attributed to silicon dangling bond (E’-center) and Fe3+ species, respectively. The existence of Fe3+ was confirmed by electron paramagnetic resonance (EPR) measurements. After irradiation, the absorption spectra revealed irradiation-induced changes, while the content of E’-center did not change in the deep ultraviolet (DUV) region. The slightly reduced OA spectra at 4.9 eV was supposed to transform Fe3+ species to Fe2+ species and this transformation leads to the appearance of 4.3 eV OA band. By calculating intensity variation, the transformation of Fe was estimated to be about 5% and the optical absorption cross section of Fe2+ species is calculated to be 2.2 times larger than that of Fe3+ species. Peroxy linkage (POL, ≡Si–O–O–Si≡), which results in a 3.7 eV OA band, is speculated not to be from Si–O bond break but from Si–O–B bond, Si–O–Al bond, or Si–O–Na bond break. The co-presence defect with POL is probably responsible for 2.9-eV OA band.
Amorphous glassy material has been widely used in various fields due to its superior properties.[1] Currently, borosilicate glass is the preferred solidification material of high-level radioactive waste. However, impurities and point defects, which originally exist or are created by irradiation, are the main limits to practically achievable transparency and usually have negative effects on amorphous glassy material applications. The stabilities of different defects are diverse at room temperature, for example, time decay of irradiation-induced nonbridging oxygen hole centers (NBOHC) occurs in ∼ 10 μ s.[2, 3] The impact of point defects on glass application is different and the application of amorphous glassy material is determined by the stable defects. Studying these defects, which are stable at room temperature after electron irradiation, has great meaning to glass application in electron irradiation environment.
Point defect in borosilicate glass has been widely studied, including its microstructure, OA band, and absorption cross section, by spectrophotometer, photoluminescence (PL), and EPR. Various defects can coexist in amorphous glass and cause diverse OA bands. The two OA bands located at 5.8 eV and 4.8 eV for deep ultraviolet (DUV) and ultraviolet (UV) were studied.[4] In 1998, Skuja[5] proposed that the 5.8-eV OA band was caused by paramagnetic silicon dangling bonds (E’ -centers) (≡ Si· · · (Si≡ )), which was regarded as the most extensively studied defect of all intrinsic defects in SiO2. The 4.8-eV OA band is caused by NBOHC (≡ Si– O· ), which is one of the fundamental defects in amorphous glass. Apart from the 4.8-eV OA band, NBOHC has another characteristic OA band at 2.0 eV, but this band is weak and narrow.[6] In addition, POL is another common defect. Sakurai and Nagasawa studied the correlation between the 1.5-eV PL band and POL structure. Their results showed that the 3.8-eV absorption band was more likely due to POL.[7, 8] Through the raw materials and melting techniques, iron is introduced into multicomponent glass.[9, 10] The iron exists as Fe3+ or Fe2+ , [11, 12] and can be detected by Raman and EPR despite that the trace iron impurity is less than 1 ppm.[13] Fe3+ ions were generally found to have EPR peaks at g ≈ 4.3.[14, 15] During electron irradiation, electron trapping process occurs according to the following reaction: Fe3+ + e− → Fe2+ .[14]
During electron irradiation, both the structure and properties of borosilicate glass will be changed. In this paper, the optical absorption spectra of borosilicate glasses were studied. Intrinsic defects were investigated and radiation-induced defects were considered in more detail. The transformations of room-temperature stable defects were obtained after electron irradiation.
Borosilicate glass samples were supplied by Nantong Zhenhua Optical-Electric Co., LTD. The glass was melted at 1250 ° C and annealed at 560 ° C. The density of sample is 2.23 g/cm3 and its chemical composition is displayed in Table 1. Boron atom is introduced to reduce the melting temperature. The glass samples are 10 mm in square with a thickness of 1 mm and have both surfaces optically polished. The electron irradiation was carried out in the Institute of Modern Physics. All samples were irradiated with 1.2-MeV electrons at room temperature. The range of 1.2-MeV electrons in borosilicate glass is estimated to be 1.94 mm, and the beam current is 15 mA. During electron irradiation, samples were cooled by water. The irradiation doses were in the range from 1 × 10⁵ Gy to 1 × 10⁷ Gy. Optical absorption spectra were measured by UV2800PC UV– VIS spectrophotometer. The wavelength was ranged from 190 nm to 800 nm (6.5 eV to 1.6 eV) and the resolution was about 1 nm. The EPR spectra were performed with a JES-FA300 type spectroscopy (ν ≈ 9.0 GHz).
| Table 1. Chemical composition of the borosilicate glass (wt%). |
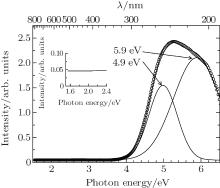
The VIS– DUV optical absorption spectrum of pristine borosilicate glass is shown in hollow circle line in Fig. 1. It reveals strong absorption in the UV– DUV range (4– 6.5 eV), but no absorption in visible range. To examine the spectra in detail, Gaussian peaks are used to fit the optical absorption spectrum. Both position and number of Gaussian peak are not preset. The fitting result suggested that the sample has two distinct OA bands at 4.9 eV and 5.9 eV, with full width at half maximums (FWHM) of 0.9 eV and 1.1 eV, respectively.
The 4.9-eV OA band has two causes. Basic raw material used to produce ordinary glass has a small amount of iron impurity which exists mainly as Fe3+ species in glass melted under ambient condition.[16] Some researchers suggested that Fe3+ species lead to UV absorption band between 4.8– 5.2 eV.[16] This factor was the primary reason for 4.9-eV OA band. EPR spectrum of pristine glass demonstrated the existence of Fe3+ ions, as shown in Fig. 2. Another defect observed at g = 2.1648 may correspond to boron tetrahedron.
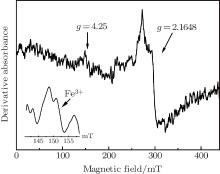 | Fig. 2. EPR spectrum of pristine borosilicate glass. The inset shows a more detail exhibition of Fe3+ related absorbance at g = 4.25. |
The other cause for 4.9-eV OA band was attributed to NBOHC. According to Pacchioni’ s work, NBOHC in SiO2 glass had two absorption bands, which were located at 1.97 eV (FWHM= 0.17 eV) and 4.8 eV (FWHM= 1.07 eV).[6] Although the accompanying OA band at 2.0 eV does not appear (the inset in Fig. 1), NBOHC could not be eliminated. Because the amplitude of 2.0-eV OA band is about ∼ 500 times lower than that of 4.9-eV OA band in the spectrum of NBOHC[4] and this form of defect usually existed as intrinsic defect at glass material. The glass consists of sodium, which transformed NBOHC to Si– O– Na bond. Hence, the NBOHC content is low. The strong 5.9-eV OA band was unexceptionally attributed to the omnipresent defect of E’ -center. Apart from Fe3+ species and E’ -centers, no other point defects were detected in the optical absorption spectrum of pristine sample.
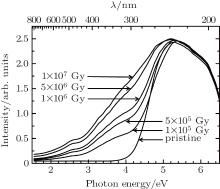
The VIS– DUV optical absorption spectra of pristine and electron irradiated samples are presented in Fig. 3. The pristine borosilicate glass sample has strong UV and DUV absorption bands. After electron irradiation, the absorption intensity has slight change in the DUV region. However, it shows increase in the intensities of the VIS– UV range and the increase is more obvious in the UV region. Stable defects were proposed to be produced after electron irradiation, and the absorption bands due to these defects were assumed to be located in the visible and UV region.
Absorbance is defined by

where I0 and It stand for the intensity of pristine light and transmitted light, K is the absorbing constant, and d is the thickness of glass. Assuming that all the glass samples have the same thickness, the background subtracted absorption spectrum can be derived through subtracting the absorbance of pristine sample from the absorbance of electron irradiated sample. The background subtraction procedures are expressed as

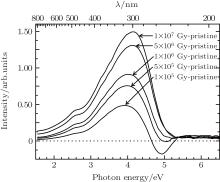
The background subtracted absorption spectrum shows changes between pristine sample and electron irradiated sample. As shown in Fig. 4, the absorption monotonically increases with electron irradiation dose in the visible and UV region and have no obvious change in the DUV region. The background subtracted absorption spectrum of 1 × 10⁵ Gy electron-irradiated sample (1 × 10⁵ Gy - pristine, Fig. 4) distinctly indicates a negative absorption at 4.9-eV OA band, which is swamped by the increase absorption in the UV region at higher dose. Compared with absorption spectra, the background subtracted absorption spectra could directly and obviously show both the increase absorption in the VIS– UV region and the negative absorption at 4.9-eV OA band at 1 × 10⁵ Gy. In addition, there is no apparent change in the DUV region.
As shown in Figs. 3 and 4, the 5.9-eV OA band, which belongs to DUV region, has no change after electron irradiation. The unchanged concentration of E’ -center was required to explain the invariant shape of OA spectra. E’ -center has been studied for a long time[17] and is discovered in most of irradiated glass samples. It was widely accepted that electron irradiation did not lead to the formation of E’ -center.
The absorption at 4.9-eV OA band is negative at 1 × 10⁵ Gy background subtracted absorption spectrum (1 × 10⁵ Gy - pristine, Fig. 4), while this negative absorption band gradually vanishes because it is covered by the increasing intensity in the UV region with higher irradiation dose. There are plenty of Si– O bands in glass network, and a Si– O band can break up into a E’ -center and a NBOHC[18]


The unchanged concentration of E’ -center indirectly demonstrates no increase concentration of co-presence of NBOHC. Therefore, positive 4.9-eV OA band resulted from NBOHC at background subtracted absorption spectrum is not observed. Considering the 4.9-eV OA band at pristine sample, the main reason of this negative absorption band may be the transformation of Fe3+ species and the secondary possible reason may be the decrease of NBOHC after electron irradiation. The transformation progress mainly happens at low dose, because the negative absorption at 4.9-eV OA band does not exist under higher dose at background subtracted absorption spectra. The peak area of 4.9-eV fitting band of pristine sample (Fig. 1) is 1.27 and this absolute value of the negative absorption band at 1 × 10⁵ Gy background subtracted absorption spectrum (1 × 10⁵ Gy - pristine, Fig. 4) is 0.069, which can be roughly estimated that 1 × 10⁵ Gy electron irradiation causes about 5% decrease of the 4.9-eV OA band. This indicates only small part of Fe3+ species transformation to other structure after electron irradiation. In other words, E’ -center and Fe3+ species, which exist at pristine sample, are stable at room temperature after electron irradiation.
Electron irradiation has strong impact on the visible and UV absorption spectra of borosilicate glass, which seriously affects the application of borosilicate glass at room temperature in electron irradiation environment. Analysis of the VIS– UV part of background subtracted absorption is complicated. The absorption has complex shape in this region, which indicates that it contains several absorption bands. To get quantitative structural groups information from these absorption spectra, each background subtracted absorption spectrum is fitted by three Gaussian peaks in the VIS– UV region. The fitting result of background subtracted absorption spectrum for the 5 × 10⁵ Gy electron irradiation is shown in Fig. 5. Figure 6 shows the intensities of the three peaks as a function of irradiation dose.
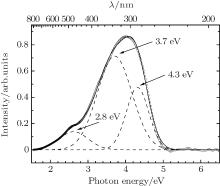 | Fig. 5. Background subtracted absorption spectrum of 5 × 10⁵ Gy glass (hollow circles), fitted by three Gaussian peaks (dash lines) with centers at 2.8, 3.7, and 4.3 eV. |
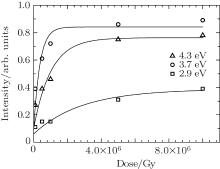 | Fig. 6. Intensities of the three Gaussian peaks, fitting at background subtracted absorption spectra. |
The fitting results indicate that the background subtracted absorption spectrum contains three OA bands, and they are centered at 2.9, 3.7, and 4.3 eV in visible and UV regions. The FWHMs of these three peaks are 1.1, 1.0, and 0.6 eV, respectively. The intensities of 2.9-, 3.7-, and 4.3-eV OA bands increase after electron irradiation, which indicates that the permanent damages to borosilicate glass were caused by electron irradiation.
As shown in Fig. 6, the intensities of three Gaussian peaks were monotonously increased with dose. The 3.7- and 4.3-eV OA bands increase rapidly at low dose and reach saturation beyond 1.5 × 10⁶ and 4 × 10⁶ Gy. However, the 2.9-eV OA band increases slowly and no saturation at maximum dose (107 Gy) is observed.
Bartall et al. suggested that Fe3+ ions were transformed into Fe2+ ions and {Fe3+ }− species by electron capture. {Fe3+ }− species might be responsible for the absorption band at 4.14 eV (300 nm).[19] Taking the reasons of negative absorption at 4.9-eV OA band in this work into account, the experimental results indicate that the new induced band at about 4.3 eV by electron irradiation is caused by Fe2+ species. A small portion of Fe3+ species, presented in samples as impurities, is transformed to Fe2+ species after electron irradiation. This transformation is irreversible at room temperature. In terms of stoichiometry, the formation of a Fe2+ specie is equivalent to the vanishment of one Fe3+ species. Because the peak area of 4.3-eV fitting band of 1 × 10⁵ Gy background subtracted absorption spectrum is 0.155 and the absolute value of the negative absorption band (Fig. 4) is 0.069, the OA cross section of Fe2+ species is roughly estimated to be about 2.2 times larger than that of Fe3+ species.
The intensity of 3.7-eV OA band increases monotonously with electron dose, which is attributed to POL. The common silicon oxygen structure defects of oxygen deficiency have no change. Therefore, the redundant oxygen at POL unlikely results from Si– O bond. As a corollary, the source of redundant oxygen in POL may come from the omnipresence of defect precursors in strained Si– O– B bond, Si– O– Al bond, or Si– O– Na bond. This uncertainty is an obstacle to further understand the process of defect generation. The 2.9-eV OA band has different variation law compared with the 3.7- and 4.3-eV OA bands. Further studies are needed to characterize its structure.
Except the main defects mentioned above, several known oxygen-related defects, such as surface center, silanone group = Si= O (oxygen double bond), [16] also have slight influence on the optical absorption spectra in the bulk borosilicate glass. During electron irradiation, sodium migration occurs on the surface.[20– 22] Therefore, the proposed reason of silanone group generation is the break of Si– O– Na bond

In terms of chemical bond, a silanone group is an equivalent of one sodium atom and one NBOHC. Sodium atom, released by the reaction (5), migrates off the surface during irradiation. The movement of sodium atom is driven by electrostatic field, which is induced by the emission of secondary electrons.[23, 24] The peroxy linkage ≡ Si– O– O– Si≡ , is envisioned to be half of a Frenkel pair, with the other half being the oxygen vacancy ≡ Si– Si≡ .[25] Apparently, this peroxy linkage precursor readily shed an electron to form a peroxy radical ≡ Si– O– O, which could cause strong absorption in the EPR spectra near g = 2.0064, with unpaired electrons.[5, 25] In this work, the presence of peroxy radical is confirmed by the EPR spectra of irradiated glasses, as shown in Fig. 7. In addition, the intensity is directly proportional to the irradiation dose.
The OA spectrum of pristine sample reveals two characteristic OA bands in the UV and DUV regions and no absorption in the visible region. The 5.9-eV OA band is attributed to E’ center. Different from previous studies, the 4.9-eV OA band is mainly linked to Fe3+ species rather than NBOHC in this work. The existence of Fe3+ is confirmed by EPR measurements. After electron irradiation, the absorption spectra reveals stable irradiation-induced changes, while the content of E’ center has no change. A small portion of Fe3+ species transforms to Fe2+ species and this transformation leads to the 4.3-eV OA band. Using intensity variation, the transformation of Fe is roughly estimated to be only about 5% and the OA cross section of Fe2+ species is about 2.2 times larger than that of Fe3+ species. POL, which is responsible for 3.7-eV OA band, is probably not from Si– O bond break but from Si– O– B bond, Si– O– Al bond, or Si– O– Na bond break. Part of POL turns into peroxy radical, which is confirmed by the EPR spectra.
The authors are thankful to the Instrumental Analysis Research Center, Lanzhou University. The HVTT electron accelerator group in Institute of Modern Physics, Lanzhou, Chinese Academy of Sciences, is also acknowledged for providing technical supports.
| 1 |
|
| 2 |
|
| 3 |
|
| 4 |
|
| 5 |
|
| 6 |
|
| 7 |
|
| 8 |
|
| 9 |
|
| 10 |
|
| 11 |
|
| 12 |
|
| 13 |
|
| 14 |
|
| 15 |
|
| 16 |
|
| 17 |
|
| 18 |
|
| 19 |
|
| 20 |
|
| 21 |
|
| 22 |
|
| 23 |
|
| 24 |
|
| 25 |
|


