


Using a Mach–Zehnder interferometer to deduce nitrogen density mapping
[Boudaoud F.† , Lemerini M.]
, Lemerini M.]
|
|


†Corresponding author. E-mail: fethiaboudaoud@yahoo.fr
This work presents an optical method using the Mach–Zehnder interferometer. We especially diagnose a pure nitrogen gas subjected to a point to plane corona discharge, and visualize the density spatial map. The interelectrode distance equals 6 mm and the variation of the optical path has been measured at different pressures: 220 Torr, 400 Torr, and 760 Torr. The interferograms are recorded with a CCD camera, and the numerical analysis of these interferograms is assured by the inverse Abel transformation. The nitrogen density is extracted through the Gladstone–Dale relation. The obtained results are in close agreement with values available in the literature.
All interferometric methods are based on the interference pattern formed by the superposition of light waves which originate from the same coherent source but traverse different paths. So the fringe pattern formed by these beams indicates the local phase shifts arising from the difference in the optical paths traversed by the interfering beams. The most common interferometers are Michelson and Mach– Zehnder ones. Some researchers have measured with interferometry the neutral density profiles of cylindrical gas jets in a wide range of voltage support. The sensitivity of this diagnosis and the mathematical processing of the data allow us to measure the neutral density of a gas jet.[1, 2] There are also some other optical methods based on holographic interferometry using reference hologram and reference fringes.[3, 4]
Rabat and de Izarra used an interferometric method to deduce the temperature of the rotational plane free OH radical in 2004. The temperature was extracted from an interferogram via a phase shift introduced by the refractive index in the medium investigated. The refractive index is related to the temperature by the Dale– Gladstone equation and the ideal gas law.[5]
Recently, many advanced optical methods have been developed to measure the temperature of such an object. Lee et al. in 2012 used fiber optic interferometers to sense various physical parameters including strain, temperature, pressure, and refractive index. They presented in detail some specific examples of interferometeric sensor technologies and showed their large potential in practical applications.[6] Lu et al. in 2009 achieved the simultaneous measurement of the refractive index and the temperature by using a Mach– Zehnder interferometer. They showed that the wavelength of the peak attenuation of interference with the specific sequence in the transmission spectrum changes with the variations in the refractive index of the environment and the temperature.[7]
On the other hand, the use of the corona discharge with the Mach– Zehnder interferometer is very interesting for understanding the phenomenon between ion gas and neutral gas. The study of this phenomenon is based on the experimental configuration point to plane under high voltage. From this perspective, Lemerini et al. in 2009 and Ferouani et al. in 2010 studied the effect of negative-corona discharge on the dynamics of nitrogen gas. They showed that the transfer of energy plays an important role in the evolution of neutral particles.[8, 9]
In this paper, we determine the mapping of the density of nitrogen gaseous subjected to a stationary corona discharge by using a Mach– Zehnder interferometer, which has the advantages of being highly stable, insensitive to vibrations, and simple to use.
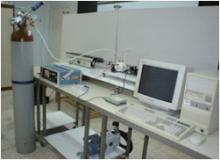
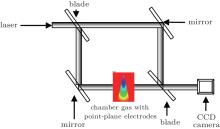
Figure 1 shows the complete experimental setup, including the He– Ne laser source, the PC control unit, the interferometer, the N2 source cylinder, and the generator. Figure 2 shows a schematic of the Mach– Zehnder interferometer used in this study.
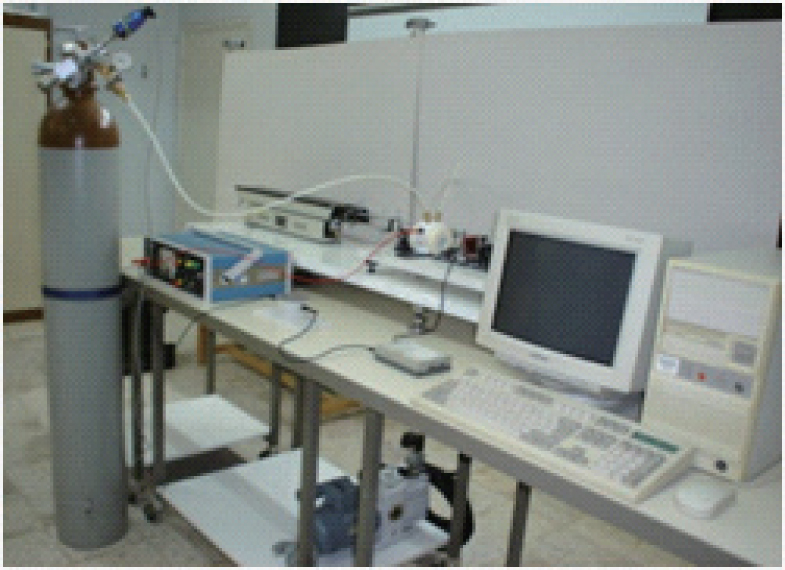 | Fig. 1. Overall picture of the Mach– Zehnder interferometer set up. |
 | Fig. 2. Configuration of the Mach– Zehnder interferometer system. |
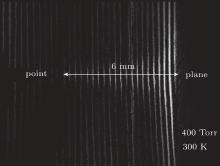
The device is an optical system with a division of amplitude. The discharge system consists of two electrodes, a tip and a plane made of stainless steel. The radius of curvature of the tip equals 150 μ m and the diameter of the plane is 25 mm. The distance between the electrodes is 6 mm.
A red He– Ne laser beam (0.6328 μ m, 10 mA) is expanded (about 6 mm in diameter) with a collimator and then split into two beams in the Mach– Zehnder interferometer with a blade separator. A spatial filter is used at the output of the laser to obtain a filtered beam which is clean and very close to a plane wave. We also ensure that the two beams obtained are strictly identical in width and intensity. One of these beams, the object beam, will pass through the discharge, while the other, the reference beam, will not undergo any disturbance. These two rays of light have the same optical path when the discharge does not occur. So they will interfere and form interference fringes after the semi-reflecting mirror on the editing. The fringes are straight and perpendicular to the axis of the discharge. When the object beam passes through the phase shift medium and obtains a change in its phase, it will have a phase delay relative to the reference beam. This delay is visible and measurable by observing the deformation fringes on the interferogram.
The image lag of the gas is recorded with a CCD camera which is placed at the location of the fringes. With this acquisition system, we determine the phase shift with an accuracy of 0.1° , which corresponds to a spatial resolution of 0.1 mm when it is related to the actual dimensions of the discharge. To feed this system, a high-potential generator (30 kV, 0.6 mA) is used. The current-stabilized generator is connected to the point of discharge by the intermediary of a 25 MΩ resistance. Nitrogen gas coming from the N2 source cylinder is measured using a manometer, and the residual pressure in the vacuum chamber is lower than 10− 4 mbar. The initial temperature is kept at 300 K.
In general, the refractive index n of the plasma is the sum of the contributions of different constituents

where pl, a, a* , a+ , and e represent plasma, ground state atom, excited atom, positive ion, and electron, respectively. We can also introduce the density of the i-th species Ni and the corresponding coefficient of refractivity Ki. So the different terms in Eq. (1) can be written as

Finally equation (1) can be written as

When the light wave generated from a coherent light source passes through a corona discharge, the phase information of the light wave varies due to the variation of the refractive index of the discharge. To calculate the density, we must first calculate the refractive index from the Abel inversion[10, 11]
where k(x, y) denotes the phase shifting at position (x, y), λ is the wavelength of the laser used, n(x, y) is the refractive index along the ray path through the discharge, R is the study ray, r is the discharge ray, and x and y are the coordinates of each point. The integration occurs along the path that the object beam follows through the discharge.
Once the refractive index is calculated, we can determine the density of neutral particles by using the Gladstone– Dale relation[12– 14]

with n being the index of refraction of the medium, Nn the density of the neutral particles, ne the density of electrons, and α the degree of ionization. Here Cn, Ci, and Ce are the Gladstone constants and correspond respectively to the populations of neutrals, ions, and electrons.
In a weakly ionized gas, as in the case of the plasma created by the corona discharge, the degree of ionization is small. The detectable minimum electron density of our system is about 1019 electrons per cm3. Forn[15] showed that the electron density is less this minimum during the transition to the arc. Thus, the contribution of the charged particles is negligible. Thus the variation of the optical path is due only to the variation of the density of the neutrals species. The relation of Gladstone– Dale becomes

where ρ is the mass density, and Cg is the Gladstone coefficient, Cg = 2.2610− 4 m3 · kg− 1.
Equation (5) can also be written with wavelength λ , dephasing Δ Φ between the fringes, and length L of the path of the beam inside the disturbed medium

Using Eq. (6), we determine the index of refraction, then calculate the density of neutral particles.
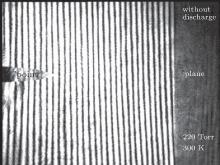
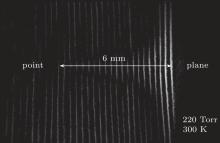
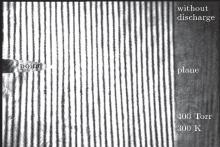
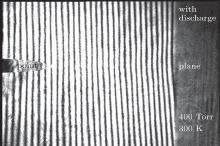
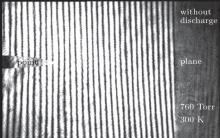
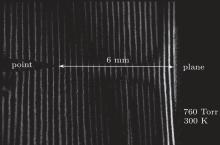
Figures 3– 5 show respectively the interferogram without corona discharge, the interferogram with corona discharge, and the interferometric image which represents the phase shift created when we apply the corona discharge. Then we deduce the spatial distribution of the nitrogen density.
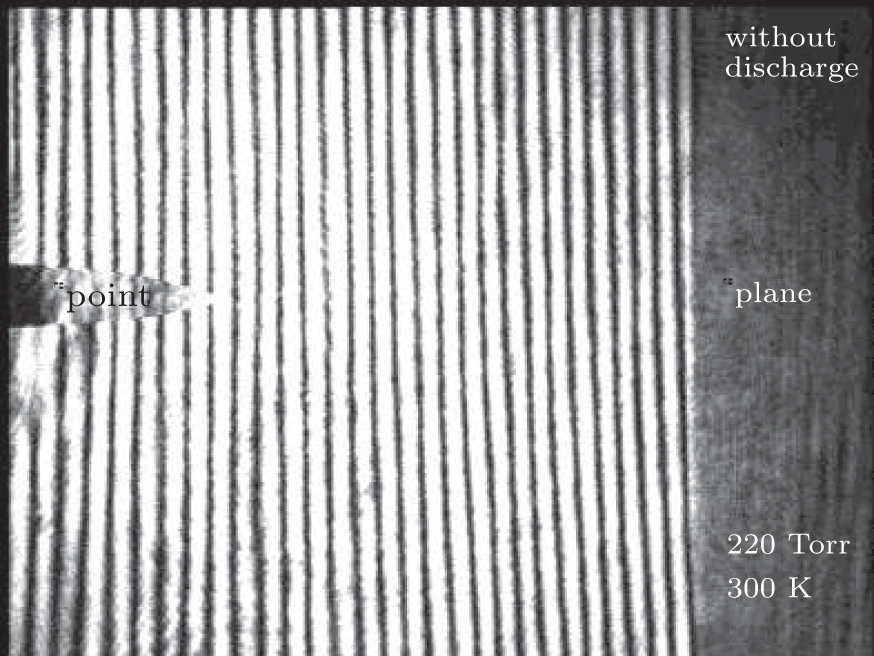 | Fig. 3. Interferometric image without application of DC corona discharge. |
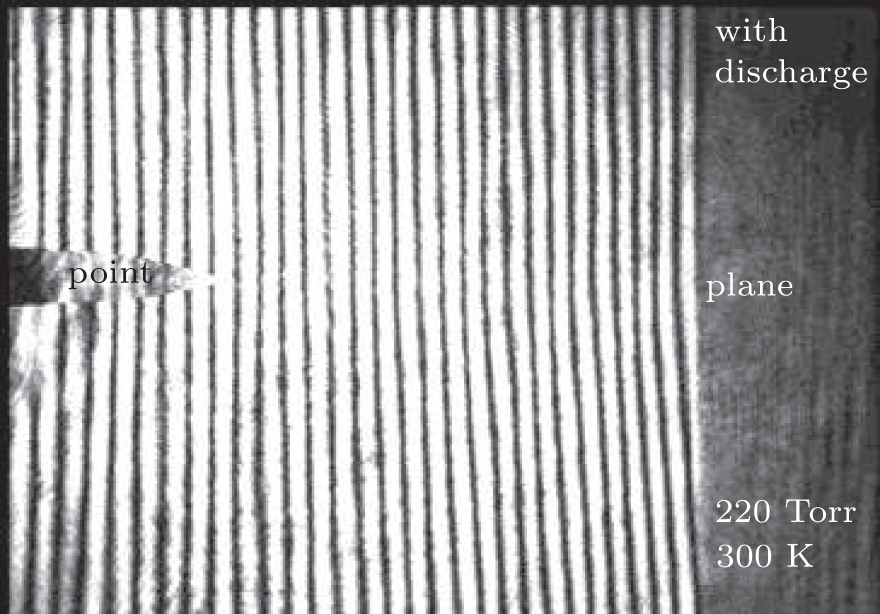 | Fig. 4. Interferometric image with application of DC corona discharge. |
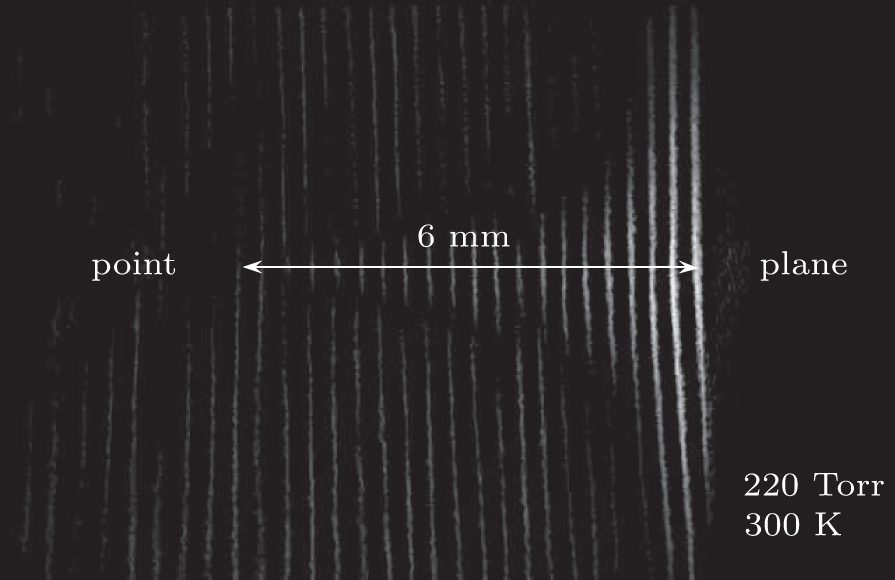 | Fig. 5. Phase shift image of nitrogen gas (220 Torr, 300 K). |
In Fig. 5, we observe the phase difference caused by the application of the discharge in all space, and we note the formation of a cone reducing the discharge area. We also note that the variation is especially important in the vicinity of the plane. Then we apply the inversion Abel to obtain the spatial distribution of the nitrogen density.
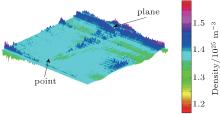
Figure 6 represents the cartography of the nitrogen density subjected to a stationary negative corona discharge at 220 Torr. This image is obtained with a numerical algorithm which is based on the Pearce method, [10] the Abel transformation, and the Gladstone– Dale relation.[11] We observe clearly in this image the effect of the discharge on the neutral particles. We note an average density of 1.4× 1025 m− 3.
 | Fig. 6. Cartography of nitrogen gaseous density at 220 Torr. |
We increase the pressure to 400 Torr, and the results are shown in Figs. 7 (interferogram without corona discharge) and 8 (interferogram with corona discharge). As mentioned previously, we present the image of the phase shift between these two interferograms in Fig. 9. Figure 9 shows the phase difference caused by the application of the discharge. We notice in this figure that the disturbance has increased in the plane with respect to that obtained at 220 Torr.
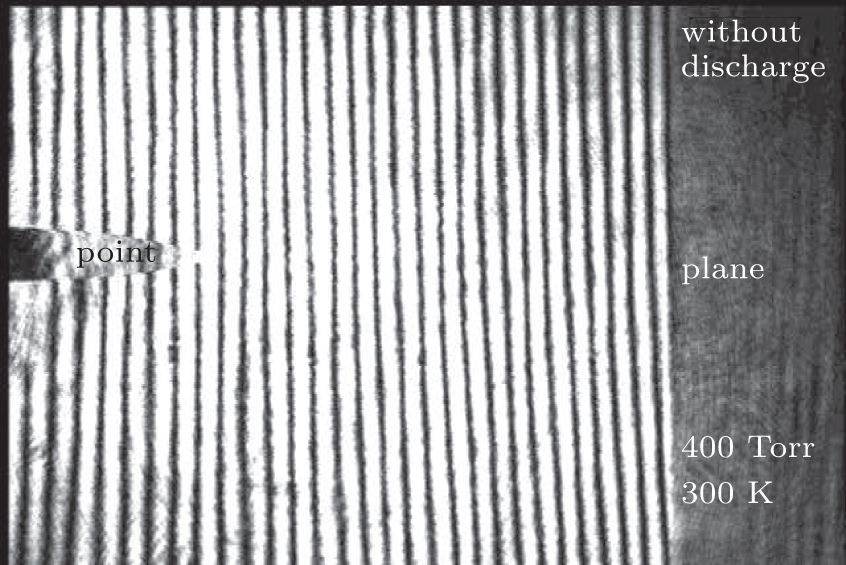 | Fig. 7. Interferometric image without application of DC corona discharge. |
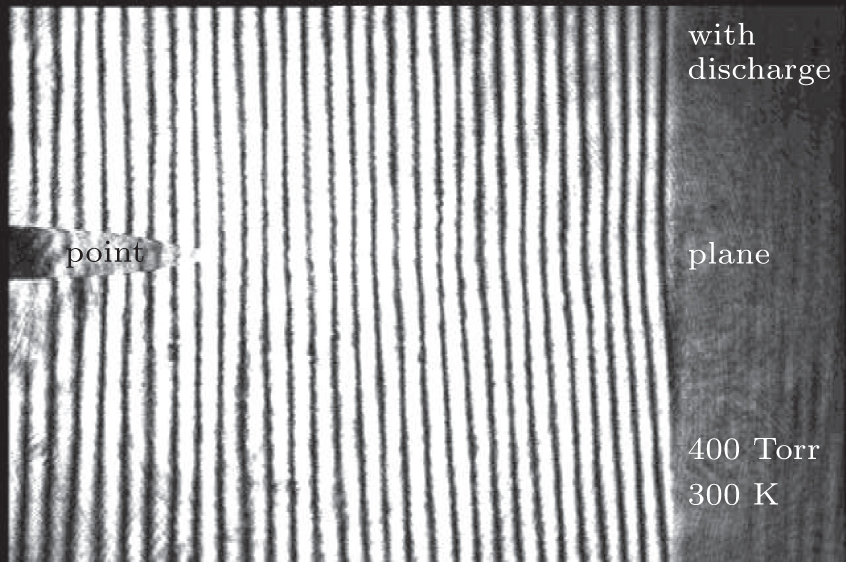 | Fig. 8. Interferometric image with application of DC corona discharge. |
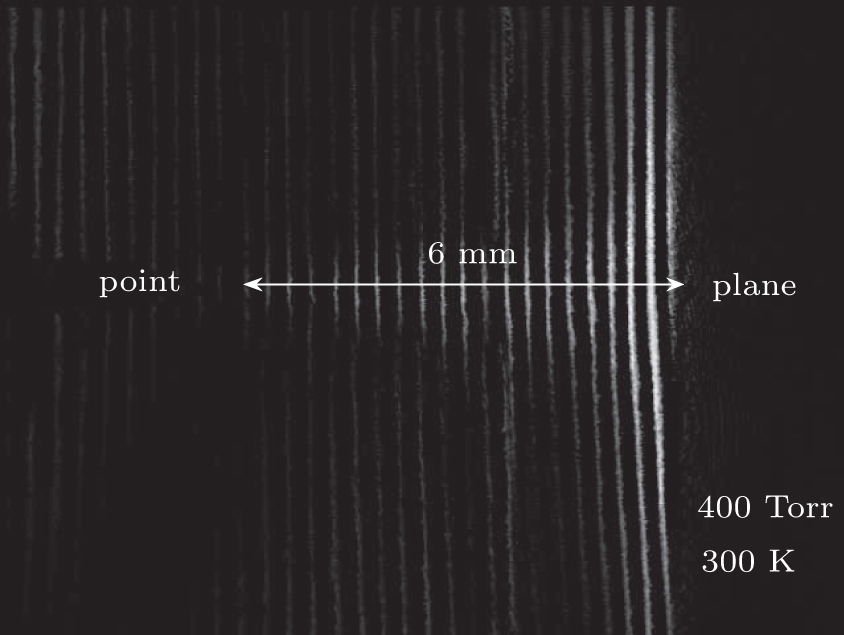 | Fig. 9. Phase shift image of nitrogen gas (400 Torr, 300 K). |
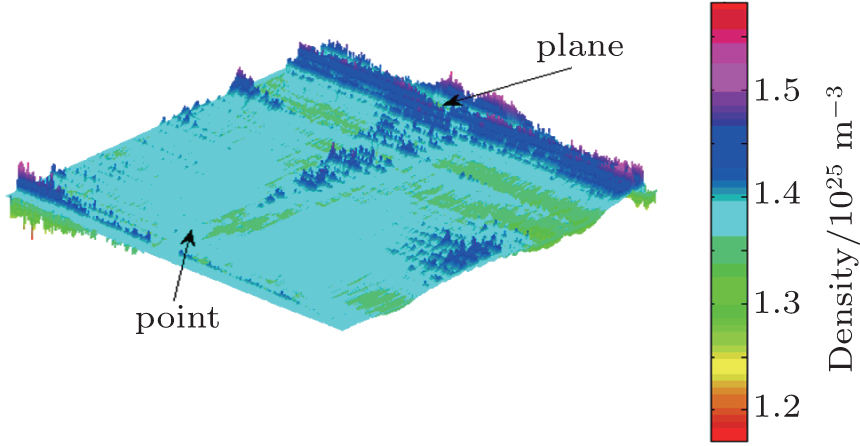
Figure 10 shows the spatial distribution of the nitrogen density subjected to negative corona discharge at 400 Torr. We observe clearly in this image the effect of the discharge on the neutral particles. we note an average density of 2.0× 1025 m− 3.
 | Fig. 10. Map of the density of nitrogen gaseous at 400 Torr. |
Now we fix the pressure at 760 Torr. We obtain the interferograms in Figs. 11 (without the discharge) and 12 (with the discharge). The phase shift between these two interferograms is shown in Fig. 13. We notice the following phenomena in Fig. 13. The neutral particles spread along at the cathode due to the pressure created by the corona discharge. In the vicinity of the point, the neutral particles move, which is absent in the previous cases of 220 Torr and 400 Torr.
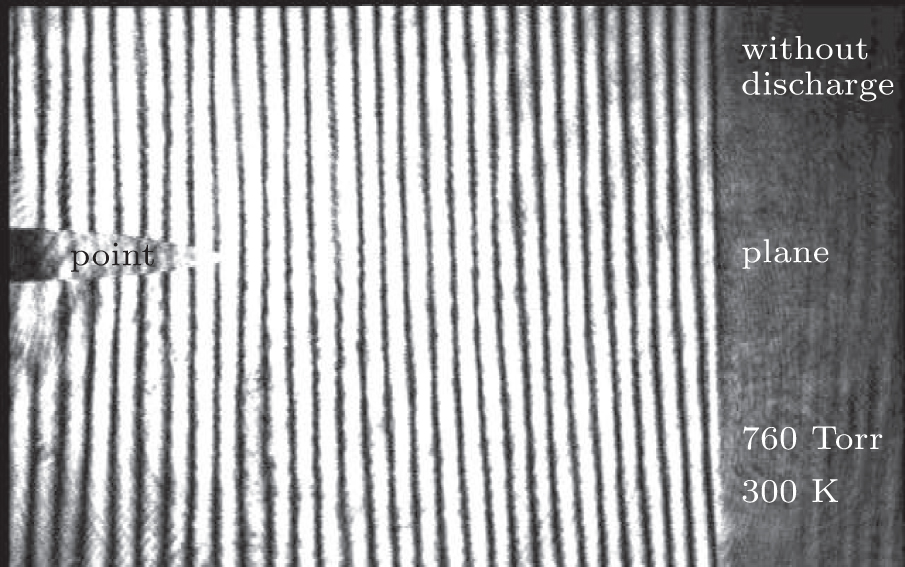 | Fig. 11. Interferometric image without application of DC corona discharge. |
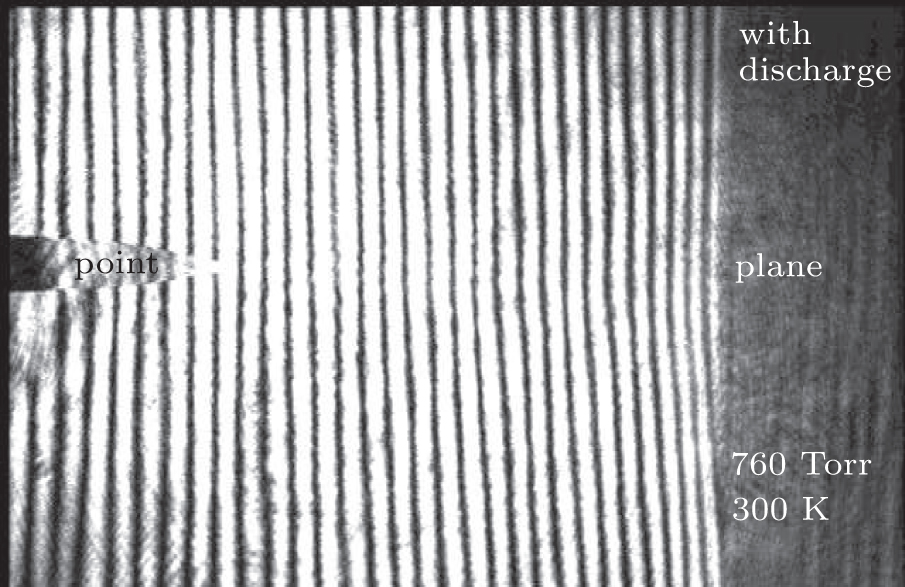 | Fig. 12. Interferometric image with application of DC corona discharge. |
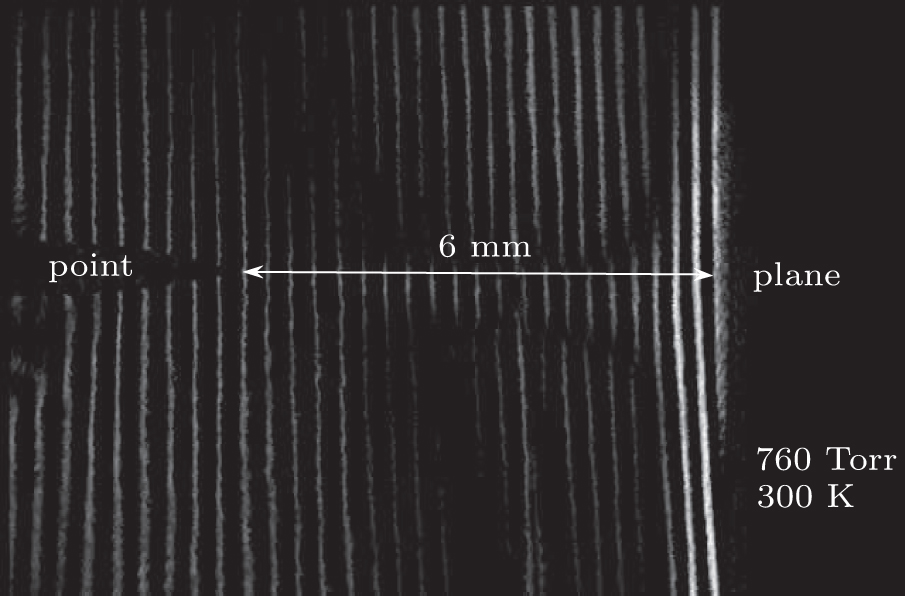 | Fig. 13. Phase shift image of nitrogen gas (760 Torr, 300 K). |
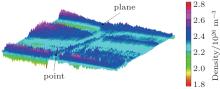
Figure 14 shows the spatial distribution of the nitrogen density at 760 Torr. We note again that the disturbance has significantly increased in almost all space. This is the consequence of the heating neutral which becomes very important due to the energy transfer of the electrons.
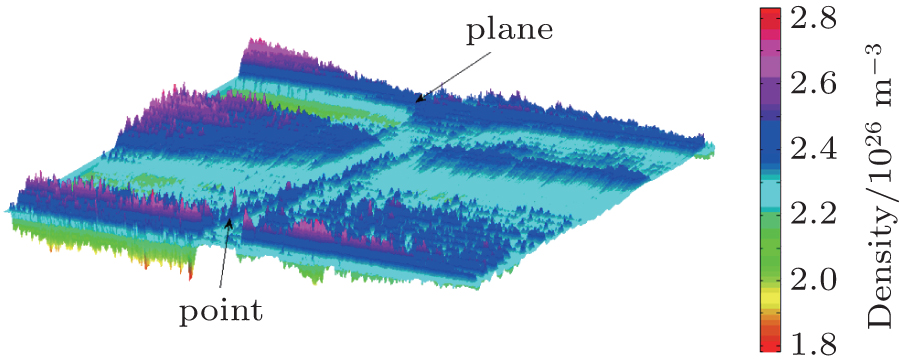 | Fig. 14. Map of density of nitrogen gaseous at 760 Torr. |
Figure 15 shows the axial evolution of the neutral density at three different pressures 220 Torr, 400 Torr, and 760 Torr. When the pressure increases, the neutral movement becomes very important. This variation is caused by the space charge which becomes significant and strongly affects the electric field distribution. We find that the rate of decrease is between 5%– 10% at 220 Torr; 15%– 25% at 400 Torr, and 25%– 45% at 760 Torr.
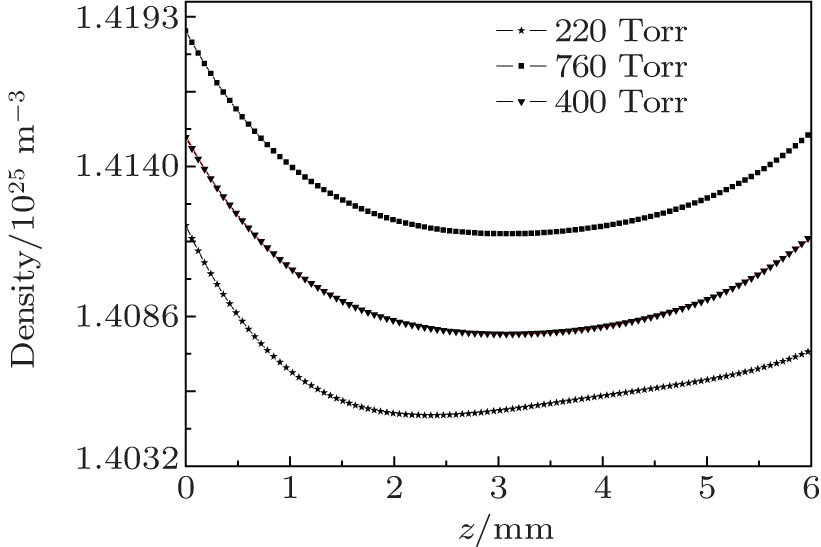 | Fig. 15. Axial evolution of neutral density in negative DC corona discharge at different pressures. |
We present a set of curves in Fig. 16 illustrating the radial distribution of nitrogen density corona discharge at different pressures. We observe the wave propagation generated by the corona discharge. When the electrons are strongly collisional, the neutral gas not only is the source of the charged particles, but also intervenes with the general dynamics of the discharge. We can also note that the external electric field is perturbed by the presence of the space charge which reduces the total distribution of the resultant electric field.
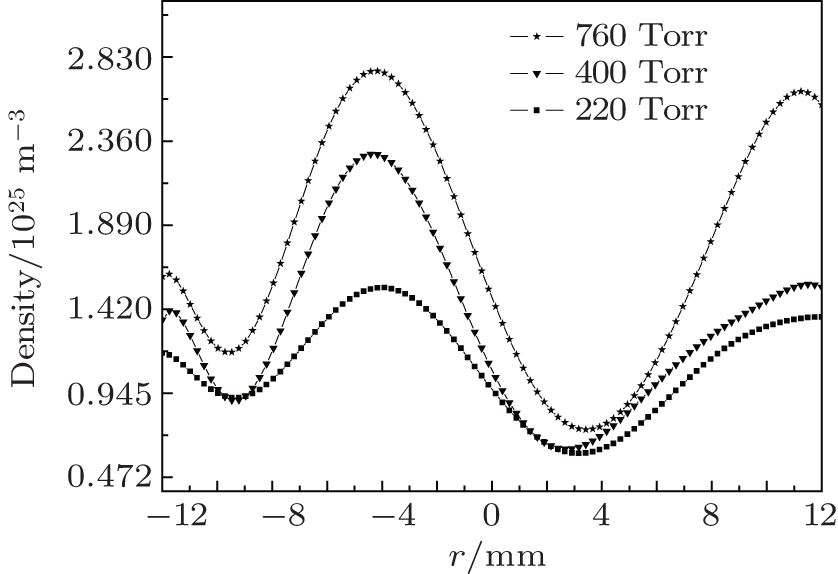 | Fig. 16. Radial profile of neutral density in negative DC corona discharge for various pressures at position z = 3 mm, where z = 0 represent the plane, z = 6 mm represent the point, r = 0 corresponds to the axis discharge, and r = 25 mm corresponds to the diameter of the plane. |
We have demonstrated in this study that we can obtain cartography of the density for any gas subjected to corona discharge with the Mach– Zehnder interferometry. The refractive index and density are key parameters needed for any process control as well as for understanding and modeling. So, our main results can be summarized as follows. (i) The Mach– Zehnder interferometer allows us analyze and diagnose any gaseous medium and understand the movement in all space. (ii) The distribution of the density in all space is inhomogeneous caused by the variation of the pressure. (iii) The resultant electric field is affected by the space charge which influences the evolution of density. (iv) The energy transfer between gas ion and gas neutral causes local variations in density of neutral species.
| 1 |
|
| 2 |
|
| 3 |
|
| 4 |
|
| 5 |
|
| 6 |
|
| 7 |
|
| 8 |
|
| 9 |
|
| 10 |
|
| 11 |
|
| 12 |
|
| 13 |
|
| 14 |
|
| 15 |
|