Coherence transfer from 1064 nm to 578 nm using an optically referenced frequency comb

Coherence transfer from 1064 nm to 578 nm using an optically referenced frequency comb |
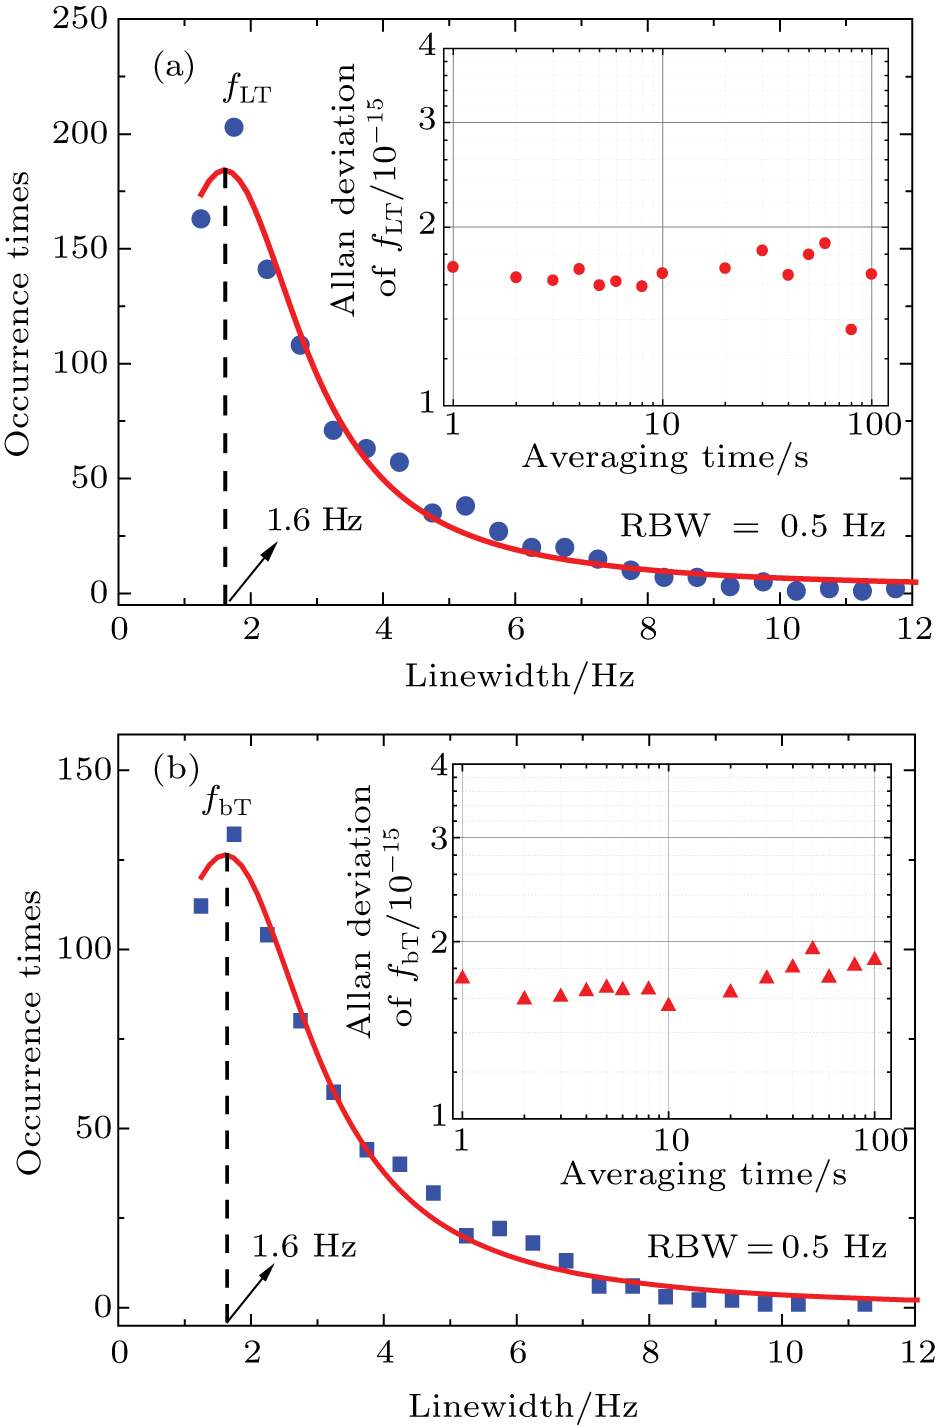
| Out-of-loop measurements of f LT and f bT. (a) Linewidth distribution of 1000 groups of the f LT (dots) and its Lorentzian fit (solid curve) when the RBW of the FFT spectrum analyzer is 0.5 Hz. The inset shows the Allan deviation of f LT (dots). (b) Linewidth distribution of 700 groups of the f bT (squares) and its Lorentzian fit (solid curve) when the RBW of the FFT spectrum analyzer is 0.5 Hz. The inset shows Allan deviation of f bT (triangles). |
 |