Zhang Han, Zhang Zhao-Hui, Zhao Xiao-Yan†, Zhang Tian-Yao, Yan Fang, Shen Jiang. Assignment of terahertz vibrational modes of L-glutamine using density functional theory within generalized-gradient approximation* . Chinese Physics B, 24(7): 073301
Permissions
Assignment of terahertz vibrational modes of L-glutamine using density functional theory within generalized-gradient approximation*
Department of Instrumentation Science, School of Automation and Electrical Engineering, University of Science and Technology Beijing, Beijing 100083, China
Institute of Applied Physics, University of Science and Technology Beijing, Beijing 100083, China
*Project supported by the National Natural Science Foundation of China (Grant Nos. 61302007 and 60977065), the Fundamental Research Funds for the Central Universities of China (Grant No. FRF-SD-12-016A), and the Engineering Research Center of Industrial Spectrum Imaging of Beijing, China.
Abstract
The crystal structure of L-glutamine is stabilized by a three-dimensional network of intermolecular hydrogen bonds. We utilize plane-wave density functional theory lattice-dynamics calculations within the generalized-gradient approximation (GGA), Perdew–Burke–Ernzerhof (PBE), PBE for solids (PBEsol), PBE with Wu–Cohen exchange (WC), and dispersion-corrected PBE, to investigate the effect of these intermolecular contacts on the absorption spectra of glutamine in the terahertz frequency range. Among these calculations, the solid-state simulated results obtained using the WC method exhibit a good agreement with the measured absorption spectra, and the absorption features are assigned with the help of WC. This indicates that the vibrational modes of glutamine were related to the combination of intramolecular and intermolecular motions, the intramolecular modes were dominated by rocking or torsion involving functional groups; the intermolecular modes mainly result from the translational motions of individual molecules, and the rocking of the hydrogen-bonded functional groups.
Terahertz time-domain spectroscopy (THz-TDS) has been utilized as a promising technique for identifying and characterizing organic crystals, [1] owing to these crystals’ distinct absorption features in the THz band. The origins of these absorption features are generally attributed to their vibrational modes, including intermolecular vibrations, intramolecular torsions, and crystal lattice vibrations.[2] The theoretical assignment of THz vibrational modes, which is crucial to understand absorption characteristics, has attracted tremendous interest. Typical theoretical simulations consider the molecule of interest as isolated, without any interactions with its environment. However, solid-state organic materials comprising of a number of intermolecular forces connected molecules exhibit significantly different fingerprint features. Therefore, it is necessary to adopt periodic solid-structure calculations to interpret the THz vibrational modes of solids.
Amino acids, which are the building blocks of proteins, are essential biological molecules, and all 20 types of standard amino acids have been studied by THz-TDS.[3] However, only ∼ 10 types of amino acids have been assigned vibrational modes until now.[4– 13] The most comprehensively examined amino acid is alanine, including L-, D-, and DL-alanine, [6– 8] whose absorption spectra are interpreted according to both the dimmer, [8] by Mø ller– Plesset (MP2) or Becke– 3– Lee– Yang– Parr (B3LYP) functionals, and the periodic crystal structure using RPBE[7] or B3LYP.[8] Alanine has been investigated the most because it is the smallest chiral amino acid, and its geometrical structure and spectral features are easy to analyze. For other complex amino acids, although the density functional theory (DFT), Hartree– Fock (HF), and MP2 are utilized, most of these methods are based on an isolated molecule, and hence, satisfactory results cannot be obtained owing to the inconsistency between the model and the actual crystal.
In the solid-state simulations, DFT is particularly developed and useful in determining the assignment of vibrational modes of small molecules. DFT relies on good approximations to the exchange– correlation (XC) energy as a function of the electronic spin density. The widely used in solid state is the Perdew– Burke– Ernzerhof (PBE) version within the generalized-gradient approximation (GGA). The PBE employing both the density and its gradient provides a better overall description of the electronic subsystem. However, it usually overcorrects lattice constants, and some equilibrium properties, such as phonon frequencies and magnetism, which are sensitive to the lattice constant, are often overcorrected as well.[14] More accurate approximations to the XC energy within the GGA have been achieved based on PBE. The PBE for solids (PBEsol)[14] was developed to improve the description of exchange in solids, by altering the second-order coefficients of the gradient expansion for exchange and correlation, and retaining all other conditions of PBE. This restoration results in better structures and energetics for densely packed solids and their surfaces, but worsens atomization energies. Wu and Cohen[15] proposed a modified method, the PBE with Wu– Cohen exchange (WC), based on a diffuse radical cutoff factor. Retaining the PBE correlation functional, the WC corrects the analytic expression of exchange enhancement factor, and seems more accurate for solids than PBE.
The GGA functionals have proven to be capable of predicting accurate vibrational frequencies in the THz band for organic and biological crystals with hydrogen bonds, including monomeric crystals and even cocrystals.[16, 17] In this paper, to verify the capability of these GGA functionals to operate on amino acids, we investigate them with regard to the THz absorption spectra of L-glutamine (Gln) that contains a three-dimensional network of intermolecular hydrogen bonds. The THz-TDS experiments and the preparation of Gln samples are briefly introduced in Section 2. Section 3 describes the computational approaches in detail. By comprehensively comparing all computational results in Section 4, a better reproduction of the Gln crystal structure is acquired using the WC functional, and more accurate simulated feature positions are obtained in this paper.
2. Experiments
For our experimental setup, as shown in Fig. 1, a mirror-dispersion-controlled (MDC) Ti:sapphire oscillator (FEMTOSOURCE, FEMTOLASERS Produktions GmbH, Austria) was pumped by a continuous wave (CW) laser (Verdi-V5, Coherent Inc., USA) in order to generate a mode-locking femtosecond (fs) laser with a pulse duration of 10 fs, a repetition frequency of 75.42 megahertz, and average output power of 300 milliwatt. The laser pulse is split into two beams utilized to pump and detect THz radiation respectively. The THz pulse generated by an LT-GaAs photoconductive antenna was focused by two off-axis parabolic mirrors, and irradiated vertically into the sample. Then the transmitted pulse was focused by another two off-axis parabolic mirrors onto an electro-optic crystal, ZnTe 〈 110〉 . All samples were examined at 293 K. To reduce the influence of water vapor, the sample and THz optical path were sealed in a vacuum box.
Since polyethylene (PE) is nearly transparent in the THz region, [5, 8] we use it as diluents. The PE powder (Sigma-Aldrich Co., USA) is in form of about 50-μ m granules. Polycrystalline Gln solid powder (Wako Pure Chemical Industries, Ltd., Japan) with 99.0% purity was finely milled using a mortar and pestle, and thoroughly mixed with PE. The mixture was then compressed into a pellet under 10 MPa with a diameter of 13 mm. We prepared three Gln samples with the concentrations of 0.29, 0.86, and 1.15 mol/L, respectively, as described in Table 1.
Table 1.
Table 1.
Table 1. Gln sample components.
Sample
PE/mg
Gln/mg
Thickness/mm
Concentration/mol· L− 1
Gln1
131.81
7.89
1.38
0.29
Gln2
116.24
20.76
1.24
0.86
Gln3
112.61
27.69
1.24
1.15
Table 1. Gln sample components.
3. Computation methods
In this work, solid-state geometry optimizations and lattice-dynamics calculations were performed using a plane-wave basis set, norm-conserving pseudopotentials, and the WC density functional. The crystal structure of Gln[18] used as the starting point of the optimizations was determined according to neutron diffraction (CSD reference code GLUTAM01, 283– 303 K). Both the unit cell parameters and the atomic positions can be optimized by the method. A lattice-dynamics calculation was performed on the ordered structure after full geometry optimization upon unconstrained lattice energy minimization.
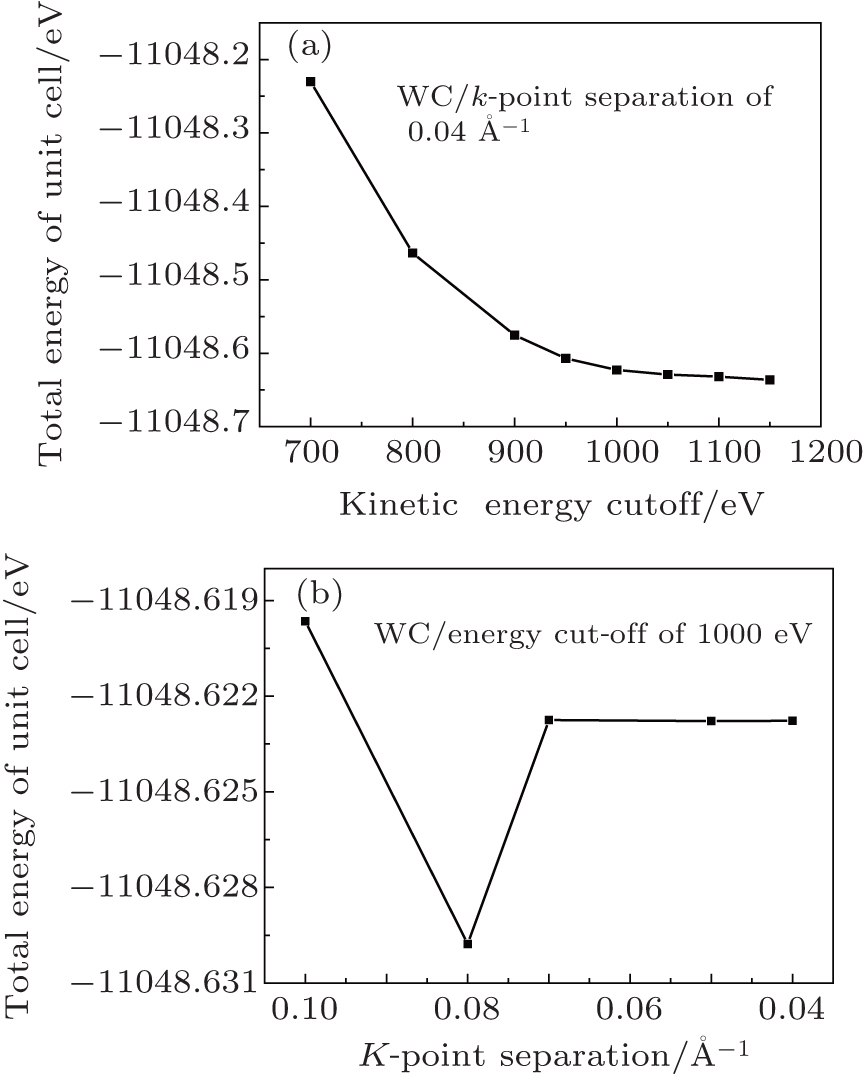
In plane-wave density functional calculations, electronic wave functions must be expanded in terms of a discrete plane-wave basis set. However, an infinite number of plane waves for such an expansion are not realistic. Thus, we must determine the kinetic-energy cut-off to achieve the required precision. It is well known that a higher energy cut-off leads to more accurate results; however, it also leads to a tremendous computing workload. We test the convergence of the total energy by increasing the cut-off energy and the k-point density. Regarding the single-point-energy calculations of the WC in Fig. 2(a), the total energy begins to stabilize and change by less than 0.01 eV after the kinetic-energy cut-off is higher than 1000 eV. Then, the energy cut-off is fixed at 1000 eV, and the total energy is nearly constant when the k-point separation is less than 0.07 Å − 1 (see Fig. 2(b)), which corresponds to a 1 × 2 × 3 Monkhorst– Pack grid to sample the Brillouin zone.
Fig. 2. Convergence test for the energy cut-off of Gln unit cell with fixed k-point separation of 0.04 Å − 1 (a), and for the k-point separation with fixed energy cut-off of 1000 eV (b).
The calculations are performed using the Cambridge Sequential Total Energy Package (CASTEP)[19] version 6.0 (Accelrys Materials Studio, USA), and a plane-wave basis set cut-off energy of 1000 eV and a k-point separation of 0.07 Å − 1 are used according to the aforementioned convergence tests. We use the line search of the Broyden– Fletcher– Goldfarb– Shanno (BFGS) algorithm in the geometry optimizations, and the quality of the convergence tolerance is set as “ fine” , which corresponds to an energy tolerance of 10− 5 eV, a force threshold of 0.03 eV/Å , a maximum stress of 0.05 GPa, and a maximum displacement of 10− 3 Å . We use the reciprocal space pseudopotential representation, and the self-consistent field (SCF) energy converges to less than 10− 8 eV per atom at each step of the lattice dynamics.
For comparison, the PBE and PBEsol calculations are also implemented on a Gln crystal structure. In addition to the hydrogen bonds, the noncovalent forces also include the van der Waals force and other weak interactions. Standard DFT has difficulties in the treatment of long-range dispersion forces between molecules. Hence, the DFT calculations do not yield the van der Waals interaction force. To deeply understand the intermolecular interactions, we apply the dispersion-corrected density functional theory (DFT-D2) proposed by Grimme[20] to the lattice-dynamics calculations. The PBE is used in conjunction with the DFT-D2 for including the long-range dispersion corrections. Normal-mode analyses of the isolated molecule are also performed, using a 6-311+ + G (d, p) basis set and a B3LYP hybrid functional for comparison.
4. Results and discussion
4.1. THz absorption spectra
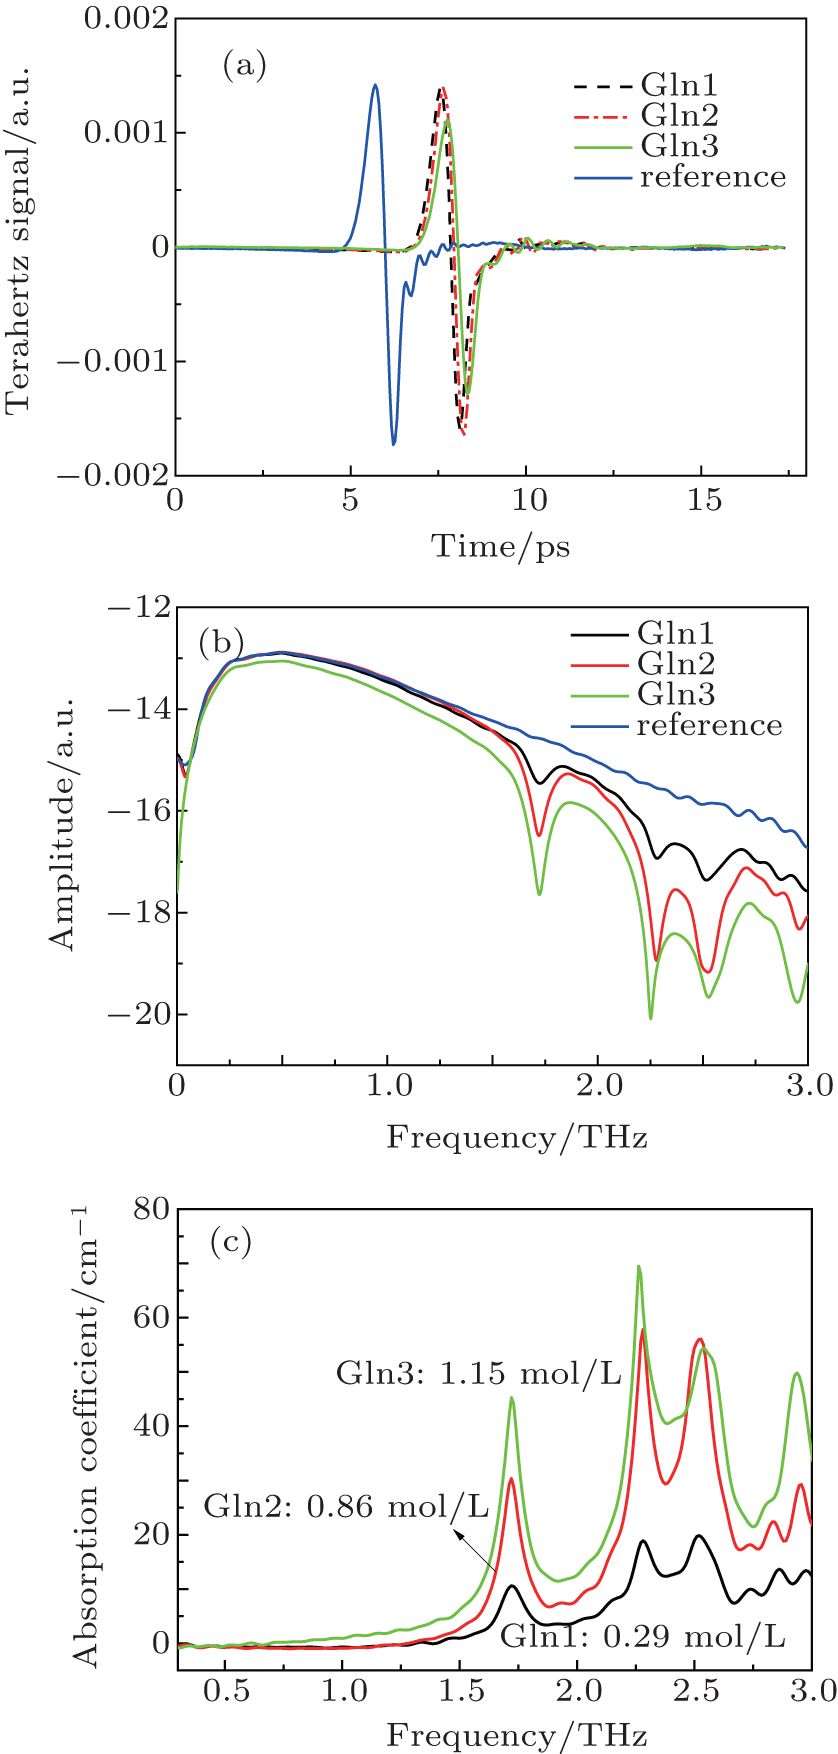
The time-domain spectra of Gln samples obtained using the intercept model described in Ref. [21] are presented in Fig. 3(a), and the THz signal transmitted through the vacuum is used as the reference signal. The frequency-domain spectra in Fig. 3(b) are acquired by the Fourier transform operating on the time-domain signal. Figure 3(c) shows the absorption spectra obtained using the algorithm in Ref. [13]. In order to avoid background noise, the dynamic range (DR) of our experiments is analyzed, [22] and the frequency upper limit of the absorption spectra is determined to be 2.60 THz. Within this limit, there are clearly three strong features centred at 1.72, 2.28, and 2.52 THz. The three samples exhibit identical absorption features, and the absorption coefficients increase with the concentration according to the Lambert-Beer law.[23] However, Gln2 with a lower concentration has a higher peak than the Gln3 at 2.52 THz. We attribute this to the lower signal-to-noise ratio (SNR) when the frequency approaches the DR limit that makes the THz signal unstable.
Fig. 3. Time-domain spectra (a), frequency-domain spectra (b), and absorption spectra of Gln samples (c).
Although these feature positions correspond well to previous studies, [12, 24] the frequency deviations also exist, as shown in Table 2. The THz mode at 1.72 THz is undoubtable, and the tiny differences between these reports can be ignored. According to the irreducible representation of the P212121 space group for Gln, three types of symmetry normal modes, B1, B2, and B3, are both infrared (IR), or THz, and Raman active, and one type of symmetry normal mode A corresponds to only the Raman active modes. That is, if there are IR modes, they are inevitably accompanied by Raman modes. However, the THz modes at 2.14 and 2.42 THz reported by Wang et al.[12] deviate too much from the experimental Raman modes in Table 2. In particular, for the third THz mode at 2.42 THz, which does not correspond to any Raman modes, the authors consider that the Raman intensity is so weak that they cannot observe it. Considering the feature at 2.28 and 2.52 THz in our experiments, which is more consistent with the Raman modes, our experimental results seem more reasonable. Therefore, our spectral features will be assigned in the following work.
Table 2.
Table 2.
Table 2. Central frequency (in THz) of experimental THz and Raman modes for Gln.
Table 2. Central frequency (in THz) of experimental THz and Raman modes for Gln.
4.2. Theoretically optimized crystal structures
The observed unit cell parameters are as follows: space group P212121 (Z = 4), a = 16.020 Å , b = 7.762 Å , c = 5.119 Å , α = β = γ = 90.0° (see Fig. 4(a)). The periodic structure is stabilized by a three-dimensional network of intermolecular N– H· · · O hydrogen bonds. Five N– H· · · O hydrogen bonds are distributed over five neighbouring molecules, resulting in a complicated hydrogen-bonding pattern. The Gln molecule is a zwitterion in a crystal state, with a and a COO− group[18] (see Fig. 4(b)).
Fig. 4. Molecular packing in unit cell, hydrogen bonds are indicated as 1, 2, and 3 using dashed lines (a) and isolated Gln molecule in the form of zwitterion, dark gray atoms are carbon, white are hydrogen, red are oxygen, and blue are nitrogen (b).
The crystal structure geometries of Gln optimized by WC, as well as PBEsol, PBE, and DFT-D2, are shown in Table 3. In addition to the unit cell dimensions, selected intermolecular contacts are compared with the observed structure to illustrate how well the calculations reproduce the intermolecular interactions. As shown in Fig. 4(a), three hydrogen bonds are indicated as 1, 2, and 3. Label 1 is the N3– H10· · · O18 hydrogen bond, formed by the amino nitrogen and the neighbouring amide oxygen. Label 2 is N7– H20· · · O13, formed by the amide nitrogen and the neighbouring hydroxyl oxygen atom in the carboxyl group. The hydrogen atom H19 forms the hydrogen bond N7– H19· · · O18 with another neighbouring amide oxygen. The three hydrogen bonds constitute coplanarity around the amide group within four neighbouring molecules. Along with the unit cell parameters, Table 3 provides the donor-acceptor distance dN· · · O, the N– H bond length dN– H, and the distance from H to O dH· · · O within the three hydrogen bonds.
Table 3.
Table 3.
Table 3. Comparison of lattice energy minimized structures with the experimental structure of Gln from Ref. [18]. The percent deviations relative to experimental structure parameters are given in the parentheses.
Method
a/b/c/Å
α / β / γ /(° )
Cell volume/Å 3
dN· · · O/dN– H/dH· · · O/Å
Hydrogen bond 1
Hydrogen bond 2
Hydrogen bond 3
Exp.
16.020/7.762/5.119
90
636.534
2.948/1.022/1.942
2.910/1.009/1.918
2.937/1.001/2.088
WC
16.040/7.798/5.054
90
632.164
2.948/1.043/1.918
2.869/1.034/1.864
2.843/1.034/1.891
(+ 0.12%/+ 0.46%/– 1.27%)
(– 0.69%)
(0/+ 2.05%/– 1.24%)
(– 1.41%/+ 2.48%/– 2.82%)
(– 3.20%/+ 3.30%/– 9.43%)
PBEsol
15.906/7.772/5.060
90
625.575
2.889/1.048/1.854
2.848/1.038/1.830
2.862/1.033/1.949
(– 0.71%/+ 0.13%/– 1.15%)
(– 1.72%)
(– 2.00%/+ 2.54%/– 4.53%)
(– 2.13%/+ 2.87%/– 4.59%)
(– 2.55%/+ 3.20%/– 6.66%)
PBE
16.480/7.893/5.183
90
674.168
3.124/1.036/2.105
2.975/1.027/1.973
2.942/1.026/2.014
(+ 2.87%/+ 1.69%/+ 1.25%)
(+ 5.91%)
(+ 5.97%/+ 1.37%/+ 8.39%)
(+ 2.23%/+ 1.78%/+ 2.87%)
(+ 0.17%/+ 2.50%/– 3.54%)
DFT-D2
15.785/7.730/5.040
90
614.985
2.867/1.039/1.845
2.864/1.029/1.859
2.881/1.027/1.949
(– 1.47%/– 0.41%/– 1.54%)
(– 3.39%)
(– 2.75%/+ 1.66%/– 4.99%)
(– 1.58%/+ 1.98%/– 3.08%)
(– 1.91%/+ 2.60%/– 6.66%)
Table 3. Comparison of lattice energy minimized structures with the experimental structure of Gln from Ref. [18]. The percent deviations relative to experimental structure parameters are given in the parentheses.
The structure is satisfactorily reproduced by the WC and slightly contracted by 0.69% in total volume compared with the observed structure. The PBEsol structure is also acceptable, with a contraction of 1.72%. It is interesting that for these two structures, almost all of the dH· · · O values are smaller because the H atoms are attracted closer to the acceptors O, and hence, the distances dH· · · O are smaller, whereas the N– H bond lengths dN– H increase, albeit to a lesser extent. The H atom is found to interact more closely with its intermolecular acceptor.
The PBE structure is overestimated, as expected; the unit cell expands by 1.25%– 2.87% in three directions, leading to an overall volume expansion of 5.91%. The large expansion is due to the failings of the DFT in describing the dispersion attraction between molecules. Unlike WC and PBEsol, the donor-acceptor distance dN· · · O for PBE increases as well, where the hydrogen bond 1 has an expansion too large: 5.97%. The inclusion of dispersion correction in the PBE has significant effects on the lattice parameters, as observed in the DFT-D2 structure geometries, which become smaller than that observed. The variation trends of the dN· · · O, dN– H, and dH· · · O values for the DFT-D2 are similar to the results for PBEsol and WC.
4.3. THz vibrational modes assignment
The solid-state normal-mode analyses for the GGA functionals and the isolated-molecule normal modes for the B3LYP are shown in Table 4, along with their calculated frequencies and IR intensities. In Fig. 5, the simulated spectra based on the calculated IR intensities (vertical lines) are compared with the standard molar absorption spectrum α m. The spectrum α m is obtained by averaging the molar absorption spectra of the three Gln samples; the molar absorption spectra are obtained using the equations in our previous study.[25] Using the free software Multiwfn version 3.3, [26] the simulated spectra are presented by an empirical Lorentz line shape with a full width at half maximum (FWHM) of 3.0 cm− 1, as the FWHM of our experimental spectra is ∼ 3.0 cm− 1.[22]
Fig.5. The low-frequency region (0.3− 2.6THz) of the standard molar absorption spectrum of Gln (top) compared with the simulated THz spectra of isolated-molecule model using B3LYP and that of solid-state model using GGA functionals, and the calculated IR intensities represented by vertical lines (bottom).
Table 4.
Table 4.
Table 4. Calculated IR active normal modes below 2.6 THz for solid-state model and isolated molecule of Gln.
The first optical phonon modes are Raman, but not IR active in thesolid-state calculations.
Table 4. Calculated IR active normal modes below 2.6 THz for solid-state model and isolated molecule of Gln.
The isolated molecule calculated by the B3LYP only generates three normal modes below 2.6 THz. These modes shift to a far lower frequency, and no agreements are revealed between the calculated positions and the experimental features, as shown in Fig. 5. These vibrational modes arise from the intramolecular motions, as indicated by Fig. 6. We observe that the energy minimized molecule has a COOH and NH2 group. Additionally, there is a proton transfer from the group to the COO− group. However, in the observed structure of Fig. 4(a), the molecules are tightly hydrogen-bonded, which makes the solid rigid and stops the proton transfer. Therefore, an isolated-molecule model cannot simulate the real state of an organic crystal with intermolecular forces, and the experimental spectra cannot be reproduced at the isolated-molecule level.
To assign the THz features, we compare the GGA calculations based on a periodic structure. Both the frequency and the intensity of these normal modes are important for accurate assignments. The PBEsol and WC generate eight IR modes, the PBE has nine IR modes, and the DFT-D2 only has seven IR modes. The results of the DFT-D2 do not correspond well with the observed spectra for the first two weak IR active modes, as shown in Fig. 5, although the geometric structure is well reproduced. Perhaps this is because that the method does not introduce the weak interactions into the self-consistent field, and hence, the electron density cannot response to the weak interactions.
Fig. 6. Depictions of IR active normal modes for the isolated molecule of Gln using the B3LYP, and the arrows represent the displacements of atoms.
Figure 5 indicates that the PBEsol, WC, and PBE spectra have three strong features. In contrast, no significant feature bands are expected for the other modes, owing to their small oscillator strengths. The three simulated spectra exhibit very similar patterns compared with the experimental spectra. However, the subtle differences require further comparison. The Raman active modes given in Table 4 are the first optical phonon modes in the GGA calculations. The Raman mode at 1.40 THz for WC corresponds well with the first observed Raman mode at 1.42 THz in Table 2. Because no other bands exist between this Raman mode and the first IR mode in either the experimental or theoretical results, the first IR mode at 1.43 THz for PBEsol, 1.44 THz for the WC, and 1.08 THz for PBE are identified as corresponding to the observed feature at 1.72 THz. However, the PBE mode at 1.08 THz deviates considerably from that at 1.72 THz. Regarding the two observed features at 2.28 and 2.52 THz, we attribute them to two strong features at higher frequencies in the simulated spectra.
Next, the calculated vibrational modes are quantitatively evaluated by comparing their central frequencies to those observed. In Table 5, the relative error (RE) is given for each calculated frequency, and the corresponding observed frequency is provided for comparison. The RE for the first mode of PBE is 37.2%, which is too large. The performance of PBEsol is insufficient, as the REs for the first two modes are 16.9% and 17.1%, which is unacceptable. For the WC method, the three positions agree better with the experimental values than PBE and PBEsol. The calculated frequencies from a previous report[12] are also given in the Table. In these results, the first mode performs better, but the REs for all three modes exceed 10%.
For clarity, an overall evaluation is conducted with regard to the root-mean-squared deviation (RMSD) of the three calculated central frequencies compared with the experimental ones for each density functional. The RMSD is calculated using the following equation:
where fcal_i and fexp_i represent the central frequencies of the calculated and observed modes, respectively. As shown in Table 5, the WC calculations produce an RMSD of 0.19 THz, which perform better than PBE, PBEsol, and the existing literature. The intensity distribution of the spectrum for the WC corresponds better with the experiments as well. This is consistent with the fact that the WC structure agrees best with the observed structure in the geometry optimizations. The higher accuracy of the WC in the reproduction of the spectra is attributed to the improved XC energy and potential in the core regions of the atoms, caused by adding constraints into the exchange enhancement factor. Notably, the simulated and measured spectra amplitudes are not normalized in our work. There are large differences between their amplitudes, as the experimental results cannot reach the ideal level.
Table 5.
Table 5.
Table 5. Comparison of the central frequency (in THz) between calculated and experimental THz modes.
Experimental
Calculated THz modes
WC
RE
PBE
RE
PBEsol
RE
Ref.[12]
RE
1.72
1.44
16.3%
1.08
37.2%
1.43
16.9%
1.49
13.4%
2.28
2.11
7.5%
2.11
7.5%
1.89
17.1%
2.02
11.4%
2.52
2.47
2.0%
2.59
− 2.8%
2.29
9.1%
2.19
13.1%
RMSD
0.19
0.38
0.31
0.28
Table 5. Comparison of the central frequency (in THz) between calculated and experimental THz modes.
Among the aforementioned comparisons of the GGA calculations, the THz spectrum simulated by the WC agrees best with the observed spectra with regard to both the feature positions and the distribution of the calculated IR intensities. Therefore, the three observed features are assigned to the modes at 1.44, 2.11, and 2.47 THz resulting from the WC, although there are still differences between the observed and theoretical frequencies. The motional displacement vectors for the three assigned modes are given in Fig. 7. The absorption features in the low-frequency region arise from combined intramolecular torsion or rocking, along with the collective motions of molecules due to the hydrogen bonds. The first intense vibrational mode for 1.44 THz is dominated by translational motions between neighbouring molecules. The mode for 2.11 THz is mainly about the intramolecular H2C4– C5H2 out-of-pane rocking together with the collective motions of the hydrogen-bonded amide groups. The third mode mainly involves an intramolecular amino and carboxyl group motion, as shown in Fig. 7.
Fig. 7. Calculated displacement vectors for the three most intense modes of the WC functional. The 1.44 THz mode (a) is a top view of the unit cell in Fig. 4(a); the 2.11 THz (b), and 2.47 THz modes (c) are viewed perpendicular to the paper.
5. Conclusions
We carefully determined the reasonable THz absorption features of Gln at room temperature. To explain these features, three GGA density functionals: WC, PBEsol, and PBE, as well as the dispersion-corrected PBE, are utilized to study the vibrational modes. The results reveal that the WC spectrum agrees best with the experimental spectra with regard to both the feature frequencies and the intensity distribution. Using the assigned IR active modes, we demonstrate that hydrogen bonds have an important effect on the spectral features in the THz band.
The quantitative explanation of the weak intermolecular forces in solids remains difficult owing to theoretical restrictions. According to our calculations, the WC performs better than PBE, which is most commonly used in solid-state simulations. We attribute this to the functional with more accurate approximations to the XC energy of solids. These results show that the DFT makes solid-state simulations improved in the THz band.
PerdewJ P, RuzsinszkyA, CsonkaG I, VydrovO A, ScuseriaG E, ConstantinL A, ZhouX and BurkeK2008Phys. Rev. Lett. 100136406DOI:10.1103/PhysRevLett.100.136406[Cited within:2]
... IntroductionTerahertz time-domain spectroscopy (THz-TDS) has been utilized as a promising technique for identifying and characterizing organic crystals,[1] owing to these crystals#cod#x2019 ...
1
2006
0.0
0.0
... [2] The theoretical assignment of#cod#x00A0 ...
1
2009
0.0
0.0
... [3] However, only #cod#x223C ...
1
2006
0.0
0.0
... [4#cod#x2013 ...
1
2009
0.0
0.0
... THz region,[5,8] we use it as diluents ...
1
2005
0.0
0.0
... 13] The most comprehensively examined amino acid is alanine, including L-, D-, and DL-alanine,[6#cod#x2013 ...
1
2010
0.0
0.0
... Parr (B3LYP) functionals, and the periodic crystal structure using RPBE[7] or B3LYP ...
4
2012
0.0
0.0
... 8] whose absorption spectra are interpreted according to both the dimmer,[8] by M#cod#x00F8 ...
... 8] whose absorption spectra are interpreted according to both the dimmer,[8] by M#cod#x00F8 ...
... [8] Alanine has been investigated the most because it is the smallest chiral amino acid, and its geometrical structure and spectral features are easy to analyze ...
... THz region,[5,8] we use it as diluents ...
1
2005
0.0
0.0
1
2007
0.0
0.0
1
2004
0.0
0.0
3
2011
0.0
0.0
... Although these feature positions correspond well to previous studies,[12,24] the frequency deviations also exist, as shown in Table#cod#x00A0 ...
... [12] deviate too much from the experimental Raman modes in Table#cod#x00A0 ...
... The calculated frequencies from a previous report[12] are also given in the Table ...
2
2014
0.0
0.0
... 13] The most comprehensively examined amino acid is alanine, including L-, D-, and DL-alanine,[6#cod#x2013 ...
... [13] ...
2
2008
0.0
0.0
... [14] More accurate approximations to the XC energy within the GGA have been achieved based on PBE ...
... The PBE for solids (PBEsol)[14] was developed to improve the description of exchange in solids, by altering the second-order coefficients of the gradient expansion for exchange and correlation, and retaining all other conditions of PBE ...
1
2006
0.0
0.0
... Wu and Cohen[15] proposed a modified method, the PBE with Wu#cod#x2013 ...
1
2011
0.0
0.0
... [16,17] In this paper, to verify the capability of these GGA functionals to operate on amino acids, we investigate them with regard to the#cod#x00A0 ...
1
2012
0.0
0.0
... [16,17] In this paper, to verify the capability of these GGA functionals to operate on amino acids, we investigate them with regard to the#cod#x00A0 ...
2
1973
0.0
0.0
... The crystal structure of Gln[18] used as the starting point of the optimizations was determined according to neutron diffraction (CSD reference code GLUTAM01, 283#cod#x2013 ...
... group[18] (see Fig ...
1
2005
0.0
0.0
... The calculations are performed using the Cambridge Sequential Total Energy Package (CASTEP)[19] version 6 ...
1
2006
0.0
0.0
... To deeply understand the intermolecular interactions, we apply the dispersion-corrected density functional theory (DFT-D2) proposed by Grimme[20] to the lattice-dynamics calculations ...
1
2013
0.0
0.0
... [21] are presented in Fig ...
2
2013
0.0
0.0
... In order to avoid background noise, the dynamic range (DR) of our experiments is analyzed,[22] and the frequency upper limit of the absorption spectra is determined to be 2 ...
... [22] ...
1
2013
0.0
0.0
... [23] However, Gln2 with a lower concentration has a higher peak than the Gln3 at 2 ...
1
0.0
0.0
... Although these feature positions correspond well to previous studies,[12,24] the frequency deviations also exist, as shown in Table#cod#x00A0 ...
1
2012
0.0
0.0
... [25] Using the free software Multiwfn version 3 ...
1
2012
0.0
0.0
... 3,[26] the simulated spectra are presented by an empirical Lorentz line shape with a full width at half maximum (FWHM) of 3 ...
Assignment of terahertz vibrational modes of L-glutamine using density functional theory within generalized-gradient approximation*


 , Zhang Tian-Yao