|
|
Multifractal analysis of white matter structural changes on 3D magnetic resonance imaging between normal aging and early Alzheimer’s disease
|
Ni Huang-Jing a), Zhou Lu-Ping† b) , Zeng Peng a), Huang Xiao-Lin a), Liu Hong-Xing a), Ning Xin-Bao‡ a), |
|
| |
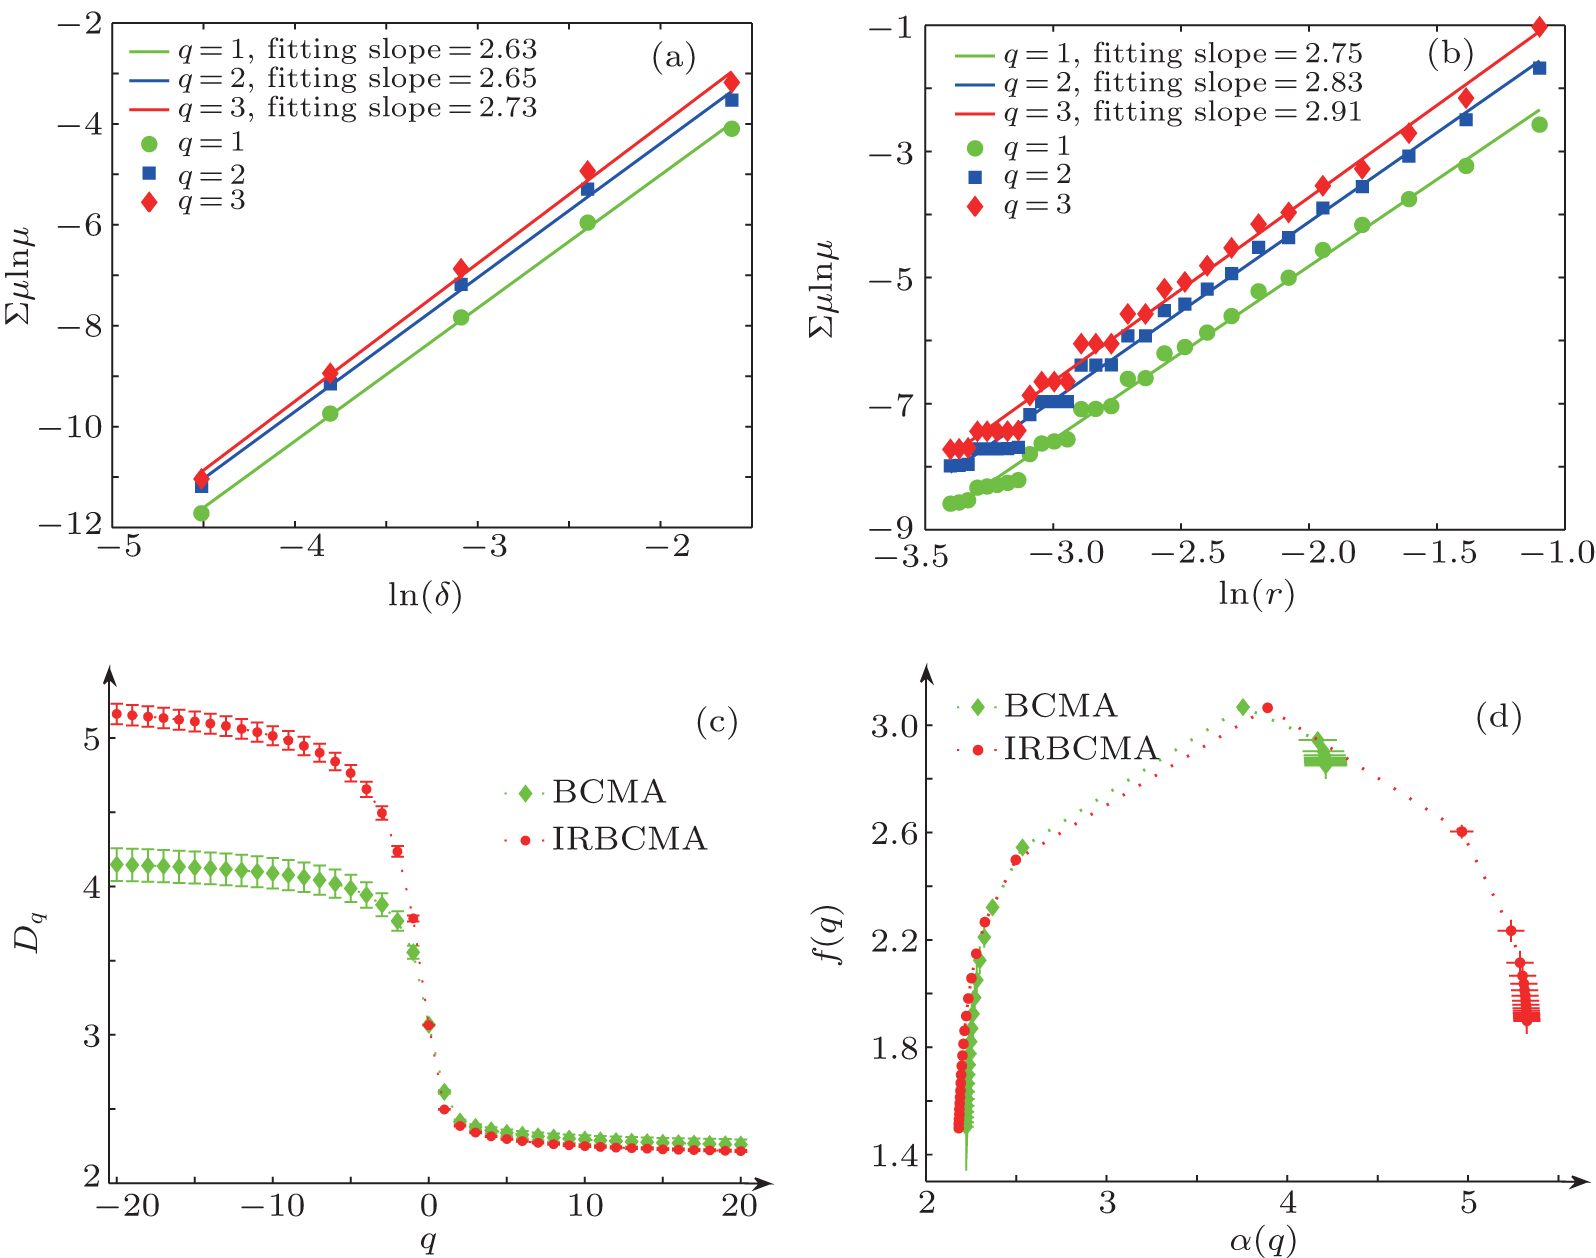
| Three fitted lines with (a) Σ μ i ln μ i versus ln δ for BCMA and (b) Σ μ i ln μ i versus ln r for the IRBCMA are plotted to verify multifractal characteristics. The dot (•), square (◻), and diamond (◊) symbols correspond to q = 1, q = 2, and q = 3 cases, respectively. In each case, linear fitting is performed and shown with the solid line, and its slope value is given in the legends. The multifractal characteristics is again verified by another plot from the same subject. (c) A plot of D q versus q with q ranging from −20 to 20 for both BCMA (◊) and IRBCMA (•). Each curve is represented as mean ± standard error from different divisions. (d) A typical MFS from the same subject for both BCMA (◊) and IRBCMA (•). Each point is represented as mean ± standard error from different divisions. |
|
|
 |
|
|