†Corresponding author. E-mail: chentao.a@tsinghua.edu.cn
*Project supported by the National Basic Research Program of China (Grant No. 2012CB719705) and the National Natural Science Foundation of China (Grant Nos. 91224008, 91024032, and 71373139).
As a physical model, the cellular automata (CA) model is widely used in many areas, such as stair evacuation. However, existing CA models do not consider evacuees’ walk preferences nor psychological status, and the structure of the basic model is unapplicable for the stair structure. This paper is to improve the stair evacuation simulation by addressing these issues, and a new cellular automata model is established. Several evacuees’ walk preference and how evacuee’s psychology influences their behaviors are introduced into this model. Evacuees’ speeds will be influenced by these features. To validate this simulation, two fire drills held in two high-rise buildings are video-recorded. It is found that the simulation results are similar to the fire drill results. The structure of this model is simple, and it is easy to further develop and utilize in different buildings with various kinds of occupants.
Stairs play an important role in building evacuation since they are generally the only way to evacuate occupants. There are many human factors that influence the efficiency of stair evacuation, such as the evacuees’ walk preferences[1– 3] and their psychological status.[4, 5] On stairs, evacuees’ walk preferences are different from those in a passage. People intend to keep a distance from the person in front, and the distance is always larger than the length of a tread.[1, 2] When going downstairs, evacuees try to walk along the route with the shortest distance. Although evacuees can move freely on treads, they usually move forward on treads instead of moving laterally.[3] To the evacuees who are in emergency conditions, they may become nervous.[4] Evacuees’ behaviors will be changed due to their psychological status.[5] For example, when evacuees are nervous, they will become more aggressive and keep a shorter distance than that in normal conditions. Evacuees’ desired speeds will be increased according to emergency environments.
To evaluate the design of stairs, simulations are widely used since the building layout can be well considered.[6, 7] Many useful commercial tools, such as EXIT89, [8, 9] FPETool, [10] EVACNET4, [11, 12] TIMTEX, [13] WAYOUT, [14] STEPS, [15] and building EXODUS, [16] are developed to simulate stair evacuation. However, evacuees’ walk preferences and psychological status are not considered in existing simulations. As a result, how to improve stair evacuation simulation with considering these human factors is an important issue.
The cellular automata (CA) model is a widely-used microscopic physical model, and CA is used in many fields, such as pedestrian simulation in buildings, [17, 18] pedestrian flow on walkways[19] or crossing, [20] and traffic flow.[21– [24 The CA model is also good at simulating pedestrian flow in stairs since such a type of model divides the building space into a grid map, [25– 32] and the space of stairs is also discrete.
In this paper, a new CA simulation model is established in Section 2, and evacuees’ walk preferences and psychological status are considered in the simulation. To better demonstrate evacuees’ walk preferences, the grid map is designed based on the structure of stairs. Evacuees will change their speeds according to their psychological status. It is important to validate the simulation model after it has been established. However, the validation of simulation is not easy since there is a lack of stair evacuation data or drill data.[33] To validate our simulation, two fire drills are carried out in two high-rise buildings, and the validations are presented in Section 3. When considering evacuees’ walk preferences and psychological status, the results of our simulation are similar to the results of the drills.
In most of the existing CA models, the cell size on a stair is designed to be the same as that in a corridor, [6] e.g., the cell size is 0.5 m × 0.5 m[18] or 0.4 m × 0.4 m, [34] and the only difference is that a pedestrian’ s speed on a stair is slower than that in a corridor. As a result, we re-design the cell sizes on both the landings and treads. The cell size on treads is the width of a pedestrian’ s shoulder × the depth of a tread since one pedestrian can only occupy a part of a certain tread. Take the body sizes of Chinese people for example, the average width of pedestrians’ shoulders is 0.43 m.[18] However, the width of the cell should also be designed based on the width of a stair. One tread can usually afford two or three pedestrians simultaneously, and the width of a stair should be an integral multiple of the width of a cell.
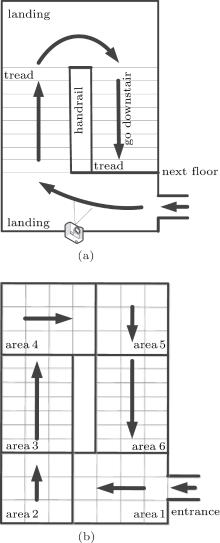
Landings (as shown in Fig. 1) are connected with treads, and the cell size on landings is the width of a pedestrian’ s shoulder × the width of a pedestrian’ s shoulder. A stair map is shown in Fig. 1(a), and the corresponding simulation map is shown in Fig. 1(b).
On stairs, not all the pedestrians have the same moving direction. To distinguish pedestrians of different directions, a stair between two floors is divided into six areas: areas 1– 6. For example, the moving direction in area 1 is left according to Fig. 1(b), and the moving direction in area 2 is up. In each area, evacuees’ movements are defined separately.
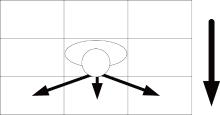
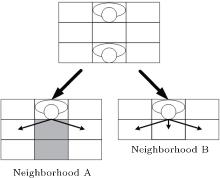
A neighborhood is defined as an area around an evacuee, and other evacuees in the area will influence this evacuee’ s movement. The cells in the neighborhood area are called neighbor cells. The neighborhood can demonstrate the requirement for keeping distances among evacuees. Compared with an evacuee who does not want to keep a distance from the people in front, the evacuee who tries to keep a distance from others has a large neighborhood. The neighborhoods on treads are shown in Fig. 2: figure 2(a) shows a larger neighborhood (neighborhood A), and figure 2(b) displays a smaller neighborhood (neighborhood B). Whether evacuees want to keep a distance from others will be influenced by their psychological status, and the details will be presented in Subsection 2.3. On treads, our neighborhoods are different from these in other CA simulation models since we consider evacuees’ walk preferences. When evacuees go downstairs, they will move forward, left ahead or right ahead, and they can hardly move backward. Evacuees do not usually move leftward or rightward on a tread since a stair is always narrow. When people try to turn their directions, they prefer to turn left or right in the process of moving forward. Based on the different structures of treads and landings, the neighborhoods on treads and landings are not the same in this model. The neighborhood on landings is shown in Fig. 2(c), and the neighborhood is the eight cells around a pedestrian because he/she can move toward any direction in a horizontal place. This neighborhood is a typical Moore[6] neighborhood.
The rule of how pedestrians move in the simulation is defined as the transition rule. As the stair between two floors is divided into several areas, the transition rule in each area will be determined separately. For the areas on treads, the only difference is the evacuees’ moving directions. Evacuees’ moving directions in area 3 is up (shown in Fig. 3), and evacuees’ moving directions in area 6 is down in Fig. 1(b). Take area 6 for example, if a neighbor cell of an evacuee is occupied by another evacuee, he/she cannot move to that neighbor cell. As mentioned above, people want to keep a distance from others. In our simulation model, if one of the two neighbor cells in front of an evacuee is occupied, he/she cannot move to these neighbor cells. For example (shown in Fig. 4), if there is one person who is two treads ahead of an evacuee, the results are different according to the neighborhoods. For an evacuee with neighborhood A, he/she cannot move forward, and he/she may move left ahead or right ahead. However, for an evacuee with neighborhood B, moving forward is one of his/her choices.
For the transition rule in area 6, PF, PL, PR, and PS demonstrate the probabilities of moving forward, left ahead, right ahead, and stop, respectively. As they are the probabilities of one evacuee’ s movement, we have

The transition rules are as follows:


Different conditions (1)– (8) are corresponding to Fig. 5, and neighborhoods A and B are shown on the left and on the right, respectively. To demonstrate evacuees who try to go along the shortest distance on stairs, parameter a is introduced as the attraction value with 0 ≤ a ≤ 1/3.
 | Fig. 5. All the positions of a pedestrian [corresponding different conditions (1)– (8)]. The gray cell means the direction occupied by others. |
As the neighborhood on landings is different from that on treads, the transition rules are also different. Among six areas, area 1, area 2, area 4, and area 5 are on landings. The transition rules are similar in these areas, and the only difference is in evacuees’ moving direction. Evacuees’ moving directions are left, up, right, and down in area 1, area 2, area 4, and area 5 according to Fig. 1, respectively.
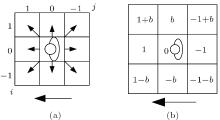
Take the transition rule in area 1 for example, the moving direction and neighborhood are shown in Fig. 6(a). To measure the probabilities of evacuees’ movement in the next time interval, a benefit matrix V is introduced with the elements vij, i, j = − 1, 0, 1. As shown in Fig. 6(b), we assume that the benefit value of moving forward is 1. On the contrary, the benefit value of moving backward is − 1. If one of neighbor cells is occupied by another evacuee, the value of v on the neighbor cell is − 1. On landings, evacuees also try to go along the shortest distance to evacuate, and a parameter b with 0 ≤ b ≤ 1 is introduced to demonstrate this phenomenon.
The benefit value of moving right ahead is the sum of benefit values of moving right and forward (the top left direction in Fig. 6). In this way, we have the benefit values of left ahead, right backward, and left backward. If a pedestrian stays where he/she is, the value is 0 since there is no benefit at all. Note that this benefit value is not a probability value, we transform it as follows:


where v’ ij is a temp matrix, s is a positive and small number with 0 < s < 1, this parameter s can insure that if the forward directions are occupied by others, pedestrians can stay where he/she is; Pij is the probability of moving to the neighbor cell with position i, j.
When people stay in emergency conditions, they may become nervous.[4] Evacuees’ behaviors will be changed due to their psychological status.[5] For example, when evacuees are nervous, they will become more aggressive and keep shorter distance than that in normal conditions. Evacuees will also increase their desired speeds in order to escape from a building as soon as possible. As shown in Fig. 7, the evacuees’ psychological status will be influenced by the emergency conditions (such as fire and smoke) and blockage. When evacuees are aggressive, they try to push their way to pass through the bottleneck, and their neighborhood will be changed from type A to type B. To measure this issue, critical density Dc is introduced in this simulation model. If the density of evacuees is higher than a critical density, evacuees will overcrowd and become aggressive. According to previous studies, [1] the critical density ranges from 1.4 persons/m2 to 2.1 persons/m2. The calculation region of density in this model is the stair between two floors, and the unit is m2.
Evacuees need to change their speeds in the simulation, so variable speeds are required. However, all evacuees have the same speed in traditional CA models.[17– 20] To address this issue, the system time interval is shortened in the simulation, and evacuees can move during several intervals instead of each interval which are used in traditional CA models.[17– 20] In other words, an evacuee’ s movement is updated at an integral multiple of this basic update interval instead of each system interval. For example, the basic update time is 0.05 s in our simulation, and the rise of the tread is assumed to be 0.2 m, and then the vertical speed is 0.40 m/s if the update interval is 0.5 s (ten times basic update time, and v = 0.2 m/0.5 s = 0.4 m/s). If she/he needs to speed up, the update interval will be shortened, i.e., the update interval can be 0.4 s with a speed 0.5 m/s. In the simulation, each evacuee’ s speed is input following the normal distribution which is derived by evacuees’ speeds in a fire drill or an evacuation event.
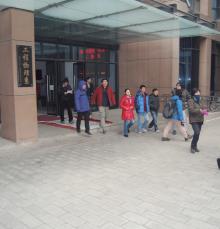
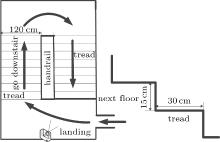
A fire drill was held in a high-rise office building with 11 floors in Tsinghua University. The floor number is from 1 to 11, and floor 1 is the lobby. People can go out of the building from floor 1. The ages of most participants range from 20 years to 60 years old, and they were told in advance that there would be a fire drill. A snapshot of the evacuation at the exit of the building is shown in Fig. 8. There are two staircases in the building, and we recorded the evacuation process in one staircase by video. Videos were set on the first floor, the sixth floor, the eighth floor, and the tenth floor because we only allowed evacuees above the 6th floor to use this stair. Totally 80 evacuees used the staircase with video record. The structure of the staircase and the position of the video are shown in Fig. 9. Evacuees’ vertical speeds follow a normal distribution N(0.37, 0.15), which means that the speed of evacuees in this drill is 0.37± 0.15 m/s.
Two simulations are carried out according to the results of the fire drill mentioned above. In simulation 1, evacuees’ walk preferences and psychological status are not considered, and evacuees’ average speed in the drill is input as agents’ speed. On the contrary, evacuees’ walk preferences and psychological status are considered in simulation 2, and the agents’ speeds follow the normal distribution of the speeds in the drill. In these two simulations, the number of students on each floor and the time when they come into the stair are the same as those in the fire drill.
The parameters, which are used to demonstrate the features in simulation 2, are calibrated based on the results of the fire drill. As participants wanted to evacuate as soon as possible, the attraction of going along the shorter route is higher. The parameters used to demonstrate the attraction are a and b with the values a = 0.3, b = 0.9. As mentioned in the previous section, parameter s is a positive small number, so let s = 0.01. As the stair is narrow and the students wear thick clothes in winter, the width of the shoulder is 0.5 m. Then the cell size on each tread is 0.5 m × 0.3 m and the cell size on each landing is 0.5 m × 0.5 m. The width of exit and handrail are set to be the width of one cell — 0.5 m. According to Ref. [1], the critical density Dc equals 2.1 p/m2. Both simulation 1 and simulation 2 are run based on Matlab 7.8.0 on an Intel Core i3 + 2.3 GHz Windows PC with 2 GB RAM. Each simulation is run 50 times, and we use IBM SPSS Statistics 19 to analyze the simulation data.
The relationship between the cumulative number of evacuees and the evacuation time is shown in Fig. 9. The drill-in time is the time when people entered into the staircase, and the drill-out time is the time when they left the staircase (drill-out time is evacuation time). The evacuation time of the fire drill is 446 s. In simulation 1, the evacuation time is 461 s which is 15 s longer than that in the fire drill. The evacuation time is 451 s in simulation 2 (the difference is 5 s), and this value is very similar to that in the fire drill.
To further validate the simulation, linear regressions of the results of the fire drill and simulations are carried out:Fire drill: y = 0.302x − 36.705, R2 = 0.803; Simulation 1: y = 0.280x − 31.573, R2 = 0.755; Simulation 2: y = 0.297x − 35.141, R2 = 0.797.
Based on the results of linear regressions, the results of simulation 2 are more similar to those of the fire drill than those of simulation 1. It is believed that our simulation is more accurate when considering evacuees’ walk preferences and psychological status.
Another fire drill was held in a high-rise building with 14 floors, and we video-recorded the evacuation process in one staircase. Videos were set on odd floors since we did not have enough equipment to record all the floors and all the staircases. The structure of the staircase and the position of the video are shown in Fig. 10. In this fire drill, a total of 72 students used the staircase with the video recorder. We did not record all the floors, so the students from even floors were seen as they came from the nearest floor below their floor. Evacuees’ vertical speeds follow a normal distribution N(0.48, 0.12), which means that the speed of evacuees in this drill is 0.48± 0.12 m/s.
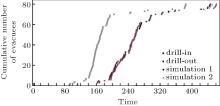 | Fig. 10. Evacuation times of both fire drill and simulation. |
In this simulation, the parameters, the computers, and the software are the same as those in the simulation of drill 1. The evacuation times of both the fire drill and the simulation are shown in Fig. 11, and the simulation results agree well with the fire drill results. The evacuation time of drill 2 is 228 s, and the evacuation time of the simulation is 225 s. Their difference is 3 s, indicating that the simulation is similar to the drill.
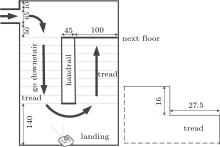 | Fig. 11. Structure of staircase, size of tread, and the position of video. The unit of each of the numbers is centimeter. |
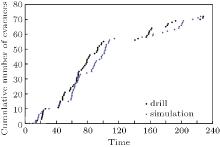 | Fig. 12. Evacuation time of both fire drill and simulation. |
In this study, the stair evacuation simulation is improved by considering evacuees’ walk preferences and psychological status, and three aspects of work are involved: simulation modeling, fire drills, and validation. It is found that our simulation is more accurate when taking into consideration the evacuees’ walk preferences.
| 1 |
|
| 2 |
|
| 3 |
|
| 4 |
|
| 5 |
|
| 6 |
|
| 7 |
|
| 8 |
|
| 9 |
|
| 10 |
|
| 11 |
|
| 12 |
|
| 13 |
|
| 14 |
|
| 15 |
|
| 16 |
|
| 17 |
|
| 18 |
|
| 19 |
|
| 20 |
|
| 21 |
|
| 22 |
|
| 23 |
|
| 24 |
|
| 25 |
|
| 26 |
|
| 27 |
|
| 28 |
|
| 29 |
|
| 30 |
|
| 31 |
|
| 32 |
|
| 33 | [Cited within:1] |
| 34 |
|


