Cosine fitting radiography and computed tomography

Cosine fitting radiography and computed tomography |
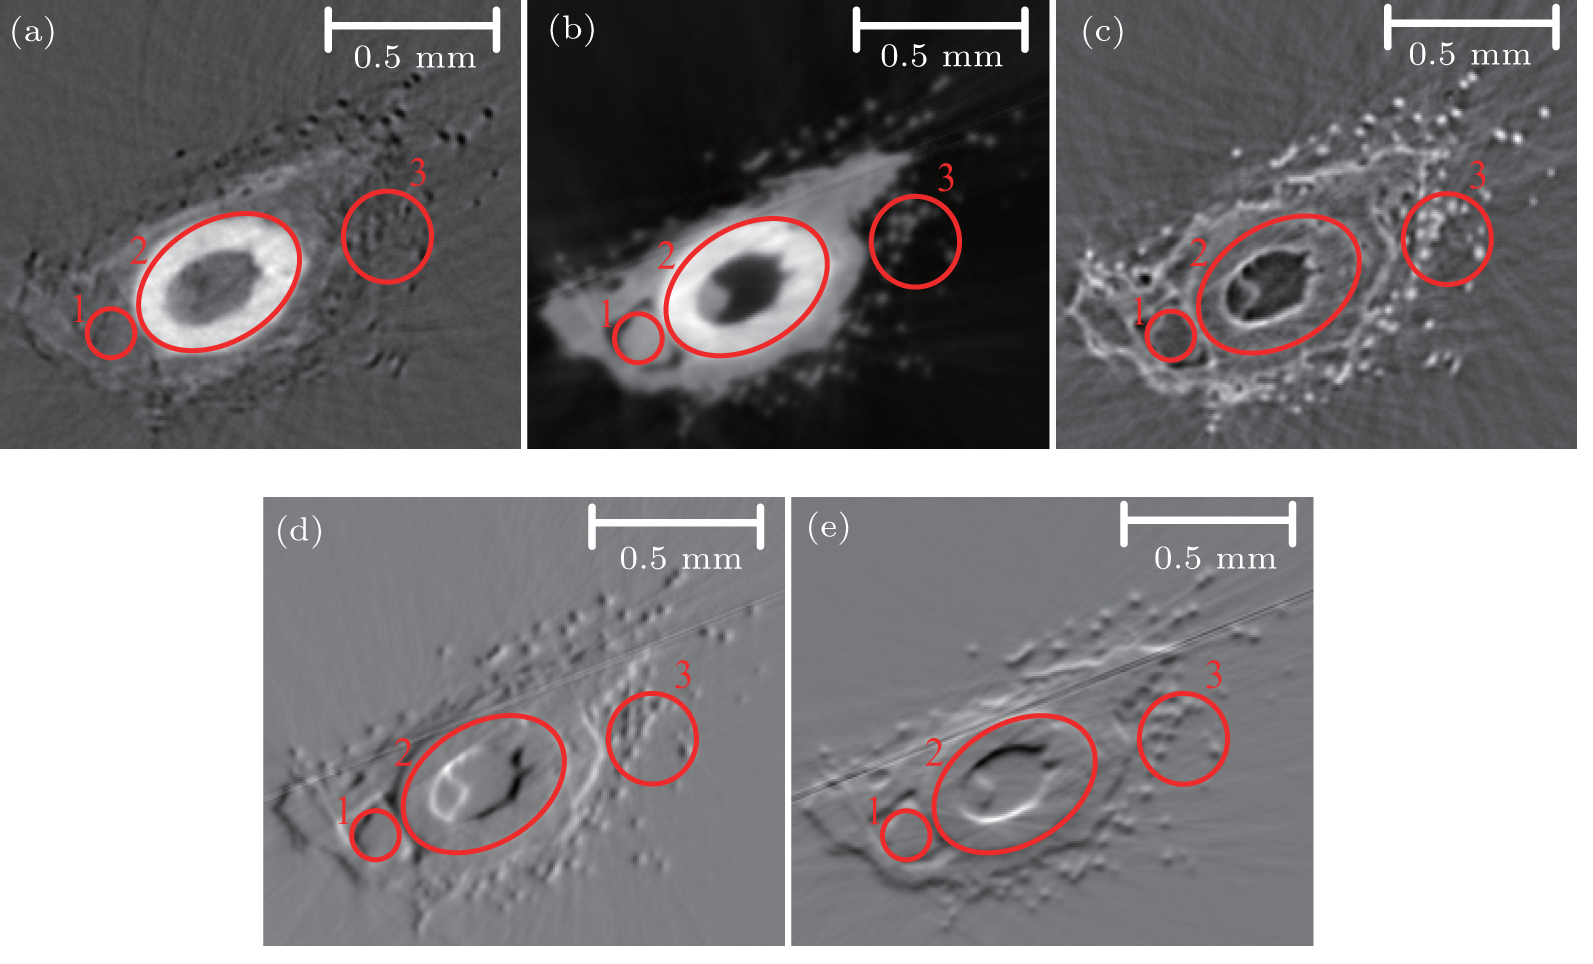
| Axial slices of the biological sample extracted with the CFR-CT method: (a) μ ( x ′, y ′, z ′), (b) δ ( x ′, y ′, z ′), (c) ω ( x ′, y ′, z ′), (d) ∂ δ ( x ′, y ′, z ′)/ ∂ x ′, and (e) ∂ δ ( x ′, y ′, z ′)/ ∂ z ′. Zooms shown in regions 1, 2, and 3 show respectively the tendons, bone structure, and the fluff of the sample. |
 |