Experimental research on the feature of an x-ray Talbot–Lau interferometer versus tube accelerating voltage

Experimental research on the feature of an x-ray Talbot–Lau interferometer versus tube accelerating voltage |
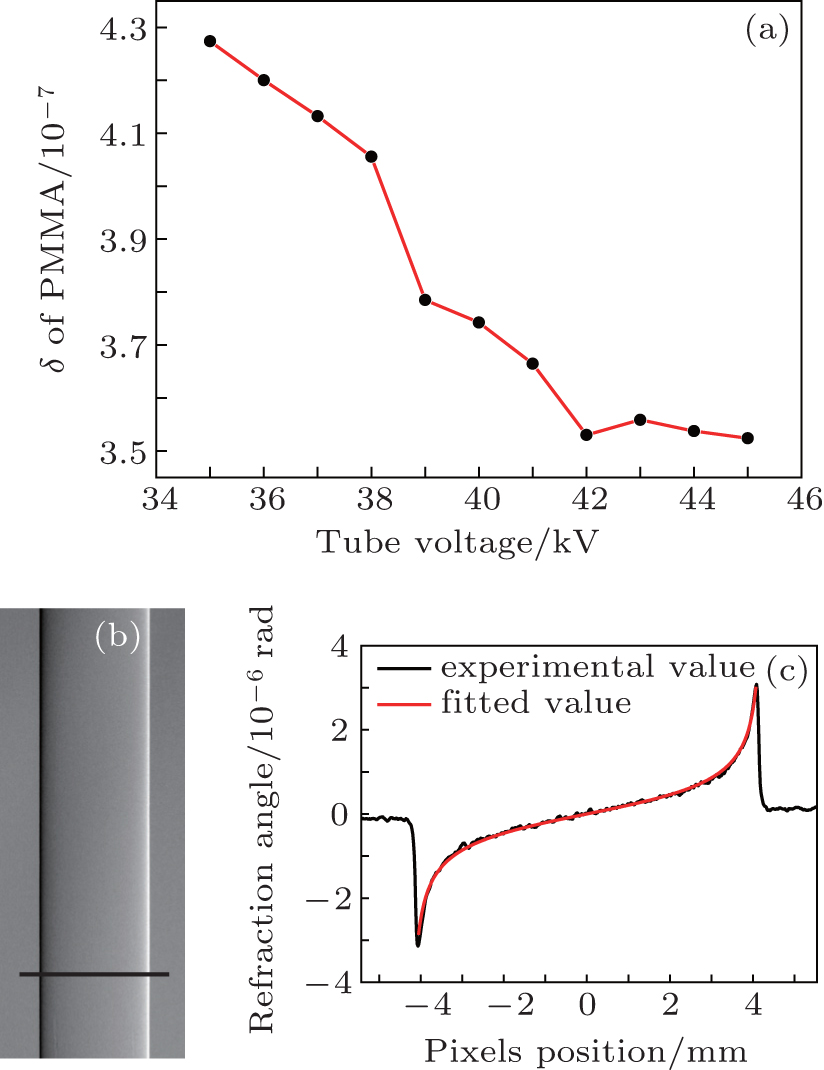
| (a) δ of the PMMA versus accelerating voltage; (b) and (c) the computing process of δ at 35 kV. The black curve in panel (c) is the refraction signal of the cross section chosen as in panel (b) and the red line in panel (c) is the best fit curve when δ is 4.27399×10⁻⁷. |
 |