Transient thermal analysis as measurement method for IC package structural integrity
Hanß Alexander, Schmid Maximilian, Liu E, Elger Gordon†
Transient thermal analysis as measurement method for IC package structural integrity |
|
Hanß Alexander, Schmid Maximilian, Liu E, Elger Gordon†
|
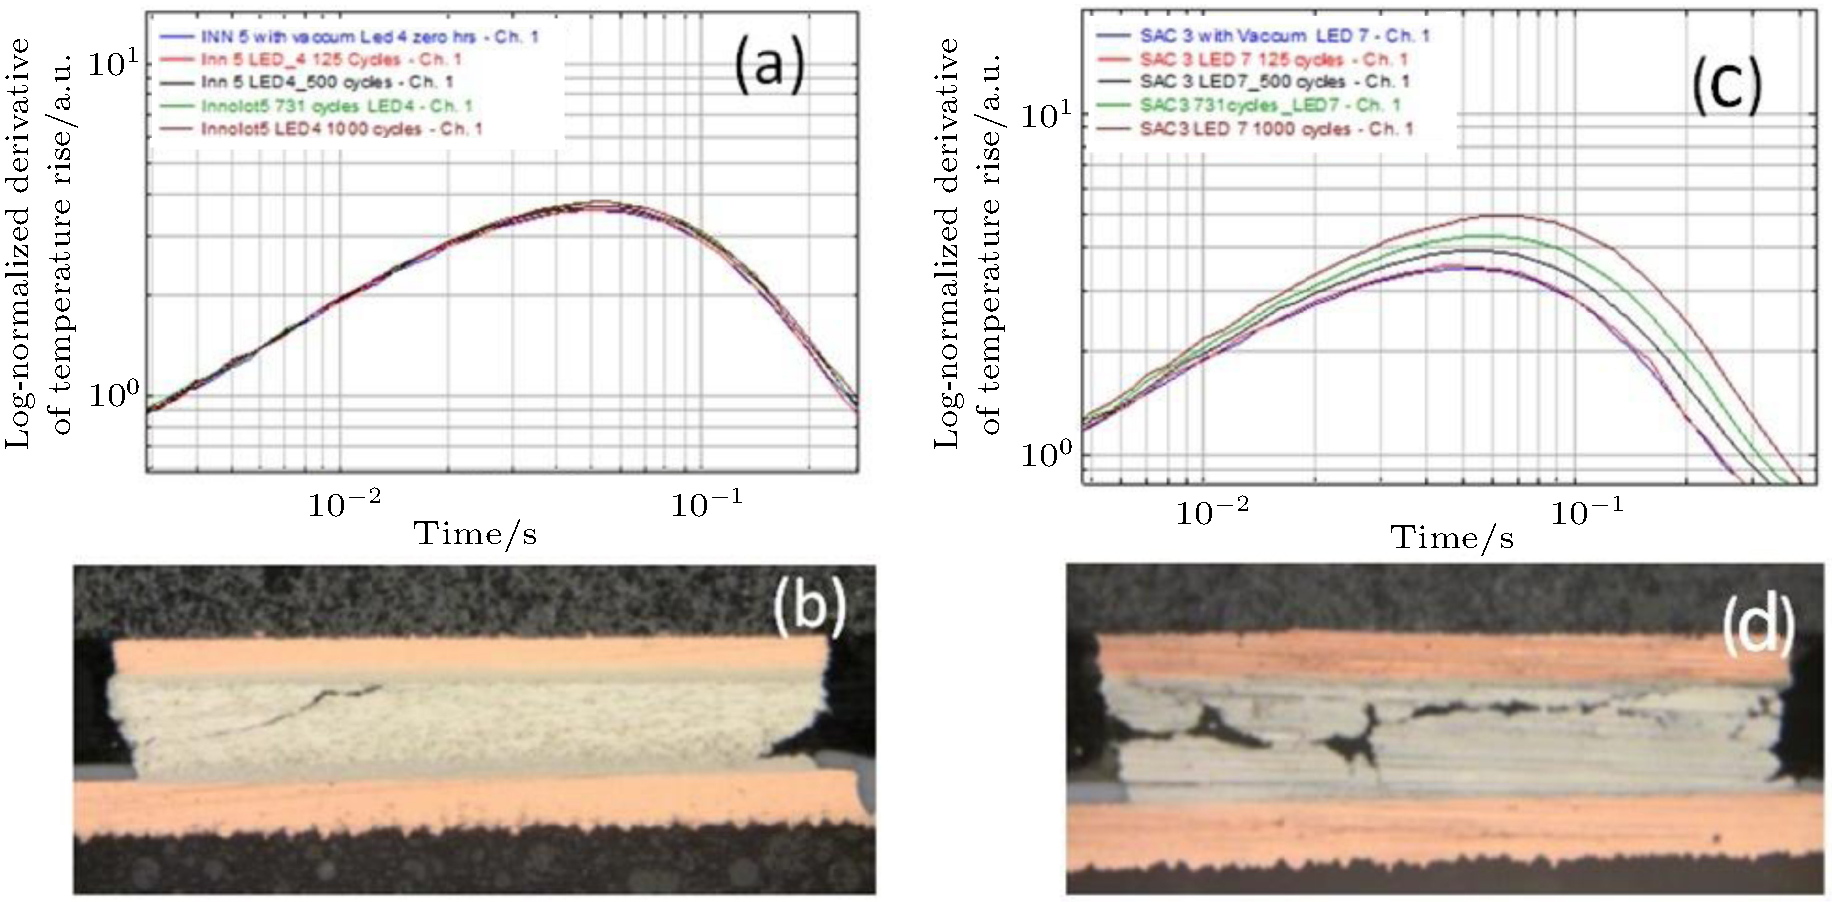
| Left: log-derivative plot of an Innolot sample at different temperature cycles (a); cross-section of the Innolot sample after 1000 TST cycles (b). Right: log-derivative plot of an SAC sample at different temperature cycles; (c) cross-section of the SAC sample after 1000 TST (d). The peak increase due to the crack in the solder joint is visible in the right figures [(c) and (d)]. |
| |